By Bradley Olson, Erin Ailworth and Sarah Kent
Exxon Mobil Corp. reported its worst quarterly results since
1999 on Friday, the latest in a parade of woeful earnings from oil
and gas producers world-wide for the first three months of 2016 as
a global supply glut dragged down prices and ate into profits.
Yet despite a 63% drop in profits to $1.8 billion, investors
shrugged off Exxon's performance and its shares rose 1.2% to $89.28
in early trading -- mirroring a trend that has generally pushed oil
and gas stocks up after first-quarter earnings as crude prices this
week rise to their highest levels of the year, spurring optimism in
the oil patch.
Many companies including oil majors BP PLC and Total SA, and
independent producers such as Pioneer Natural Resources Co., saw
their shares rise after reporting first-quarter earnings because
they either swung to a profit or reported smaller losses than
anticipated.
BP said earlier this week its net loss shrunk nearly 80% from
the prior quarter. On Wednesday France's Total and Norway's Statoil
ASA said they were back in the black last quarter after suffering
losses in the last three months of 2015.
The results reflect aggressive cost cuts, including slashing
spending plans for drilling and laying off large numbers of
workers, that companies have made to cope with a nearly two-year
slump in crude prices. Along with a surge in oil prices, which have
risen more than 70% from a February low past $45 a barrel this
week, the results have helped fuel a 9% rally in energy stocks in
the S&P 500 index in the past month.
"The market is already looking past these results since oil is
up almost 80% from earlier lows," said Brian Youngberg, an energy
analyst with Edward Jones. "The expectation was that earnings were
going to be really bad for the entire sector, but many companies
did better."
Not every company followed the trend. Chevron Corp. reported a
$725 million loss on Friday compared with a profit of $2.6 billion
in the first quarter of 2015. The greater-than-expected drop was
the first time in at least two decades that Chevron had two
consecutive quarterly losses.
Italian oil giant Eni SpA said Friday it had racked up a nearly
billion-dollar loss for the quarter, though its share price fell by
only 0.35% on Friday since the results weren't as bad as many
investors predicted.
In the U.S., the extreme belt tightening by oil companies is
finally leading to declines in crude output that are expected to
help rebalance the global market. Federal figures show U.S. oil
production fell below 9 million barrels a day a few weeks ago,
after peaking at 9.7 million in April 2015.
"Industry spending could be set to decline to levels not seen
since 2007," analysts at Citi Research said Monday, adding that
additional cuts "should be sufficient to deliver the necessary
declines in global production, with balance appearing within reach
in the second half of 2016."
Irving, Texas-based Exxon reported a profit of $1.81 billion, or
43 cents a share, down from $4.94 billion, or $1.17 a share, a year
earlier. Analysts polled by Thomson Reuters expected a per-share
profit of 31 cents. Revenue dropped 28% to $48.71 billion.
Some experts have warned that the draconian cuts oil companies
are making may make it harder for them to quickly ramp up
production later whenever prices rebound.
Scott Sheffield, chief executive of Pioneer, which reported a
first-quarter loss of $267 million, said his company will look to
add up to 10 rigs -- one or two at a time -- if the price of a
barrel of oil improves to about $50 a barrel.
But Mr. Sheffield, whose company is one of the primary producers
in the Permian Basin of Texas, one of the lower-cost U.S. shale
regions, said few of his U.S. industry peers can do the same unless
prices rise to $60 a barrel, and companies sell assets, raise
equity, and pay down debt.
"There's more debt in this downturn than I've ever seen," he
said Wednesday at a conference in New York. "You need at least $50
billion to $100 billion in deleveraging before you see a pickup, a
significant pick up, in rig counts."
The first-quarter results showed that some separation may be
occurring among U.S. shale producers based on the regions where
they are most active.
Hess Corp., a driller in North Dakota's higher-cost Bakken Shale
formation, which has been hard hit by the oil bust, reported a $509
million loss in the first quarter, smaller than expected. Chief
Executive John Hess said Wednesday his company won't increase its
drilling rig count in the Bakken until West Texas Intermediate
prices move closer to $60 a barrel.
"We do not believe that accelerating production in current price
environment makes sense," he said, adding that the company plans to
reduce its rig count in the Bakken play to two rigs from the
current three by the third quarter.
While the cost-slashing has helped oil and gas producers protect
their balance sheets, it's had a devastating impact on another part
of the business -- the oil-field services providers that drill and
pump wells.
Halliburton Co. took a $2.1 billion restructuring charge during
the quarter, stemming from severance costs and writing down the
value of assets and infrastructure no longer needed in the current
market. Baker Hughes Inc. reported a $981 million loss for the
quarter, on revenue that declined 21% from the previous quarter, to
$2.7 billion.
Even Schlumberger Ltd., the world's largest oil-field services
company, isn't immune. Chief Executive Paal Kibsgaard said
exploration and production companies "displayed clear signs of
operating in a full-scale cash crisis" during the first
quarter.
In North America, producers are cutting budgets by as much as
50% this year, Schlumberger said. The company expects international
spending to fall about 20%.
"This is the toughest environment we have seen for 30 years, and
it is likely to get even tougher before the market returns," Mr.
Kibsgaard said.
Alison Sider and Nicole Friedman contributed to this
article.
(END) Dow Jones Newswires
April 29, 2016 11:42 ET (15:42 GMT)
Copyright (c) 2016 Dow Jones & Company, Inc.
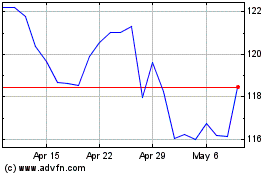
Exxon Mobil (NYSE:XOM)
Historical Stock Chart
From Mar 2024 to Apr 2024

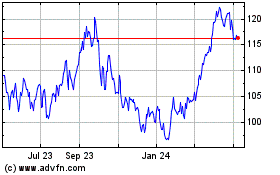
Exxon Mobil (NYSE:XOM)
Historical Stock Chart
From Apr 2023 to Apr 2024
