UNITED STATES
SECURITIES AND EXCHANGE COMMISSION
Washington, D.C. 20549
_________________
FORM 6-K
REPORT OF FOREIGN PRIVATE ISSUER
PURSUANT TO RULE 13a-16 OR 15d-16 UNDER
THE SECURITIES EXCHANGE ACT OF 1934
Date: November 3, 2015
UBS Group AG
Commission File Number: 1-36764
UBS AG
Commission File Number: 1-15060
(Registrants' Names)
Bahnhofstrasse 45, Zurich, Switzerland, and
Aeschenvorstadt 1, Basel, Switzerland
(Address of principal executive office)
Indicate by check mark whether the registrant files or
will file annual reports under cover of Form 20‑F or Form 40-F.
Form 20-F x
Form 40-F o
This Form 6-K consists of the presentation
materials related to the Third Quarter 2015 Results of UBS Group AG and UBS AG,
and the related speaker notes, which appear immediately following this page.


UBS
Third Quarter 2015 Earnings Call Remarks
November
3, 2015
Sergio P. Ermotti (Group CEO): Opening
remarks
SLIDE 2 – 3Q15 highlights – Group
Thank
you, Caroline. Good morning everyone.
For
the quarter, we reported a net profit attributable to UBS shareholders of 2.1
billion francs, which included a net tax benefit of 1.3 billion largely due to
the revaluation of deferred tax assets, and a provision of 592 million for
litigation, regulatory and similar matters. Adjusted profit before tax was 1
billion. These results led to a 5.4% quarter-on-quarter increase in tangible
book value per share to 12.7 francs. We also made further progress in our cost
reduction program, despite the cumulative impact of incremental permanent
regulatory costs, with annualized net cost reductions of 1 billion francs so
far.
The
macroeconomic backdrop for the quarter was very challenging, as events in China
and the expectation of a Fed hike followed by the Fed's decision not to raise
rates, elevated levels of uncertainty and volatility. These issues added to the
typical seasonality and client activity levels hit post-crisis lows,
particularly in wealth management. Given this exceptionally challenging
environment, our results were solid.
I
am most pleased with our performance because we managed risk effectively – for
our clients and shareholders, both when markets were booming and also when
markets fell. Despite the extreme market volatility that during the summer
prompted four times the normal level of margin calls in the quarter in Wealth
Management, we did not record credit losses.
We
remain the best capitalized large global bank, with a Basel 3 fully applied
CET1 ratio of 14.3%. Our fully applied Swiss SRB leverage ratio increased to 5%
and our BIS fully applied leverage ratio increased to 3.9%. Achieving a 5%
leverage ratio under the current rules equates broadly to the requirements
under the new rules, and underlines our view that we've never had a leverage
ratio issue, but instead a definition problem.
SLIDE 3 – 3Q15 highlights - Business
divisions
Turning
to the business divisions, Wealth Management delivered a resilient performance,
with around 700 million francs of high-quality pre-tax profit. Recurring
income increased, reflecting continued success in our strategic initiatives,
however transaction activity declined substantially as clients reacted to
extreme volatility.
Costs
have been carefully managed, and through the targeted front office headcount
reductions we have already implemented, the business is freeing up capacity to
invest in long-term growth.
Our
balance sheet and capital optimization program is a great example of this, and
we are very pleased with the results. It was a win-win result for clients and
for the bank. The vast majority of the clients chose to invest in products with
more attractive returns for them, at the same time improving our economic
profitability and reducing our leverage ratio denominator.
Adjusted
for the program and including almost four billion in outflows mostly related to
deleveraging in Asia, net new money was 3.5 billion, with positive inflows in
all regions. As I have said in the past and just explained, while net new
money is an important indicator of growth for the business, quality is far more
important to us than quantity, and our focus remains on sustainable long-term
performance.
Wealth
Management Americas delivered pre-tax profit of 287 million dollars on record
recurring income. Net new money was 500 million dollars and our advisors
remain the most productive in our peer group, with continued low attrition
rates.
This
quarter was an excellent example of how consistent client engagement,
especially with the benefit of our insight and advice, has helped clients
navigate difficult times. Our clients have benefitted from our disciplined
focus on active risk profiling, strategic asset allocation and diversification,
all of which helped mitigate the impacts of the severe market volatility.
At UBS, wealth management
is not just a business that we are in; it's part of our DNA. As the only truly
global wealth manager in the world, we are benefitting from the strong
long-term fundamentals of this business and will seek opportunities and
continue to capitalize on any dislocations the industry may experience.
Retail
and Corporate delivered its best first nine months since 2010, with a very
solid pre-tax quarterly profit of 428 million francs. Retail client assets and
loans continued to grow, and once again, all KPIs were within their target
range. Once again, these results reflect the significant investments we've made
in our home market over the last four years, and they underline our leading
position in, and commitment to, the Swiss market.
Asset
Management delivered a pre-tax profit of 137 million on strong management fees.
The business experienced net new money outflows of eight billion, much of which
related to low-margin passive products, reflecting elevated client liquidity
needs.
The
Investment Bank delivered very good results, both on an absolute and relative
basis, with a pre-tax profit of 614 million and strong performance in all
areas. Equities delivered its best third quarter since 2010 and revenues in FX,
rates and credit were up 37% year-over-year. We participated in several
notable transactions, including lead financial advisor on Anthem's acquisition
of Cigna; financial advisor to Ladbrokes on its merger with Coral and joint
sponsor and global coordinator for the China Reinsurance IPO, to name a few.
The IB again delivered high risk-adjusted returns within its allocated
resources, underlining the success of its client centric, low-inventory
business model, which is absolutely the right one for UBS.
So
overall, I'm pleased with the quarter. We stayed close to our clients in a very
challenging environment. Disciplined execution and our diversified business
model allowed us to deliver strong returns for our shareholders while
continuing to invest in our future.
SLIDE 4 -
Updated capital and key performance metrics
The
Swiss Federal Council recently proposed stricter capital rules for global
systemically important banks, making the Swiss regime by far the most demanding
in the world on a relative basis. Tom will take you through the details of the
proposals but I can confirm that UBS will be compliant with the new rules at
inception and we intend to use the four year period to fully implement the new
requirements.
Compliance
with the new requirements will come at a significant additional cost, which
will have an impact on return on tangible equity of up to 300 basis points. We
will continue to work hard to offset these headwinds through further balance
sheet optimization, executing our existing efficiency programs and by
reflecting the increased cost of capital in the pricing of our products and
services.
At
the same time the market environment has become more challenging. Implied
forward rates are materially lower than previously expected, we continue to
operate with negative interest rates in Switzerland and Europe, and market
returns are lower than long term averages, which has impacted invested asset
levels.
At
UBS targets do matter, as we believe we cannot run a successful business and
create the appropriate accountability without them. They encourage management
to take the right actions and despite very challenging markets have helped
drive our successful transformation. In the real world things do change, and as
I just described, regulation and the macroeconomic environment have changed
materially, so we need to adjust both our actions and our expectations
accordingly, but what must remain constant is our discipline and determination
to deliver what we have promised in areas which we can control.
Despite
some of the challenges I've mentioned, we've generated an adjusted year to date
return on tangible equity of 14.5%, substantially above our target of around
10% for the year. We firmly believe our business model can generate adjusted
returns on tangible equity of greater than 15%, but due to the macroeconomic
and regulatory environment, and substantial DTA write-ups in the past two
years, it is only realistic to temper our expectations in terms of timing. Due
to regulatory inflation, we expect the Group's RWAs to trend to around 250
billion in the short-to-medium term. This represents de-facto, no overall
change in our risk taking capacity.
The
Group's LRD is likely to trend around 950 billion, providing modest additional
capacity for our businesses. This may seem like a counter-intuitive reaction to
higher leverage requirements, but as the rules are now more clearly defined. So
this is now simply reflecting those and other minor adjustments, and the fact
that it would be impossible to deliver long term sustainable growth and
attractive and increasing capital returns by cutting our resources further. As
I've said in the past, our strategic transformation is complete, we have the
right strategy and shrinking to greatness is not part of it.
But
let me be absolutely clear about two issues. First, there will be no change in
our capital allocation philosophy and our discipline around limits, therefore
the Investment Bank for example, will continue to represent no more than 30-35%
of the Group's total LRD and RWA. Second, while for the foreseeable future,
leverage ratio will be the binding constraint, we will continue to manage the
risk of the bank based on risk weighted assets under advanced models, with
leverage and stress as additional components. We believe this is the most
appropriate approach to prudently manage risk for a bank like ours, and to
produce sustainable risk adjusted results.
Most
importantly our commitment to our capital returns policy is unchanged and we
will continue to target a pay-out ratio of at least 50% of net profit, subject
to maintaining a fully applied Basel III CET1 ratio of at least 13%, and 10%
post-stress.
Thank
you and I will now turn it over to Tom for detail on the quarter.
Tom Naratil (Group CFO & Group COO):
Walk-through of the quarter
SLIDE 5 – UBS Group AG results (consolidated)
As
usual, my commentary will reference adjusted results unless otherwise stated.
This
quarter, we excluded an own credit gain of 32 million Swiss francs, a gain of
81 million related to our investment in the SIX Group, foreign currency
translation losses of 27 million from the disposal of a subsidiary, net
restructuring charges of 298 million, and a 21 million credit related to a
change to retiree benefit plans in the US.
Profit
before tax was one billion francs, and net profit attributable to UBS Group AG
shareholders was 2.1 billion, including a net tax benefit of 1.3 billion.
Return on tangible equity was 19.5% for the quarter, and 14.5% year-to-date.
Slide 6 – The World's leading wealth
management franchise
Our
wealth management businesses delivered another solid quarter, with a combined
profit before tax of one billion, bringing us to 3.1 billion year-to-date, at a
compound annual growth rate of 14% since 2012. As always, our focus is on
long-term profitable growth, and we're targeting a combined annual pre-tax
profit growth rate of 10-15% through the cycle for the combined businesses.
Slide 7 - Wealth Management
Wealth
Management delivered a profit before tax of 698 million, as continued growth in
recurring income was more than offset by lower transaction-based revenues.
Recurring
revenues increased on higher net interest income, which rose 6% to 600 million
on higher lending and deposit revenues. Recurring net fee income declined
slightly as the benefits from our strategic initiatives to increase mandate
penetration and improve pricing were more than offset by the impact of lower
invested assets.
Transaction-based
income declined to its lowest level since the financial crisis, as high
volatility led to a substantial reduction in client activity, primarily in APAC
and Europe.
The
business demonstrated solid cost control, with expenses down 1% to 1.2 billion.
The cost/income ratio was 64%, within our target range of 55 to 65%.
Slide 8 -
Wealth Management
We're
pleased with the quality of the net new money we've delivered so far this year.
Internally, we measure our performance using return-adjusted net new money. On
this measure, we've seen an improving quality of flows in the quarter and
year-to-date.
Mandate
penetration increased by 70 basis points to 27%, as the business delivered 4.8
billion in net new mandates, with balanced distribution across regions.
Loan
balances were down marginally as positive currency translation effects were
more than offset by the impact of deleveraging.
Invested
assets declined for the third consecutive quarter, which last occurred at the
onset of the Eurozone crisis.
Monthly
gross margin trended down throughout the quarter, from 86 basis points in July,
to 81 basis points in August, and to 80 basis points in September. Fourth
quarter revenues will be affected by invested asset levels at the end of the
third quarter, as well as the gross margin in September.
Slide 9 - Wealth Management
Adjusted
net new money was positive in all regions, despite client deleveraging.
Operating
income was down slightly in Switzerland, but gross margin increased on a lower
invested asset base. Operating income increased in Emerging markets, while
decreasing in Europe and APAC, with sharp declines in transaction-based income.
Slide 10 - Wealth Management Americas
Wealth
Management Americas delivered a profit before tax of 287 million dollars, up
24% on record recurring income and lower expenses, partly offset by lower
transaction-related income.
Operating
income was 1.9 billion, with recurring income increasing 2% to 1.5 billion,
accounting for a record 80% of total income. Strong recurring income reflected
record net fees, which increased 1% on higher managed account fees, and also
record net interest income, which increased 3% on growth in lending and deposit
balances.
Operating expenses decreased
by 4%, mainly due to lower net charges for provisions for litigation,
regulatory and other matters, as well as lower legal fees.
Slide 11 - Wealth Management Americas
Net
new money was half a billion dollars, driven by inflows from advisors who've been
with the firm for more than one year.
Invested
assets declined to just under a trillion dollars, mainly due to negative market
performance. Managed account penetration increased by 20 basis points, to a
record 34.4% of invested assets.
Both
gross and net margins were up 2 basis points in the quarter. Gross margin was
steady for most of the quarter, but, fell slightly in September to 75 basis
points. Wealth Management Americas' fourth quarter will be impacted by the
closing level of invested assets from the third quarter, which is 5% lower than
for 2Q.
Slide 12 - Wealth Management Americas
FA
productivity remained industry-leading with annualized revenue per FA of over
1.1 million dollars and invested assets per FA of 142 million. Since 2009, our
revenue per FA has increased at a compound annual growth rate of 9.4%.
Loan
balances continued to grow, as they increased 200 million to 47.5 billion
dollars. Average mortgage balances increased 4% to 8.4 billion dollars and
securities-backed lending balances were up 2% to 33.5 billion.
Slide 13 - Retail & Corporate
Retail
and Corporate delivered another strong quarter with profit before tax up 3% to
428 million, and all KPIs within their target ranges. Year-to-date, the
business has delivered 1.3 billion in profit before tax, the highest since
2010.
Operating
income increased 1%, mainly due to higher net interest income from lending and
deposits, and also from lower credit loss expenses.
Net
credit losses were negligible, as we saw no new material cases in the quarter.
Notwithstanding
the continued low levels of credit loss expenses, we're closely monitoring
developments in the Swiss economy where we remain mindful that the continued
strength in the Swiss franc could have a negative effect on the economy and
exporters in particular, which may impact some of the counterparties in our
domestic lending portfolio.
Annualized
net new business volume growth for our retail business remained solid at 2.5%.
This was driven by growth in deposits and, to a lesser extent, growth in
lending balances, which is consistent with our strategy to grow our
high-quality loan business moderately and selectively.
We
continued to attract new domestic clients, with year-to-date net new client
accounts rising to a record of over 22,000, up 35%.
Wealth
Management Switzerland has recently undertaken a review of its client
portfolio, and identified relationships which would be better served by the
Retail business. As a result, in the fourth quarter, Retail & Corporate will
pay a one-time acquisition fee of approximately 50 million to Wealth Management
for anticipated annual revenues of 30 million and new business volume of around
4 billion. The 50 million fee will not be treated as an adjusting item, and
there will be no significant impact on net new money in Wealth Management or
net new business volume in Retail & Corporate.
Slide 14 - Asset Management
In
Asset Management, operating income increased by 5% to 502 million, on higher
net management fees, with increases in traditional investments and Global Real
Estate.
Performance
fees increased slightly to 23 million, as investment performance continued to
be subdued in O'Connor and Hedge Fund Solutions, in very challenging market
conditions for alternative asset managers.
Expenses
were 365 million, up 7% on higher personnel expenses and net charges from other
business divisions and Corporate Center.
Net
new money excluding money markets was negative 7.6 billion, as the third
quarter included 15 billion of outflows, mainly from lower margin passive
products, driven by client liquidity needs. The combined annual revenue loss
from these large outflows is only about 5 million. Excluding this small number
of clients, net new money was positive 7.4 billion. Net new money from our
wealth management clients, excluding money markets, was around 300 million, and
was positive for the 7th consecutive quarter.
Slide 15 - Investment Bank
The
Investment Bank delivered a very strong quarter with profit before tax of 614
million. Operating income was up 6% year-on-year to 2.1 billion, the highest
it's been in a third quarter since 2012.
ICS
revenues increased 13% to 1.4 billion.
FX,
Rates and Credit revenues were up 37%, driven by a strong flow Rates and Credit
performance, and only partially due to a comparatively weak 3Q14. The business
continued to carefully manage inventory, operating at a high velocity, and
managing within tight risk and balance sheet limits.
Equities
revenues were up 4%, with strong performance in Cash Equities. Regionally, the
Americas saw increases in all business lines, particularly in Derivatives.
Corporate
Client Solutions revenues declined by 4%, as strong performances from DCM and
ECM were more than offset by lower revenues from Financing Solutions, Advisory
and Risk Management. We performed better than the market fee pool across our
capital markets businesses.
Operating
expenses decreased 54% year-on-year, as the prior period included substantial
charges for litigation, regulatory and similar matters. Excluding these
charges, expenses were down 2%, reflecting positive operating leverage and
continued improvements in cost efficiency. The IB's cost/income ratio was 70%,
at the bottom end of our target range of 70-80%.
Slide 16 - Investment Bank
Our
model focuses on our clients, and is designed to capture client flows, with
limited mark-to-market risk, in order to deliver strong risk adjusted returns.
Our
resource utilization has been consistent, and we've delivered industry leading
returns on RWA, and average revenue per unit of VaR of around 180 million over
the last 11 quarters.
Our
teams in the Investment Bank achieved good productivity in the quarter despite
the extraordinary market volatility, and we continued to operate with
comparatively low levels of VaR and RWA.
Slide 17 - Corporate Center
Profit
before tax in Corporate Center Services was negative 255 million, roughly
unchanged from the prior quarter. Operating expenses before allocations
decreased due to lower personnel expenses and occupancy costs.
Profit
before tax in Group Asset and Liability Management was negative 116 million
compared with negative 127 million in the prior quarter. We saw a loss of 201
million from interest rate derivatives used to hedge our high-quality liquid
asset portfolio. Declining USD interest rates resulted in losses on these
derivatives, which are marked-to-market through P&L, whereas the respective
high-quality liquid assets are held as available-for-sale, with unrealized fair
value gains recorded in OCI.
Profit
before tax in Non-core and Legacy Portfolio was negative 803 million. Operating
income of negative 126 million included valuation losses of 20 million, and
higher losses, primarily in rates, from ongoing novation and unwind activity in
addition to re-hedging costs.
Operating
expenses increased by 510 million, as net charges for provisions for
litigation, regulatory and similar matters increased.
Once
again, we had a significant reduction in LRD in the quarter, and the balance
now stands at roughly 20% of what it was when NCL was created in 2012.
Slide 18 - Corporate Center cost reductions
We
achieved an additional 100 million of annualized net cost reduction in the
Corporate Center, bringing the total to one billion, based on the September
exit rate versus full-year 2013. Savings in the quarter were driven by
decreases in Corporate Real Estate and Services, operations and NCL.
Regulatory
demand continues to be a headwind, amounting to an estimated 1.1 billion francs
for 2015, including approximately 400 million of a permanent nature and 700
million of a temporary nature. We'll continue to work hard to offset permanent
regulatory costs in order to achieve our targeted net cost reductions. We've
taken out a billion of net costs in the Corporate Center since 2013, and we're
committed to taking out an additional 1.1 billion by 2017.
Slide 19 – Net tax benefit and deferred tax
assets
In
the third quarter, our net tax benefit included a net increase in recognized
deferred tax assets of 1.5 billion. This included 1.3 billion related to the
net upward revaluation of US DTAs, reflecting updated profit forecasts, which
contributed approximately 200 million, and an extension of the recognition
period for future profits from 6 to 7 years, which contributed the remaining
1.1 billion.
We
recognized 75% of the expected full-year DTA write-up in the third quarter, and
we expect to book the remaining 25%, or approximately 500 million, in the
fourth quarter.
Our
future profits in the US, where we still have over 15 billion francs of
unrecognized DTAs, will be the main driver of recognition and usage of DTAs in
the long-term, reinforcing the value of our US franchise.
As
a reminder, the recognition of tax loss DTAs does not immediately affect fully
applied CET1 capital, since higher tax loss DTA recognition in the P&L is
offset by an equivalent deduction in the capital account. However, the
utilization of tax losses against taxable income over time, leads to reduced
tax expenses, which will benefit CET1 capital.
As
we look to 2016 and beyond, our internal thresholds to extend the recognition
periods for US DTAs become more challenging, and at this point in time, we
expect no further extension in the recognition period. We currently expect a
net upward revaluation of tax loss DTAs of approximately 500 million for 2016.
Slide 20 - Capital and leverage ratios
We
continued to improve our leverage ratio, increasing our fully applied Swiss SRB
ratio by 30 bps to 5%, on increased CET1 capital and AT1 issuance. Fully
applied CET1 capital increased by around 700 million to 30.9 billion, mainly
reflecting operating profit from the quarter.
Previously,
we flagged that our SRB and BIS spot LRD would converge at year-end. At this
point in time, we're likely to see BIS LRD slightly lower than SRB on a spot
basis at year-end.
Our
fully applied CET1 ratio remained the highest among large global banks, at
14.3%, despite a 6 billion increase in RWA.
Slide 21 - Capital requirements under revised
Swiss TBTF proposal
Sergio
already touched on the Swiss Federal Council's proposals for higher capital
requirements for Swiss global systemically important banks, which are required
to be fully compliant by the end of 2019. We intend to use the four year
transitional period to implement the new requirements.
The
proposal sets out a required going concern leverage ratio of 5% of the BIS
leverage ratio denominator, in order to qualify as well capitalized. Of the 5%,
at least 3.5% must be held in CET1 with the remainder in high-trigger AT1.
The
corresponding risk-weighted requirement is 14.3%, with at least 10% from CET1
and up to 4.3% in high-trigger AT1. The going concern element in both ratios
includes a progressive component, driven by the bank's total exposure and
market share.
The
gone concern requirement mirrors the going concern requirement, at 5% of LRD
and 14.3% of RWA, which is to be met with bail-in eligible instruments. This
amount may be reduced by up to 2% of LRD and 5.7% of RWA, depending on a bank's
progress in implementing measures to improve its resilience and resolvability.
As we've made significant progress in addressing our resolvability, we're
confident that we'll qualify for a meaningful rebate and we look forward to
further clarifications on the process in due course.
The
TBTF proposal also includes transitional arrangements for existing capital
instruments. AT1 low-trigger instruments can be counted towards the AT1
high-trigger going concern requirement until their first call date, which can
be after 2019. Tier 2 capital will be recognized as AT1 high-trigger going
concern until the earlier of its first call date or the end of 2019, and as
gone concern capital thereafter.
Slide 22 - Capital requirements under revised
Swiss TBTF proposal
We'll
be compliant with the new rules at inception, and we're well prepared to meet
the final 2019 requirements. We have the best capital position among our peer
group, and we operate a strong, successful and highly capital generative
business.
Our
CET1 leverage ratio already stands at 3.3%, and we can achieve the required
3.5% by retaining a further 2 billion of CET1 capital through earnings over the
next 4 years.
Based
on our current BIS exposure and under the grandfathering proposals, we've met
the 1.5% high-trigger Tier 1 going concern requirement. We also continue to
plan on issuing around 2 billion of high-trigger AT1 to our employees through
our deferred contingent capital plan, bringing us to a sustained balance of 2.5
billion, and we expect to replace maturing grandfathered instruments with
Group-issued high-trigger AT1 over the transition period.
As
for the gone concern requirements, we completed our inaugural TLAC issuance in
September, successfully placing four billion of bail-in debt out of UBS Group
AG, and today, we've announced our inaugural Euro TLAC issuance shortly. We
currently have 6.5 billion of Tier 2 low-trigger capital maturing after 2019,
which will count towards our gone concern leverage ratio on a grandfathered
basis until first call date, even after the full phase-in of the requirements.
We
have 33 billion of senior unsecured debt and covered bonds which will mature
through 2019. Any remaining gone concern requirement will be met by replacing
this maturing UBS AG debt. We expect to absorb the TLAC requirements without
the need to increase the overall funding for the Group.
Slide 23 - ROTE – implications of revised
TBTF proposal
We
estimate the new proposals to have a combined ROTE drag of approximately 270
basis points, reflecting higher tangible equity and additional funding costs.
A
response to increased capital requirements could be to attempt to drive RoTE
higher by robotically slashing resources. However, we think it's more
appropriate to manage our resource levels to balance increasing returns on
tangible equity with growing capital returns to shareholders.
Slide 24 - Impact of regulation on RWA
Since
we announced our targets in 2012, Group operational risk RWA have increased by
around 20 billion, mostly from the FINMA add-on. In addition, regulatory
multipliers on credit risk are estimated to add approximately 30 billion of
increased RWA. As a result of current and known future regulatory inflation, we
expect our current RWA to trend to around 250 billion in the short to medium
term. This represents no increase in useable RWAs and no change in our risk
appetite.
There
is certainly future upward pressure in the regulatory pipeline, but we don't
believe that RWA should increase to binding levels, and as a result, leverage
ratio will likely remain the binding constraint for UBS.
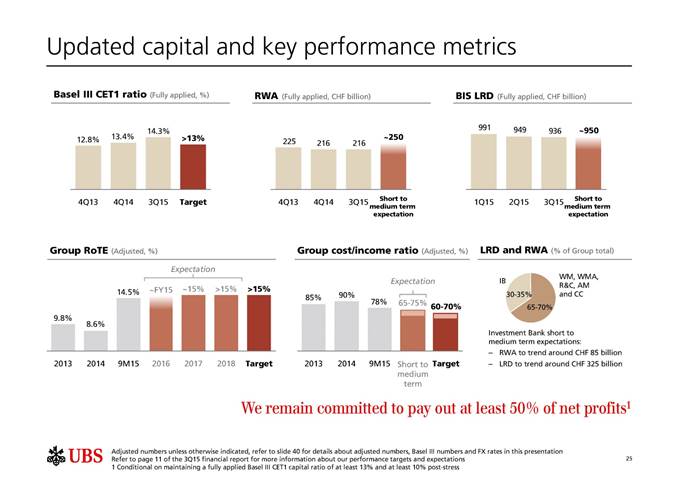
Slide 25 – Updated capital and key
performance metrics
Earlier,
Sergio walked through our updated expectations after taking into account new
capital requirements and the current market environment.
Next
year, we expect our adjusted return on tangible equity to be around the same
level as full-year 2015, with it increasing towards 15% in 2017, achieving the
target in 2018.
In
addition to these revised expectations on returns, we also expect our
cost/income ratio to be around 65-75% for the short to medium term, potentially
above our target range, as we absorb regulatory costs and macroeconomic
headwinds.
Our
expected LRD and RWA mix among our business divisions remains the same, and the
Investment Bank is expected to have RWA of around 85 billion and LRD around 325
billion in the short to medium term.
As
for the Non-core and Legacy Portfolio, since its inception, we've reduced LRD
by around 80% and RWA by around 70%. Our objective is to continue to reduce
exposures, while actively optimizing shareholder value.
On
a personal note, to the analysts on the call, this is our eighteenth quarterly
result together and I appreciate the challenge, questions, advice and insight
you've provided over the years. You're left in the hands of Caroline Stewart
and a superb Investor Relations team and a very capable CFO-designate, Kirt
Gardner. Hopefully, our paths will cross in the future.
Now,
I'll pass it back to Sergio, who will provide some concluding remarks.
Sergio P. Ermotti (Group CEO): Closing
remarks
SLIDE 26 – Executing our strategy…
Thank
you Tom
The
strategic change we initiated 4 years ago was driven by our desire to focus on
our strength and by expectations of more demanding regulation. So having
completed our transformation we have the right business model today, with no
need for further radical change to comply with the strict new TBTF proposals.
This puts UBS in a unique position among our peers. Therefore we can capitalize
on our early-mover advantage, build on our execution track record and continue
to implement our strategy to better serve our clients, drive shareholder value
and grow capital returns.
In
the current macroeconomic and regulatory environment our commitment to our
remaining cost reduction programs and our efforts to drive operational
excellence remains resolute.
But
we also have a strategy for growth. We will modestly increase balance sheet
capacity for our businesses to support sustained long term growth, in a
disciplined way. And, we will continue to invest both in technology and
digitization, strengthen our position in the Asia Pacific region and the
Americas and ensure we have the right people to drive our future success.
You
will have noticed that we announced changes to our leadership team today. Let
me start by thanking Bob, who will continue to play an important role working
with clients and on strategic priorities, as well as Phil and Chi-Won, not only
for their tremendous contributions to the firm, but also for working with me
for the last few months in order to allow me to align the changes to the time I
believe is right for the firm. I welcome Kathy, Sabine, Axel, Kirt and
Christian to the Group Executive Board and Tom to his new role. Following the
completion of our strategic transformation earlier this year and as we continue
executing our plans, this team will help take the firm to the next level
providing the right mix of expertise and continuity.
Back
to our results. We reported another set of solid numbers, which once again
demonstrated strong risk control and discipline.
For
the past four years, we have demonstrated that our business model works for our
clients and investors, and we will continue with the same determination to
execute our strategy in order to create sustainable value for our shareholders.
Thank
you and now Tom and I will take your questions.
Cautionary
statement regarding forward –looking statements: This
presentation contains statements that constitute “forward-looking statements,”
including but not limited to management’s outlook for UBS’s financial
performance and statements relating to the anticipated effect of transactions
and strategic initiatives on UBS’s business and future development. While these
forward-looking statements represent UBS’s judgments and expectations
concerning the matters described, a number of risks, uncertainties and other
important factors could cause actual developments and results to differ
materially from UBS’s expectations. These factors include, but are not limited
to: (i) the degree to which UBS is successful in executing its announced
strategic plans, including its cost reduction and efficiency initiatives and
its planned further reduction in its Basel III risk-weighted assets (RWA) and
leverage ratio denominator (LRD), and the degree to which UBS is successful in
implementing changes to its business to meet changing market, regulatory and
other conditions; (ii) developments in the markets in which UBS operates or to
which it is exposed, including movements in securities prices or liquidity,
credit spreads, currency exchange rates and interest rates and the effect of
economic conditions and market developments on the financial position or
creditworthiness of UBS’s clients and counterparties; (iii) changes in the
availability of capital and funding, including any changes in UBS’s credit
spreads and ratings, as well as availability and cost of funding to meet
requirements for bail-in debt or loss-absorbing capital; (iv) changes in or the
implementation of financial legislation and regulation in Switzerland, the US,
the UK and other financial centers that may impose, or result in, more
stringent capital (including leverage ratio), liquidity and funding
requirements, incremental tax requirements, additional levies, limitations on
permitted activities, constraints on remuneration or other measures; (v)
uncertainty as to when and to what degree the Swiss Financial Market
Supervisory Authority (FINMA) will approve reductions to the incremental RWA
resulting from the supplemental operational risk capital analysis mutually
agreed to by UBS and FINMA, or will approve a limited reduction of capital
requirements due to measures to reduce resolvability risk; (vi) the degree to
which UBS is successful in implementing changes to its legal structure to
improve its resolvability and meet related regulatory requirements, including changes
in legal structure and reporting required to implement US enhanced prudential
standards, implementing a service company model, the transfer of the Asset
Management business to a holding company, and the potential need to make
further changes to the legal structure or booking model of UBS Group in
response to legal and regulatory requirements relating to capital requirements,
resolvability requirements and proposals in Switzerland and other countries for
mandatory structural reform of banks; (vii) changes in UBS’s competitive
position, including whether differences in regulatory capital and other
requirements among the major financial centers will adversely affect UBS’s
ability to compete in certain lines of business; (viii) changes in the
standards of conduct applicable to our businesses that may result from new
regulation or new enforcement of existing standards, including measures to
impose new or enhanced duties when interacting with customers or in the
execution and handling of customer transactions; (ix) the liability to which
UBS may be exposed, or possible constraints or sanctions that regulatory
authorities might impose on UBS, due to litigation, contractual claims and
regulatory investigations, including the potential for disqualification from certain
businesses or loss of licenses or privileges as a result of regulatory or other
governmental sanctions; (x) the effects on UBS’s cross-border banking business
of tax or regulatory developments and of possible changes in UBS’s policies and
practices relating to this business; (xi) UBS’s ability to retain and attract
the employees necessary to generate revenues and to manage, support and control
its businesses, which may be affected by competitive factors including
differences in compensation practices; (xii) changes in accounting or tax
standards or policies, and determinations or interpretations affecting the
recognition of gain or loss, the valuation of goodwill, the recognition of
deferred tax assets and other matters; (xiii) limitations on the effectiveness
of UBS’s internal processes for risk management, risk control, measurement and
modeling, and of financial models generally; (xiv) whether UBS will be
successful in keeping pace with competitors in updating its technology,
particularly in trading businesses; (xv) the occurrence of operational
failures, such as fraud, misconduct, unauthorized trading and systems failures;
(xvi) restrictions to the ability of subsidiaries of the Group to make loans or
distributions of any kind, directly or indirectly, to UBS Group AG; (xvii) the
effect that these or other factors or unanticipated events may have on our
reputation and the additional consequences that this may have on our business
and performance; and (xviii) the degree to which changes in regulation, capital
or legal structure, financial results or other factors may affect UBS’s ability
to maintain its stated capital return objective. The sequence in which the
factors above are presented is not indicative of their likelihood of occurrence
or the potential magnitude of their consequences. Our business and financial
performance could be affected by other factors identified in our past and
future filings and reports, including those filed with the SEC. More detailed
information about those factors is set forth in documents furnished by UBS and
filings made by UBS with the SEC, including UBS’s Annual Report on Form 20-F
for the year ended 31 December 2014. UBS is not under any obligation to (and
expressly disclaims any obligation to) update or alter its forward-looking
statements, whether as a result of new information, future events, or
otherwise.
Disclaimer:
This presentation and the information contained herein are provided solely for
information purposes, and are not to be construed as a solicitation of an offer
to buy or sell any securities or other financial instruments in Switzerland,
the United States or any other jurisdiction. No investment decision relating to
securities of or relating to UBS Group AG, UBS AG or their affiliates should be
made on the basis of this document. Refer to UBS's third quarter 2015 report
and its Annual report on Form 20-F for the year ended 31 December 2014. No
representation or warranty is made or implied concerning, and UBS assumes no
responsibility for, the accuracy, completeness, reliability or comparability of
the information contained herein relating to third parties, which is based
solely on publicly available information. UBS undertakes no obligation to
update the information contained herein.
Adjusted
results:
Unless
otherwise indicated, “adjusted” figures exclude the adjustment items listed on
slide 39 of the 3Q15 presentation, to the extent applicable, on a Group and
business division level. Adjusted results are a non-GAAP financial measure as
defined by SEC regulations. Refer to page 17 of the 3Q15 financial report for
an overview of adjusted numbers. If applicable for a given adjusted KPI (i.e.,
adjusted return on tangible equity), adjustment items are calculated on an
after-tax basis by applying indicative tax rates (i.e., 2% for own credit, 22%
for other items, and with certain large items assessed on a case-by-case
basis). Refer to page 27 of the 3Q15 financial report for more information.
© UBS
2015. The key symbol and UBS are among the registered and unregistered
trademarks of UBS. All rights reserved.
This Form 6-K is hereby incorporated by reference into each of
(1) the registration statement of UBS AG on Form F-3
(Registration Number 333-204908) and (2) the registration statements of UBS
Group AG on Form S-8 (Registration Numbers 333-200634; 333-200635; 333-200641;
and 333-200665), and into each prospectus outstanding under any of the
foregoing registration statements; and also into (3) any outstanding
offering circular or similar document issued or authorized by UBS AG that
incorporates by reference any Form 6-K’s of UBS AG that are
incorporated into its registration statements filed with the SEC, and (4) the
base prospectus of Corporate Asset Backed Corporation (“CABCO”) dated
June 23, 2004 (Registration Number 333-111572), the Form 8-K of
CABCO filed and dated June 23, 2004 (SEC File Number 001-13444),
and the Prospectus Supplements relating to the CABCO Series 2004-101 Trust
dated May 10, 2004 and May 17, 2004 (Registration
Number 033-91744 and 033-91744-05).
SIGNATURES
Pursuant to the requirements of the Securities
Exchange Act of 1934, the registrant has duly caused this report to be signed
on its behalf by the undersigned, thereunto duly authorized.
UBS Group AG
By: _/s/ David Kelly______________
Name: David Kelly
Title: Managing Director
By: _/s/ Sarah M. Starkweather______
Name: Sarah M. Starkweather
Title: Executive Director
UBS AG
By: _/s/ David Kelly______________
Name: David Kelly
Title: Managing Director
By: _/s/ Sarah M. Starkweather______
Name: Sarah M. Starkweather
Title: Executive Director
Date: November 3,
2015
UBS (NYSE:UBS)
Historical Stock Chart
From Mar 2024 to Apr 2024

UBS (NYSE:UBS)
Historical Stock Chart
From Apr 2023 to Apr 2024
