Mercer’s latest analysis of compensation for CEOs in the S&P
500 reveals that total direct compensation declined from a median
of $10.6 million in 2014 to $10.3 million in 2015. This decrease –
the first in at least five years – is primarily attributable to
lower short-term incentives, which fell from $2.0 million in 2014
to $1.9 million in 2015, the smallest payout relative to target
since 2011. The lower pay also tracks a decrease in median revenue
among the companies, from $9.7 billion in 2014 to $9.4 billion in
2015.
“When revenue goes down, profit metrics are likely to be
affected,” said Ted Jarvis, Mercer’s Global Director of Executive
Rewards Data, Research and Publications. “Since virtually all
companies incorporate profit in some form in their short-term
incentives, it stands to reason that payouts associated with these
metrics would be reduced.”
According to Mercer’s analysis, long-term incentives barely
budged in 2015, up just 1% to $7.4 million. The growth came from
smaller companies in the S&P 500, namely those companies not in
the S&P 100 (Other 400). Companies in the S&P 100, the
largest companies in the S&P 500, reduced long-term incentives
by 4% to $11.1 million.
“The S&P 100 companies reined in many key areas of pay last
year. For this group, median base salaries were unchanged from 2014
levels, whereas salaries for the Other 400 went up just more than
1%,” said Mr. Jarvis. “Also, the short-term incentive payout for
CEOs of the S&P 100 fell significantly, from 131% of target
last year to 111% in 2015. These incentives for the Other 400
experienced a sharp decline in 2015, as well – to 108% of target
from 118% in 2014.” According to Mr. Jarvis, the disparity between
larger and smaller companies may be due to the Energy sector, which
has higher representation in the S&P 100 than the Other 400,
and the skid in oil prices, which delivered an economic blow to the
industry.
Use of stock options continues to decline
The past five years witnessed an inverse usage of long-term
incentive vehicles as the prevalence of stock options among S&P
500 companies shrank to 57% in 2015 from 72% in 2011. Over the same
period, performance share usage increased from 76% to 87% and
time-vesting shares remained steady at 59%. “These disparities
between the S&P 100 and the Other 400 in usage may be explained
by the recent ascent of performance shares among the Other 400
companies, whereas the S&P 100 companies have been a
consistently strong user of these vehicles between 2011 and 2015,”
said Mr. Jarvis.
Additionally, the S&P 100 has notably reduced its reliance
on both service-vesting shares and stock options. In 2011,
companies in the S&P 100 granted service-vesting restricted
stock at a rate of 59% and stock options at a rate of 73%. In the
most recently completed fiscal year, 46% of these companies granted
time-based stock and 50% granted stock options. “If these trends
continue, grants of stock options will become a minority practice
among this group in the future,” said Mr. Jarvis.
According to Jack Connell, a Partner with Mercer specializing in
executive compensation, “Stock options lead to the biggest burn
rate and overall dilution given their lengthy timeframe. As
third-party proxy advisors push companies to manage burn rate and
overhang, option use will decline relative to full-value shares.”
Time-vesting options, the most common type, can also cause an
irreversible hit to the income, which is not the case for some
performance-based awards. “The growth in full-value,
performance-based share awards and diminishment in option usage
reflects a rational bias towards the most efficient use of shares
from an accounting perspective and in response to the views of
proxy advisory firms,” said Mr. Connell.
Longtime industry pay ranks disrupted
Mercer’s analysis finds that CEOs in the Consumer Discretionary
sector received the highest compensation, with median total direct
compensation of $12.3 million; the Utilities sector had the lowest
pay with median total direct compensation of $9.2 million.
Healthcare – the highest-paying sector in 2014 – declined to $11.8
million in 2015 from $12.4 million in 2014. “The Consumer
Discretionary sector paid the highest base salaries for each of the
past five years, and its 2015 target bonus opportunity at 170% of
base was second only to the Financial Services sector,” said Mr.
Jarvis. “Actual payouts were relatively generous at 117% of target,
which raised the median value of short-term incentives to $2.8
million and median total cash to $4.0 million.”
Short- and long-term incentives were sharply delineated across
sectors. “Primarily in response to the nosedive in oil prices,
short-term bonuses in the Energy industry swooned from a five-year
high of $2.2 million in 2014 to $1.4 million in 2015,” said Mr.
Jarvis. “CEOs in the Healthcare and Financial Services industries,
which confronted regulatory pressure in 2015, saw bonuses rise –
especially within Healthcare, increasing to $2.2 million from $1.9
million in 2014.” Long-term incentives reached or approached
all-time highs in the Consumer Discretionary, Consumer Staples,
Energy and Utilities industries, but fell in the Financial
Services, Healthcare, Industrials, Information Technology and
Materials sectors.
“Proxy advisory firms and governance watchdogs are mainly
concerned about pay for performance and advocates for effective
target setting and responsible long-term incentive granting
practices,” said Mr. Connell. “These organizations exert pressure
on companies to create a rational alignment of pay to performance.
In 2015, revenues in the Energy sector fell 45%, showing linkage at
a high level. For the S&P 500, however, the portion of
companies that paid above-target bonuses is not necessarily
justified by revenue growth or profit.”
Is pay for performance working?
Mercer’s analysis shows inconsistent evidence of a linkage
between pay and performance. CEOs heading companies in the bottom
quartiles of one-year revenue growth or one-year total shareholder
return received the lowest bonuses, confirming a strong
correlation. However, these CEOs have the highest salaries on the
basis of three-year compound annual growth in revenue and total
shareholder return, and the highest long-term incentives on the
basis of three-year compound annual growth in revenue and one-year
total shareholder return. Additionally, at $12.4 million the median
total direct compensation far exceeds the $10.3 million earned by
the top-quartile contenders in three-year compound annual growth of
revenue.
“Compensation committees should pay compensation higher than the
median for higher than median performance and lower than the median
for lower than median performance,” said Mr. Connell. “It comes
down to the quality of the goal setting. If projected revenue and
income growth are not at median, it is tough to justify median
targeted pay. If the goals are unrealistic – either too high or too
low – the balance of the whole incentive is thrown off.”
Mercer’s analysis is based on compensation data from 93
companies in the S&P 100 and 362 other companies in the S&P
500 (Other 400). In 2015, median revenue for these companies was
$9,474 million.
About Mercer
Mercer is a global consulting leader in talent, health,
retirement and investments. Mercer helps clients around the world
advance the health, wealth and performance of their most vital
asset – their people. Mercer’s more than 20,000 employees are based
in 43 countries and the firm operates in over 140 countries. Mercer
is a wholly owned subsidiary of Marsh & McLennan Companies
(NYSE: MMC), a global professional services firm offering clients
advice and solutions in the areas of risk, strategy and people.
With 60,000 employees worldwide and annual revenue exceeding $13
billion, Marsh & McLennan Companies is also the parent company
of Marsh, a global leader in insurance broking and risk management;
Guy Carpenter, a leader in providing risk and reinsurance
intermediary services; and Oliver Wyman, a leader in management
consulting. For more information, visit www.mercer.com. Follow
Mercer on Twitter @Mercer.
View source
version on businesswire.com: http://www.businesswire.com/news/home/20160808005908/en/
MercerStacy Bronstein, +
1-215-982-8025Stacy.Bronstein@mercer.com
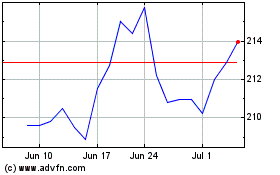
Marsh and McLennan Compa... (NYSE:MMC)
Historical Stock Chart
From Mar 2024 to Apr 2024

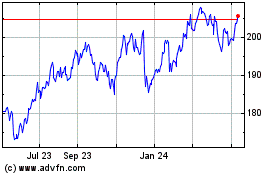
Marsh and McLennan Compa... (NYSE:MMC)
Historical Stock Chart
From Apr 2023 to Apr 2024
