Glaxosmithkline plc 4Q 2015 -- Forecast
February 01 2016 - 9:28AM
Dow Jones News
FRANKFURT--The following is a summary of analysts' forecasts for
Glaxosmithkline plc (GSK) fourth-quarter results, based on a poll
of eight analysts conducted by Dow Jones Newswires (figures in
million pound, EPS, dividend and target price in pence, according
to IFRS). Earnings figures are scheduled to be released February
3.
===
                              Core:            -Net
                 Turnover  -operat.         attrib.
4th Quarter         total    profit   -PBT   profit  -EPS
AVERAGE             6,345     1,483  1,319      903  18.5
Prev. Year          6,186     1,770  1,613    1,315  27.3
+/- in %             +2.6       -16    -18      -31   -32

MEDIAN              6,242     1,489  1,329      901  18.6
Maximum             6,802     1,545  1,384      988  20.3
Minimum             6,211     1,386  1,237      850  17.4
Amount(a)               7         8      6        7     7

Bernstein           6,230     1,545  1,384      919  19.0
Cowen and Company   6,284     1,477  1,321      913  18.9
Deutsche Bank       6,240     1,545  1,337      901  18.6
Exane BNP Paribas   6,242     1,386     --       --  17.4
Morgan Stanley      6,405     1,447  1,265      857  17.7
UBS                 6,211     1,416  1,237      850  17.6


             Target price  Rating                 DPS 2015
AVERAGE             1,468  positive 2     AVERAGE     90.0
Prev. Quarter       1,458  neutral  4     Prev. Year  80.0
+/- in %             +0.7  negative 0     +/- in %     +13

MEDIAN              1,400                 MEDIAN      90.0
Maximum             1,650                 Maximum    100.0
Minimum             1,350                 Minimum     80.0
Amount                  5                 Amount         6

Barclays            1,650  Overweight                 80.0
Bryan Garnier          --  Buy                        80.0
Deutsche Bank       1,540  Hold                      100.0
Exane BNP Paribas   1,400  Neutral                   100.0
Morgan Stanley      1,350  Equalweight               100.0
UBS                 1,400  Neutral                    80.0
===
Year-earlier figures are as reported by the company.
(a) Including anonymous estimates from two more analysts.
DJG/voi
(END) Dow Jones Newswires
February 01, 2016 09:13 ET (14:13 GMT)
Copyright (c) 2016 Dow Jones & Company, Inc.
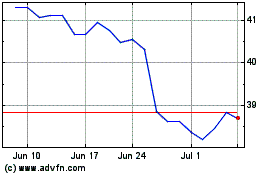
GSK (NYSE:GSK)
Historical Stock Chart
From Mar 2024 to Apr 2024

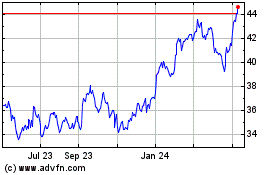
GSK (NYSE:GSK)
Historical Stock Chart
From Apr 2023 to Apr 2024
