Tullett Prebon PLC Half Yearly Report -5-
July 28 2015 - 2:02AM
UK Regulatory
 Taxation                                         (4.6)     (9.9)
 Net dividends received from associates/paid
  to minorities                                       -       0.1
 Acquisitions/investments                         (0.5)     (1.2)

 Cash flow                                         99.3       4.2
                                               ========  ========
The operating cash flow of GBP46.1m for the first half of 2015
is lower than the underlying operating profit reflecting the usual
seasonal working capital outflow.
The working capital outflow reflects the higher level of trade
receivables and settlement balances at June compared with the level
at the previous year end, due to the higher level of business
activity towards the end of the half year compared with that
towards the year end, and the reduction in bonus accruals which are
at their highest at the year end.
During the first half the group made GBP3.8m of cash payments
relating to actions taken under the 2014 cost improvement
programme, and GBP0.2m relating to the 2011/12 restructuring
programme.
The major legal actions net cash inflow of GBP64.4m is in line
with the credit in the income statement, and reflects the
settlement from BGC net of the costs incurred in 2015.
The movement in cash and debt is summarised below.
 GBPm                                    Cash      Debt      Net

 At 31 December 2014                    297.8   (219.7)     78.1
 Cash flow                               99.3         -     99.3
 Dividends                             (27.4)         -   (27.4)
 Debt and bank facility arrangement
  fees                                  (1.7)         -    (1.7)
 Amortisation of debt issue costs           -     (0.3)    (0.3)
 Cash sold with subsidiaries            (0.3)         -    (0.3)
 Effect of movement in exchange
  rates                                 (3.1)         -    (3.1)

 At 30 June 2015                        364.6   (220.0)    144.6
                                      =======  ========  =======
At 30 June 2015 the group's outstanding debt comprised GBP141.1m
Sterling Notes due July 2016 and GBP80m Sterling Notes due June
2019. The group renewed its committed GBP150m revolving credit
facility during the first half, and the new facility matures in
April 2018. No drawings were made on either the old or new facility
during the period.
Outlook
Our recent strategic review concluded that the central role
played by interdealer brokers at the heart of the global wholesale
OTC markets remains secure. However, in a number of traditional
interdealer broker products, revenue declines are likely to
continue. In contrast, Energy and commodities do not currently face
the same pressures and we expect to benefit from the recent
investments we have made in developing our presence in this sector.
We will continue to invest in the business's capabilities to
identify and implement business initiatives and we will look to
further invest in revenue growth opportunities.
We will also continue to roll out our cultural, legal,
compliance and risk governance frameworks to deliver our commitment
to instil and embed the highest standards of conduct. These
investments, increasing regulatory related costs, and the impact of
the areas of business weakness, are expected to offset the
improvement in the operating margin compared with that delivered
last year. The investments are important for the Company to retain
its competitive advantage and to deliver our strategy to increase
revenue and earnings for the medium and longer term.
Condensed Consolidated Income Statement
for the six months ended 30 June 2015
 Six months ended                             Underlying    Exceptional         Total
  30 June 2015 (unaudited)                                          and
                                                            acquisition
                                                                related
                                                                  items
                                     Notes          GBPm           GBPm          GBPm
----------------------------------  ------  ------------  -------------  ------------
 Revenue                                 5         415.7              -         415.7
----------------------------------  ------  ------------  -------------  ------------
 Administrative expenses                         (358.2)          (8.9)       (367.1)
----------------------------------  ------  ------------  -------------  ------------
 Other operating income                  7           3.1           67.1          70.2
----------------------------------  ------  ------------  -------------  ------------
 Operating profit                      5,6          60.6           58.2         118.8
----------------------------------  ------  ------------  -------------  ------------
 Finance income                          8           1.9              -           1.9
----------------------------------  ------  ------------  -------------  ------------
 Finance costs                           9         (9.6)              -         (9.6)
----------------------------------  ------  ------------  -------------  ------------
 Profit before tax                                  52.9           58.2         111.1
----------------------------------  ------  ------------  -------------  ------------
 Taxation                                         (10.8)         (12.9)        (23.7)
----------------------------------  ------  ------------  -------------  ------------
 Profit of consolidated companies                   42.1           45.3          87.4
----------------------------------  ------  ------------  -------------  ------------
 Share of results of associates                      1.2              -           1.2
----------------------------------  ------  ------------  -------------  ------------
 Profit for the period                              43.3           45.3          88.6
==================================  ======  ============  =============  ============

 Attributable to:
----------------------------------  ------  ------------  -------------  ------------
 Equity holders of the parent                       43.0           45.3          88.3
----------------------------------  ------  ------------  -------------  ------------
 Minority interests                                  0.3              -           0.3
----------------------------------  ------  ------------  -------------  ------------
                                                    43.3           45.3          88.6
==================================  ======  ============  =============  ============
 Earnings per share
----------------------------------  ------  ------------  -------------  ------------
 - Basic                                10         17.7p                        36.2p
----------------------------------  ------  ------------  -------------  ------------
 - Diluted                              10         17.4p                        35.8p
----------------------------------  ------  ------------  -------------  ------------

 Six months ended                             Underlying    Exceptional         Total
  30 June 2014 (unaudited)                                          and
                                                            acquisition
                                                                related
                                                                  items
                                     Notes          GBPm           GBPm          GBPm
----------------------------------  ------  ------------  -------------  ------------
 Revenue                                 5         360.3              -         360.3
----------------------------------  ------  ------------  -------------  ------------
 Administrative expenses                         (312.3)         (34.3)       (346.6)
----------------------------------  ------  ------------  -------------  ------------
 Other operating income                  7           2.3              -           2.3
----------------------------------  ------  ------------  -------------  ------------
 Operating profit                      5,6          50.3         (34.3)          16.0
----------------------------------  ------  ------------  -------------  ------------
 Finance income                          8           1.8              -           1.8
----------------------------------  ------  ------------  -------------  ------------
 Finance costs                           9         (8.9)              -         (8.9)
----------------------------------  ------  ------------  -------------  ------------
 Profit before tax                                  43.2         (34.3)           8.9
----------------------------------  ------  ------------  -------------  ------------
 Taxation                                          (9.3)            2.2         (7.1)
----------------------------------  ------  ------------  -------------  ------------
 Profit of consolidated companies                   33.9         (32.1)           1.8
----------------------------------  ------  ------------  -------------  ------------
 Share of results of associates                      1.2              -           1.2
----------------------------------  ------  ------------  -------------  ------------
 Profit for the period                              35.1         (32.1)           3.0
==================================  ======  ============  =============  ============

 Attributable to:
----------------------------------  ------  ------------  -------------  ------------
 Equity holders of the parent                       34.9         (32.1)           2.8
----------------------------------  ------  ------------  -------------  ------------
 Minority interests                                  0.2              -           0.2
----------------------------------  ------  ------------  -------------  ------------
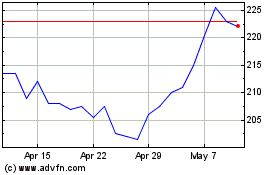
Tp Icap (LSE:TCAP)
Historical Stock Chart
From Mar 2024 to Apr 2024

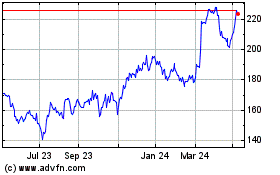
Tp Icap (LSE:TCAP)
Historical Stock Chart
From Apr 2023 to Apr 2024
