TIDMAZN
RNS Number : 7428G
AstraZeneca PLC
06 March 2015
AstraZeneca REFINES ITS FINANCIAL REPORTING
in line with evolving business model
6 March 2015
AstraZeneca today announces an update to the presentation of its
Statement of Comprehensive Income, which will see revenue from
externalisation becoming more visible to enhance transparency for
investors. The change is effective from 1 January 2015 and will be
reported as part of the Company's first quarter financial results
on 24 April 2015. The impact is presentational and therefore does
not impact Reported or Core profit.
As previously outlined, AstraZeneca's business model includes an
increasing level of externalisation activity to create value from
the strong science that exists in the pipeline. This will benefit
patients whilst sharpening further the focus on our main therapy
areas - Respiratory, Inflammation & Autoimmunity;
Cardiovascular & Metabolic Disease and Oncology. The Company's
two biotech centres, the Innovative Medicines Unit and MedImmune,
continue to increase R&D productivity. Consequently AstraZeneca
will consider opportunities to out-licence technologies and
potential new medicines to ensure these reach patients as quickly
as possible.
The updated financial reporting structure reflects the Company's
entrepreneurial approach and provides a clear picture of a growing
additional revenue stream.
Historically, reported revenue reflected only product sales
(formerly known as sales revenue), with externalisation revenue
forming part of other operating income presented below cost of
goods sold (COGS). From 1 January 2015 externalisation revenue,
alongside product sales, contribute to total revenue, which is
shown above COGS. Externalisation revenue includes development,
commercialisation, partnership and out-licence revenue, such as
royalties and milestone receipts, together with income from
services or repeatable licences.
Income will be recorded as externalisation revenue when the
Company has an ongoing interest in the product and/or it is
repeatable business and there is no derecognition of an intangible
asset. Disposals of assets and businesses, where AstraZeneca does
not retain an interest, will continue to be recorded in other
operating income.
The Company has updated its revenue accounting policy with
effect from 1 January 2015 and the prior-year financial results
will be restated accordingly. An illustration of the change to the
presentation of prior-period Core financial performance is shown in
the appendix. These numbers are unaudited and are indicative of the
impact of the change in policy.
2015 Financial Guidance
To reflect the change outlined above, the Company today provides
2015 total revenue guidance. Total revenue is expected to decline
by mid single-digit percent at constant exchange rates (CER). This
is consistent with previous guidance stating that sales revenue was
expected to decline by mid single-digit percent at CER. Core EPS
guidance is unchanged and Core EPS is expected to increase by low
single-digit percent at CER.
The Company also provides the following non-guidance information
related to currency sensitivity: Based on current exchange rates(1)
, total revenue is expected to decline by low double-digit percent.
This is consistent with previous expectations stating an
anticipated sales revenue decline of low double-digit percent. Core
EPS is expected to be broadly in line with 2014. For additional
currency sensitivity information, please see below:
                                           Average exchange                            Impact of 5% weakening
                                              rates versus                             in exchange rate versus
                                                  USD                                        USD ($m)(2)
---------                               -----------------------                     ----------------------------
                                                             YTD                                            Core
                   Primary                                   Feb       Change          Total           operating
 Currency        relevance                 2014          2015(1)            %        revenue              profit
---------       ----------          -----------       ----------       ------       --------        ------------
                            Product
           EUR                sales         0.75             0.87         (13)          (194)               (119)
                            Product
           JPY                sales       105.87           118.55         (11)          (105)                (75)
                            Product
           CNY                sales         6.16             6.23          (1)          (113)                (48)
           SEK                Costs         6.86             8.22         (16)            (5)                  95
           GBP                Costs         0.61             0.66          (7)           (34)                 104
                          Other(3)                                                     (213)               (123)
----------------------------------  -----------       ----------       ------       --------        ------------
(1) Based on average daily spot rates YTD to the end of February
2015.
(2) Based on 2014 actual group currency exposures.
(3) Other important currencies include AUD, BRL, CAD, KRW and
RUB.
ENDS -
Appendix
Impact of Revenue Accounting Changes
All numbers shown below are at actual exchange rates in $m
unless otherwise stated.
                            Core Q1 2013           Core Q2 2013           Core Q3 2013           Core Q4 2013           Core FY 2013
                    Restated          As   Restated          As   Restated          As   Restated          As   Restated          As
                                Formerly               Formerly               Formerly               Formerly               Formerly
                               Presented              Presented              Presented              Presented              Presented
  Product Sales        6,385       6,385      6,232       6,232      6,250       6,250      6,844       6,844     25,711      25,711
 Externalisation
      Revenue             12           -         47           -         12           -         12           -         83           -
  Total Revenue        6,397       6,385      6,279       6,232      6,262       6,250      6,856       6,844     25,794      25,711
                   ---------  ----------  ---------  ----------  ---------  ----------  ---------  ----------  ---------  ----------

  Cost of Sales      (1,136)     (1,136)    (1,105)     (1,105)    (1,103)     (1,103)    (1,289)     (1,289)    (4,633)     (4,633)

   Gross Profit        5,261       5,249      5,174       5,127      5,159       5,147      5,567       5,555     21,161      21,078

   Distribution         (77)        (77)       (76)        (76)       (81)        (81)       (72)        (72)      (306)       (306)
       R&D             (963)       (963)    (1,040)     (1,040)    (1,061)     (1,061)    (1,205)     (1,205)    (4,269)     (4,269)
       SG&A          (2,055)     (2,055)    (2,173)     (2,173)    (2,154)     (2,154)    (2,483)     (2,483)    (8,865)     (8,865)
   Other Income          158         170        171         218        164         176        176         188        669         752

 Operating Profit      2,324       2,324      2,056       2,056      2,027       2,027      1,983       1,983      8,390       8,390
-----------------  ---------  ----------  ---------  ----------  ---------  ----------  ---------  ----------  ---------  ----------
All numbers shown below are at actual exchange rates in $m
unless otherwise stated.
                            Core Q1 2014           Core Q2 2014           Core Q3 2014           Core Q4 2014           Core FY 2014
                    Restated          As   Restated          As   Restated          As   Restated          As   Restated          As
                                Formerly               Formerly               Formerly               Formerly               Formerly
                               Presented              Presented              Presented              Presented              Presented
  Product Sales        6,416       6,416      6,454       6,454      6,542       6,542      6,683       6,683     26,095      26,095
 Externalisation
      Revenue             49           -        302           -         69           -         41           -        461           -
  Total Revenue        6,465       6,416      6,756       6,454      6,611       6,542      6,724       6,683     26,556      26,095
                   ---------  ----------  ---------  ----------  ---------  ----------  ---------  ----------  ---------  ----------

  Cost of Sales      (1,193)     (1,193)    (1,156)     (1,156)    (1,180)     (1,180)    (1,359)     (1,359)    (4,888)     (4,888)

   Gross Profit        5,272       5,223      5,600       5,298      5,431       5,362      5,365       5,324     21,668      21,207

   Distribution         (72)        (72)       (77)        (77)       (87)        (87)       (88)        (88)      (324)       (324)
       R&D           (1,098)     (1,098)    (1,208)     (1,208)    (1,275)     (1,275)    (1,360)     (1,360)    (4,941)     (4,941)
       SG&A          (2,317)     (2,317)    (2,460)     (2,460)    (2,486)     (2,486)    (2,953)     (2,953)   (10,216)    (10,216)
   Other Income          167         216        176         478        187         256        220         261        750       1,211

 Operating Profit      1,952       1,952      2,031       2,031      1,770       1,770      1,184       1,184      6,937       6,937
-----------------  ---------  ----------  ---------  ----------  ---------  ----------  ---------  ----------  ---------  ----------
NOTES TO EDITORS
About AstraZeneca
AstraZeneca is a global, innovation-driven biopharmaceutical
business that focuses on the discovery, development and
commercialisation of prescription medicines, primarily for the
treatment of cardiovascular, metabolic, respiratory, inflammation,
autoimmune, oncology, infection and neuroscience diseases.
AstraZeneca operates in over 100 countries and its innovative
medicines are used by millions of patients worldwide.
CONTACTS
 Media Enquiries
 Esra Erkal-Paler      +44 20 7604 8030       (UK/Global)
 Vanessa Rhodes        +44 20 7604 8037       (UK/Global)
 Ayesha Bharmal        +44 20 7604 8034       (UK/Global)
 Jacob Lund            +46 8 553 260 20         (Sweden)
  Investor Enquiries
 Thomas Kudsk Larsen   +44 20 7604 8199   mob: +44 7818 524185
 Karl Hård        +44 20 7604 8123   mob: +44 7789 654364
 Eugenia Litz          +44 20 7604 8233   mob: +44 7884 735627
 Craig Marks           +44 20 7604 8591   mob: +44 7881 615764
 Christer Gruvris      +44 20 7604 8126   mob: +44 7827 836825
This information is provided by RNS
The company news service from the London Stock Exchange
END
MSCUGUGCWUPAUQQ
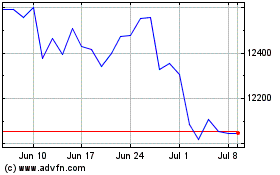
Astrazeneca (LSE:AZN)
Historical Stock Chart
From Mar 2024 to Apr 2024

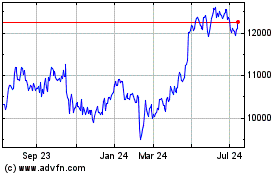
Astrazeneca (LSE:AZN)
Historical Stock Chart
From Apr 2023 to Apr 2024
