AXA SA 9 Million 2015 -- Forecast
October 26 2015 - 9:23AM
Dow Jones News
FRANKFURT--The following is a summary of analysts' forecasts for
AXA SA (CS.FR) 9 months results, based on a poll of four analysts
conducted by Dow Jones Newswires (figures in million euros, target
price in euro, according to IFRS). Earnings figures are scheduled
to be released October 27.
===
                 Total     APE   Revenues
9 months      Revenues     (a)     P&C(c)
AVERAGE         76,131   5,359     24,897
Prev. Year      69,634   4,671     23,151
+/- in %          +9.3     +15       +7.5

MEDIAN          76,128   5,356     24,826
Maximum         76,398   5,372     25,064
Minimum         75,871   5,350     24,800
Amount (a)           4       3          3

Bankhaus Lampe  75,920   5,350     24,800
Barclays        76,398   5,356     25,064
UBS             76,335   5,372     24,826

             Target price  Rating
AVERAGE             26.17  positive 3
Prev. Quarter       23.60  neutral  1
+/- in %              +11  negative 0

MEDIAN              26.30
Maximum             29.00
Minimum             23.20
Amount               3

Barclays            26.30  Overweight
Bryan Garnier       29.00  Buy
Morgan Stanley         --  Overweight
UBS                 23.20  Neutral
===
Year-earlier figures are as reported by the company.
(a) Including anonymous estimates from one more analyst.
(a) Annual Premium Equivalent.
(c) Property & Casualty.
DJG/voi
Subscribe to WSJ: http://online.wsj.com?mod=djnwires
(END) Dow Jones Newswires
October 26, 2015 09:08 ET (13:08 GMT)
Copyright (c) 2015 Dow Jones & Company, Inc.
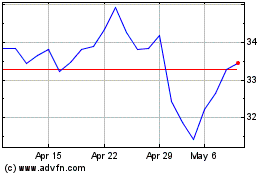
Axa (EU:CS)
Historical Stock Chart
From Aug 2024 to Sep 2024

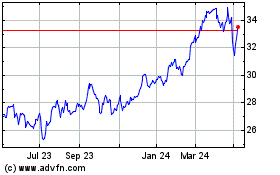
Axa (EU:CS)
Historical Stock Chart
From Sep 2023 to Sep 2024
