UNITED STATES
SECURITIES AND EXCHANGE COMMISSION
Washington, D.C. 20549
FORM 8-K
CURRENT REPORT
Pursuant to Section 13 or 15(d) of The Securities Act of 1934
Date of Report (Date of earliest event reported): November
24, 2015
THE VALSPAR CORPORATION
(Exact name of registrant as specified in its charter)
| Delaware |
1-3011 |
36-2443580 |
(State or other jurisdiction
of incorporation) |
(Commission
File Number) |
(I.R.S. Employer
Identification No.) |
| |
|
|
| 1101 South 3rd Street, Minneapolis, Minnesota |
55415 |
| (Address of principal executive offices) |
(Zip Code) |
Registrant’s telephone number, including area
code: (612) 851-7000
Not Applicable
(Former name or former address, if changed since last
report)
Check the appropriate box below if the Form 8-K filing is intended to simultaneously
satisfy the filing obligation of the registrant under any of the following provisions (see General Instruction A.2. below):
| ☐ |
Written communications pursuant to Rule 425 under the Securities Act (17 CFR 230.425) |
| |
|
| ☐ |
Soliciting material pursuant to Rule 14a-12 under the Exchange Act (17 CFR 240.14a-12) |
| |
|
| ☐ |
Pre-commencement communications pursuant to Rule 14d-2(b) under the Exchange Act (17 CFR 240.14d-2(b)) |
| |
|
| ☐ |
Pre-commencement communications pursuant to Rule 13e-4(c) under the Exchange Act (17 CFR 240.13e-4(c)) |
| Item 7.01. |
Regulation FD Disclosure. |
| |
|
| |
Supplemental slide presentation to accompany Valspar’s fiscal 2015 fourth quarter and year-end earnings conference call. |
| |
|
| |
|
| Item 9.01 |
Financial Statements and Exhibits. |
| |
|
| (d) |
Exhibits |
| |
|
| |
99.1 |
Supplemental slide presentation to accompany Valspar’s fiscal 2015 fourth quarter and year-end earnings conference call. |
SIGNATURE
Pursuant to the requirements of the Securities Exchange
Act of 1934, the registrant has duly caused this report to be signed on its behalf by the undersigned thereunto duly authorized.
| |
THE VALSPAR CORPORATION |
| |
|
| |
|
| Dated: November 24, 2015 |
/s/ Rolf Engh |
| |
Name: |
Rolf Engh |
| |
Title: |
Secretary |
EXHIBIT INDEX
| Exhibit No. |
|
Description |
| |
|
|
| 99.1 |
|
Supplemental slide presentation to accompany Valspar’s fiscal 2015 fourth quarter and year-end earnings conference call. |
Exhibit
99.1
Information current as of November 24, 2015 Fourth Quarter F2015 Financial Results
Safe Harbor This discussion contains certain statements which constitute “forward - looking statements” within the meaning of Section 27 A of the Securities Act of 1933 , as amended, and Section 21 E of the Securities Exchange Act of 1934 , as amended and Section 21 E of the Securities Exchange Act of 1934 , as amended . The Private Securities Litigation Reform Act of 1995 provides a safe harbor for forward - looking statements . Forward - looking statements are based on management’s current expectations, estimates, assumptions and beliefs about future events, conditions and financial performance . Forward - looking statements are subject to risks, uncertainties and other factors, many of which are outside our control and could cause actual results to differ materially from such statements . Any statement that is not historical in nature is a forward - looking statement . We may identify forward - looking statements with words and phrases such as “expects,” “projects,” “estimates,” “anticipates,” “believes,” “could,” “may,” “will,” “plans to,” “intends,” “should” and similar expressions . These risks, uncertainties and other factors include, but are not limited to, deterioration in general economic conditions, both domestic and international, that may adversely affect our business ; fluctuations in availability and prices of raw materials, including raw material shortages and other supply chain disruptions, and the inability to pass along or delays in passing along raw material cost increases to our customers ; dependence of internal sales and earnings growth on business cycles affecting our customers and growth in the domestic and international coatings industry ; market share loss to, and pricing or margin pressure from, larger competitors with greater financial resources ; significant indebtedness that restricts the use of cash flow from operations for acquisitions and other investments ; dependence on acquisitions for growth, and risks related to future acquisitions, including adverse changes in the results of acquired businesses, the assumption of unforeseen liabilities and disruptions resulting from the integration of acquisitions ; risks and uncertainties associated with operating in foreign markets, including achievement of profitable growth in developing markets ; impact of fluctuations in foreign currency exchange rates on our financial results ; loss of business with key customers ; damage to our reputation and business resulting from product claims or recalls, litigation, customer perception and other matters ; our ability to respond to technology changes and to protect our technology ; possible interruption, failure or compromise of the information systems we use to operate our business ; changes in governmental regulation, including more stringent environmental, health and safety regulations ; our reliance on the efforts of vendors, government agencies, utilities and other third parties to achieve adequate compliance and avoid disruption of our business ; unusual weather conditions adversely affecting sales ; changes in accounting policies and standards and taxation requirements such as new tax laws or revised tax law interpretations ; the nature, cost and outcome of pending and future litigation and other legal proceedings ; and civil unrest and the outbreak of war and other significant national and international events . We undertake no obligation to subsequently revise any forward - looking statement to reflect new information, events or circumstances after the date of such statement, except as required by law . Investor Contact: Bill Seymour, VP Finance and Investor Relations william.seymour@valspar.com 612 - 656 - 1328 Additional Information: More about Valspar and copies of recent SEC filings can be found at: www.valspar.com 2 November 24, 2015
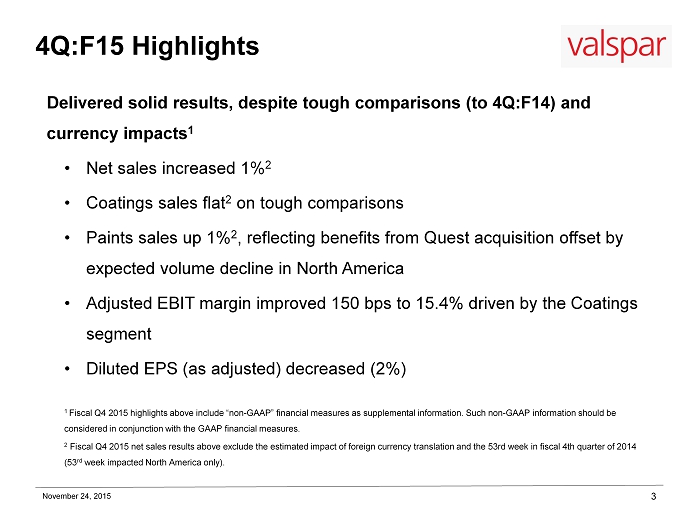
4 Q:F15 Highlights Delivered solid results, despite tough comparisons (to 4Q:F14) and currency impacts 1 • Net sales increased 1% 2 • Coatings sales flat 2 on tough comparisons • Paints sales up 1% 2 , reflecting benefits from Quest acquisition offset by expected volume decline in North America • Adjusted EBIT margin improved 150 bps to 15.4% driven by the Coatings segment • Diluted EPS (as adjusted) decreased (2%) 1 Fiscal Q4 2015 highlights above include “non - GAAP” financial measures as supplemental information. Such non - GAAP information should be considered in conjunction with the GAAP financial measures. 2 Fiscal Q4 2015 net sales results above exclude the estimated impact of foreign currency translation and the 53rd week in fiscal 4th quarter of 2014 (53 rd week impacted North America only). 3 November 24, 2015
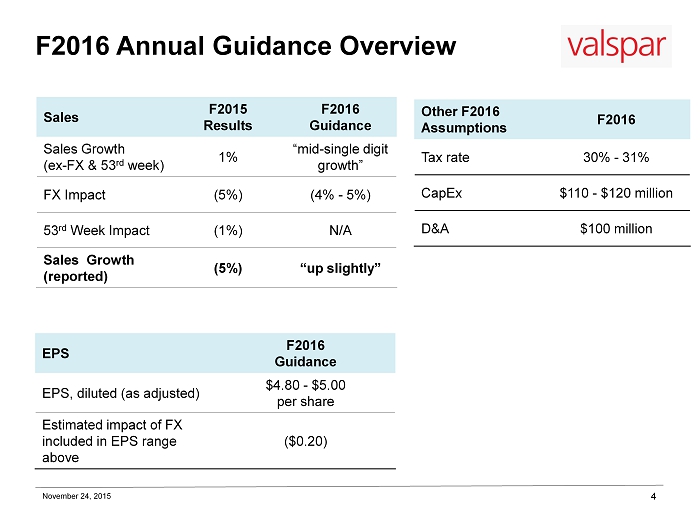
F2016 Annual Guidance Overview 4 November 24, 2015 Sales F2015 Results F2016 Guidance Sales Growth (ex - FX & 53 rd week) 1% “mid - single digit growth” FX Impact (5%) (4% - 5%) 53 rd Week Impact (1%) N/A Sales Growth (reported) (5%) “up slightly ” Other F2016 Assumptions F2016 Tax rate 30% - 31% CapEx $110 - $120 million D&A $100 million EPS F2016 Guidance EPS, diluted (as adjusted) $4.80 - $5.00 per share Estimated impact of FX included in EPS range above ($0.20)
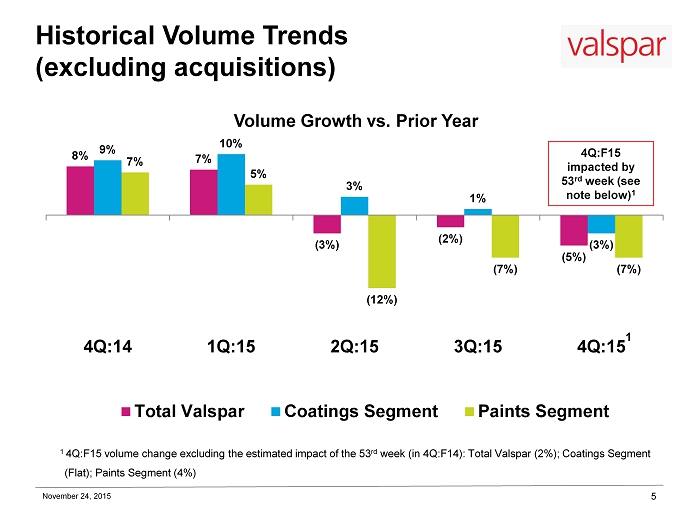
8% 7% (3%) (2%) (5%) 9% 10% 3% 1% (3%) 7% 5% (12%) (7%) (7%) 4Q:14 1Q:15 2Q:15 3Q:15 4Q:15 Volume Growth vs. Prior Year Total Valspar Coatings Segment Paints Segment 4Q:F15 impacted by 53 rd week (see note below) 1 Historical Volume Trends (excluding acquisitions) 5 November 24, 2015 1 4Q:F15 volume change excluding the estimated impact of the 53 rd week (in 4Q:F14): Total Valspar (2%); Coatings Segment (Flat); Paints Segment (4%) 1
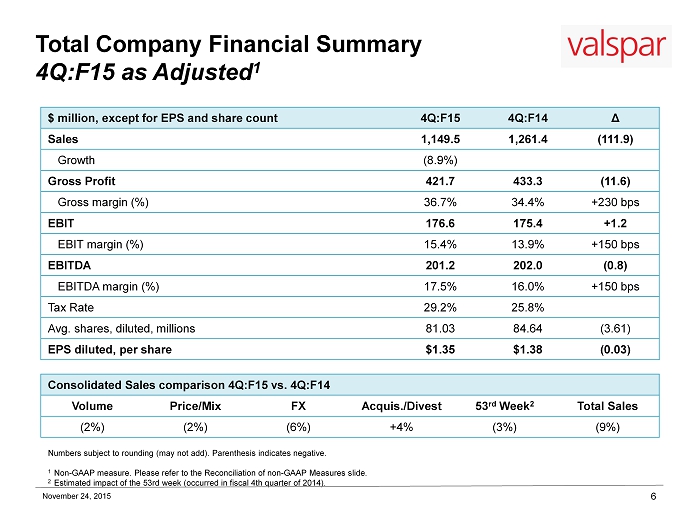
Total Company Financial Summary 4 Q:F15 as Adjusted 1 6 $ million, except for EPS and share count 4Q:F15 4Q:F14 Δ Sales 1,149.5 1,261.4 (111.9) Growth (8.9%) Gross Profit 421.7 433.3 (11.6) Gross margin (%) 36.7% 34.4% +230 bps EBIT 176.6 175.4 +1.2 EBIT margin (%) 15.4% 13.9% +150 bps EBITDA 201.2 202.0 (0.8) EBITDA margin (%) 17.5% 16.0% +150 bps Tax Rate 29.2% 25.8% Avg. shares, diluted, millions 81.03 84.64 (3.61) EPS diluted, per share $1.35 $1.38 (0.03) Numbers subject to rounding (may not add ). Parenthesis indicates negative. 1 Non - GAAP measure. Please refer to the Reconciliation of non - GAAP Measures slide. 2 Estimated impact of the 53rd week (occurred in fiscal 4th quarter of 2014). Consolidated Sales comparison 4Q:F15 vs. 4Q:F14 Volume Price/Mix FX Acquis./Divest 53 rd Week 2 Total Sales (2%) (2%) (6%) +4% (3%) (9%) November 24, 2015
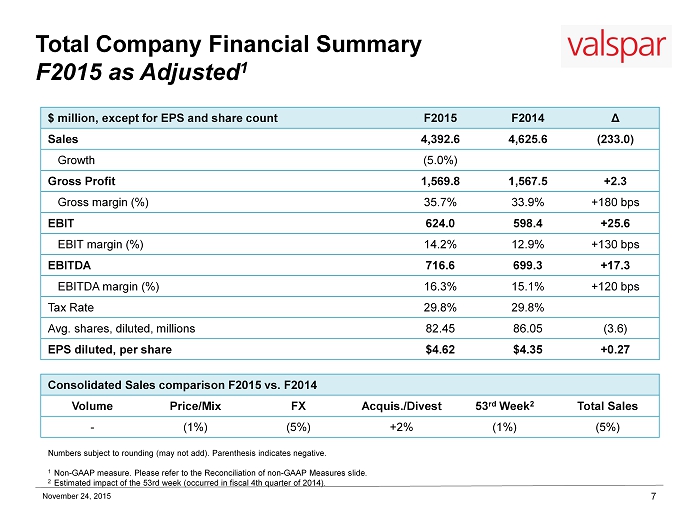
Total Company Financial Summary F2015 as Adjusted 1 7 $ million, except for EPS and share count F2015 F2014 Δ Sales 4,392.6 4,625.6 (233.0) Growth (5.0%) Gross Profit 1,569.8 1,567.5 +2.3 Gross margin (%) 35.7% 33.9% +180 bps EBIT 624.0 598.4 +25.6 EBIT margin (%) 14.2% 12.9% +130 bps EBITDA 716.6 699.3 +17.3 EBITDA margin (%) 16.3% 15.1% +120 bps Tax Rate 29.8% 29.8% Avg. shares, diluted, millions 82.45 86.05 (3.6) EPS diluted, per share $4.62 $4.35 +0.27 Consolidated Sales comparison F2015 vs. F2014 Volume Price/Mix FX Acquis./Divest 53 rd Week 2 Total Sales - (1%) (5%) +2% (1%) (5%) November 24, 2015 Numbers subject to rounding (may not add ). Parenthesis indicates negative. 1 Non - GAAP measure. Please refer to the Reconciliation of non - GAAP Measures slide. 2 Estimated impact of the 53rd week (occurred in fiscal 4th quarter of 2014).
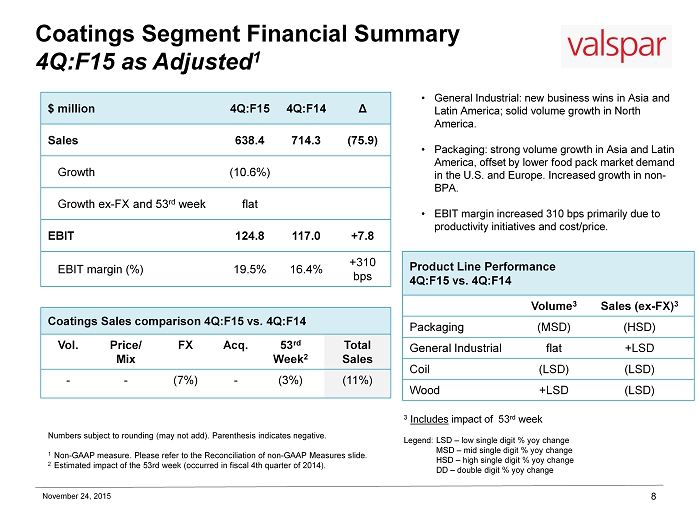
Coatings Segment Financial Summary 4 Q:F15 as Adjusted 1 8 $ million 4Q:F15 4Q:F14 Δ Sales 638.4 714.3 (75.9) Growth (10.6%) Growth ex - FX and 53 rd week flat EBIT 124.8 117.0 +7.8 EBIT margin (%) 19.5% 16.4% +310 bps • General Industrial: new business wins in Asia and Latin America; solid volume growth in North America. • Packaging: strong volume growth in Asia and Latin America, offset by lower food pack market demand in the U.S. and Europe. Increased growth in non - BPA. • EBIT margin increased 310 bps primarily due to productivity initiatives and cost/price. 3 Includes impact of 53 rd week Legend: LSD – low single digit % yoy change MSD – mid single digit % yoy change HSD – high single digit % yoy change DD – double digit % yoy change Coatings Sales comparison 4Q:F15 vs. 4Q:F14 Vol. Price/ Mix FX Acq . 53 rd Week 2 Total Sales - - (7%) - (3%) (11%) Product Line Performance 4Q:F15 vs. 4Q:F14 Volume 3 Sales (ex - FX) 3 Packaging (MSD) (HSD) General Industrial flat +LSD Coil (LSD) (LSD) Wood +LSD (LSD) November 24, 2015 Numbers subject to rounding (may not add ). Parenthesis indicates negative. 1 Non - GAAP measure. Please refer to the Reconciliation of non - GAAP Measures slide. 2 Estimated impact of the 53rd week (occurred in fiscal 4th quarter of 2014).
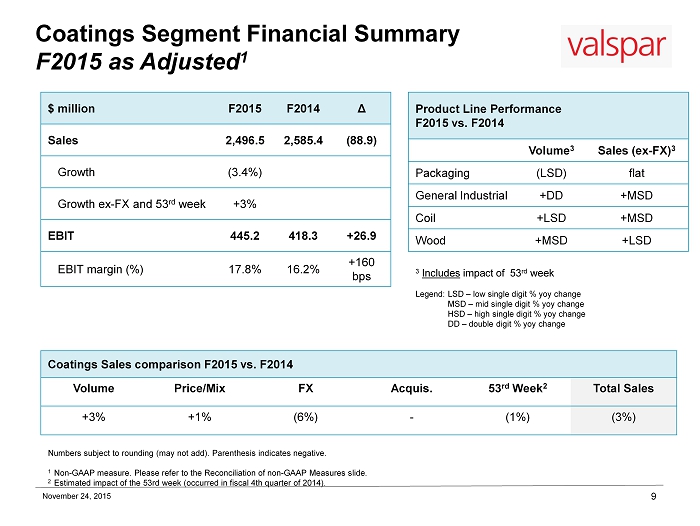
Coatings Segment Financial Summary F2015 as Adjusted 1 9 $ million F2015 F2014 Δ Sales 2,496.5 2,585.4 (88.9) Growth (3.4%) Growth ex - FX and 53 rd week +3% EBIT 445.2 418.3 +26.9 EBIT margin (%) 17.8% 16.2% +160 bps Coatings Sales comparison F2015 vs. F2014 Volume Price/Mix FX Acquis. 53 rd Week 2 Total Sales +3% +1% (6%) - (1%) (3%) Product Line Performance F2015 vs. F2014 Volume 3 Sales (ex - FX) 3 Packaging (LSD) flat General Industrial +DD +MSD Coil +LSD +MSD Wood +MSD +LSD November 24, 2015 3 Includes impact of 53 rd week Legend: LSD – low single digit % yoy change MSD – mid single digit % yoy change HSD – high single digit % yoy change DD – double digit % yoy change Numbers subject to rounding (may not add ). Parenthesis indicates negative. 1 Non - GAAP measure. Please refer to the Reconciliation of non - GAAP Measures slide. 2 Estimated impact of the 53rd week (occurred in fiscal 4th quarter of 2014).
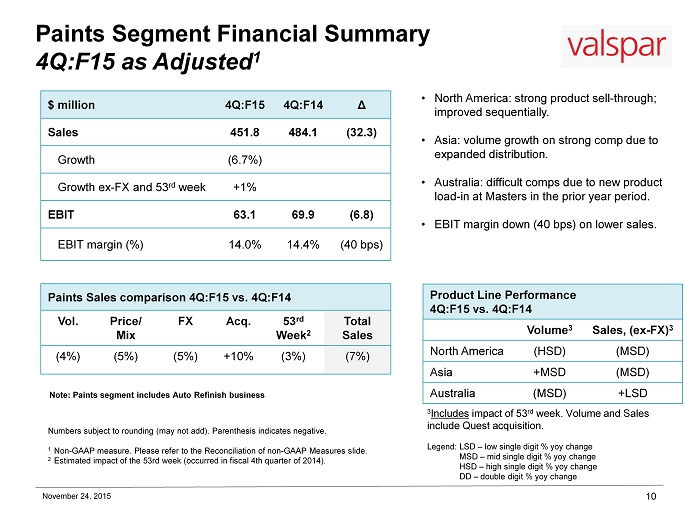
Paints Segment Financial Summary 4 Q:F15 as Adjusted 1 10 $ million 4Q:F15 4Q:F14 Δ Sales 451.8 484.1 (32.3) Growth (6.7%) Growth ex - FX and 53 rd week +1% EBIT 63.1 69.9 (6.8) EBIT margin (%) 14.0% 14.4% (40 bps) • North America: strong product sell - through; improved sequentially. • Asia: volume growth on strong comp due to expanded distribution. • Australia: difficult comps due to new product load - in at Masters in the prior year period. • EBIT margin down (40 bps) on lower sales. Product Line Performance 4Q:F15 vs. 4Q:F14 Volume 3 Sales, (ex - FX) 3 North America (HSD) (MSD) Asia +MSD (MSD) Australia (MSD) +LSD Note: Paints segment includes Auto Refinish business 3 Includes impact of 53 rd week. Volume and Sales include Quest acquisition. Legend : LSD – low single digit % yoy change MSD – mid single digit % yoy change HSD – high single digit % yoy change DD – double digit % yoy change November 24, 2015 Paints Sales comparison 4Q:F15 vs. 4Q:F14 Vol. Price/ Mix FX Acq . 53 rd Week 2 Total Sales (4%) (5%) (5%) +10% (3%) (7%) Numbers subject to rounding (may not add ). Parenthesis indicates negative. 1 Non - GAAP measure. Please refer to the Reconciliation of non - GAAP Measures slide. 2 Estimated impact of the 53rd week (occurred in fiscal 4th quarter of 2014).
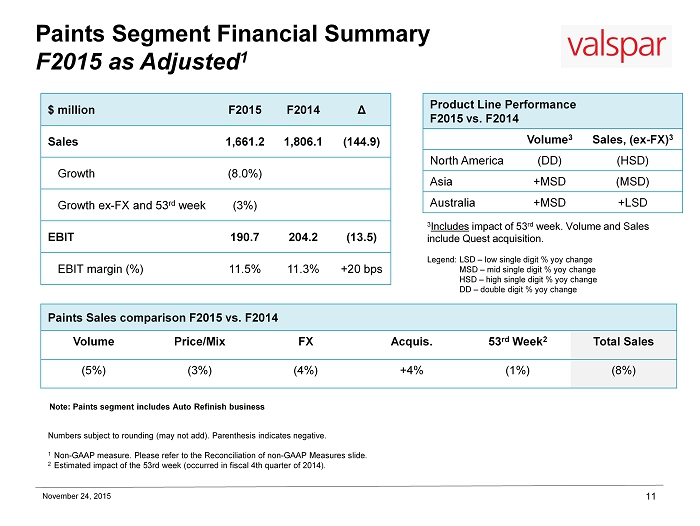
Paints Segment Financial Summary F2015 as Adjusted 1 11 $ million F2015 F2014 Δ Sales 1,661.2 1,806.1 (144.9) Growth (8.0%) Growth ex - FX and 53 rd week (3%) EBIT 190.7 204.2 (13.5) EBIT margin (%) 11.5% 11.3% +20 bps Product Line Performance F2015 vs. F2014 Volume 3 Sales, (ex - FX) 3 North America (DD) (HSD) Asia +MSD (MSD) Australia +MSD +LSD Note: Paints segment includes Auto Refinish business November 24, 2015 Paints Sales comparison F2015 vs. F2014 Volume Price/Mix FX Acquis. 53 rd Week 2 Total Sales (5%) (3%) (4%) +4% (1%) (8%) 3 Includes impact of 53 rd week. Volume and Sales include Quest acquisition. Legend : LSD – low single digit % yoy change MSD – mid single digit % yoy change HSD – high single digit % yoy change DD – double digit % yoy change Numbers subject to rounding (may not add ). Parenthesis indicates negative. 1 Non - GAAP measure. Please refer to the Reconciliation of non - GAAP Measures slide. 2 Estimated impact of the 53rd week (occurred in fiscal 4th quarter of 2014).
Non - GAAP Financial Measures 12 The following information provides reconciliations of non - GAAP financial measures from operations presented in the accompanying news release to the most comparable financial measures calculated and presented in accordance with accounting principles generally accepted in the U . S . (“GAAP”) . The company has provided non - GAAP financial measures, which are not calculated or presented in accordance with GAAP, as information supplemental and in addition to the financial measures presented in the accompanying news release that are calculated and presented in accordance with GAAP . Such non - GAAP financial measures should not be considered superior to, as a substitute for, or as an alternative to, and should be considered in conjunction with, the GAAP financial measures presented in the news release . The non - GAAP financial measures in the accompanying news release may differ from similar measures used by other companies . The following tables reconcile gross profit, operating expense, earnings before interest and taxes (EBIT), net income, net income per common share - diluted, and diluted earnings per share (EPS) guidance for the periods presented (GAAP financial measures) to adjusted gross profit, adjusted operating expense, adjusted earnings before interest and taxes (EBIT), adjusted net income, adjusted net income per common share - diluted, and adjusted diluted earnings per share (EPS) guidance (non - GAAP financial measures) for the periods presented . November 24, 2015
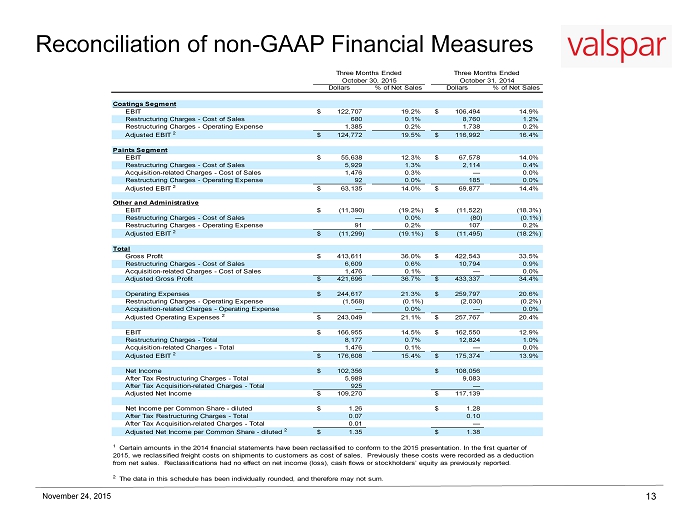
Reconciliation of non - GAAP Financial Measures 13 November 24, 2015 Dollars % of Net Sales Dollars % of Net Sales EBIT 122,707$ 19.2% 106,494$ 14.9% Restructuring Charges - Cost of Sales 680 0.1% 8,760 1.2% Restructuring Charges - Operating Expense 1,385 0.2% 1,738 0.2% Adjusted EBIT 2 124,772$ 19.5% 116,992$ 16.4% EBIT 55,638$ 12.3% 67,578$ 14.0% Restructuring Charges - Cost of Sales 5,929 1.3% 2,114 0.4% Acquisition-related Charges - Cost of Sales 1,476 0.3% — 0.0% Restructuring Charges - Operating Expense 92 0.0% 185 0.0% Adjusted EBIT 2 63,135$ 14.0% 69,877$ 14.4% EBIT (11,390)$ (19.2%) (11,522)$ (18.3%) Restructuring Charges - Cost of Sales — 0.0% (80) (0.1%) Restructuring Charges - Operating Expense 91 0.2% 107 0.2% Adjusted EBIT 2 (11,299)$ (19.1%) (11,495)$ (18.2%) Gross Profit 413,611$ 36.0% 422,543$ 33.5% Restructuring Charges - Cost of Sales 6,609 0.6% 10,794 0.9% Acquisition-related Charges - Cost of Sales 1,476 0.1% — 0.0% Adjusted Gross Profit 421,696$ 36.7% 433,337$ 34.4% Operating Expenses 244,617$ 21.3% 259,797$ 20.6% Restructuring Charges - Operating Expense (1,568) (0.1%) (2,030) (0.2%) Acquisition-related Charges - Operating Expense — 0.0% — 0.0% Adjusted Operating Expenses 2 243,049$ 21.1% 257,767$ 20.4% EBIT 166,955$ 14.5% 162,550$ 12.9% Restructuring Charges - Total 8,177 0.7% 12,824 1.0% Acquisition-related Charges - Total 1,476 0.1% — 0.0% Adjusted EBIT 2 176,608$ 15.4% 175,374$ 13.9% Net Income 102,356$ 108,056$ After Tax Restructuring Charges - Total 5,989 9,083 After Tax Acquisition-related Charges - Total 925 — Adjusted Net Income 109,270$ 117,139$ Net Income per Common Share - diluted 1.26$ 1.28$ After Tax Restructuring Charges - Total 0.07 0.10 After Tax Acquisition-related Charges - Total 0.01 — Adjusted Net Income per Common Share - diluted 2 1.35$ 1.38$ 2 The data in this schedule has been individually rounded, and therefore may not sum. 1 Certain amounts in the 2014 financial statements have been reclassified to conform to the 2015 presentation. In the first quarter of 2015, we reclassified freight costs on shipments to customers as cost of sales. Previously these costs were recorded as a deduction from net sales. Reclassifications had no effect on net income (loss), cash flows or stockholders’ equity as previously reported. Total Three Months Ended Three Months Ended October 30, 2015 October 31, 2014 Coatings Segment Paints Segment Other and Administrative
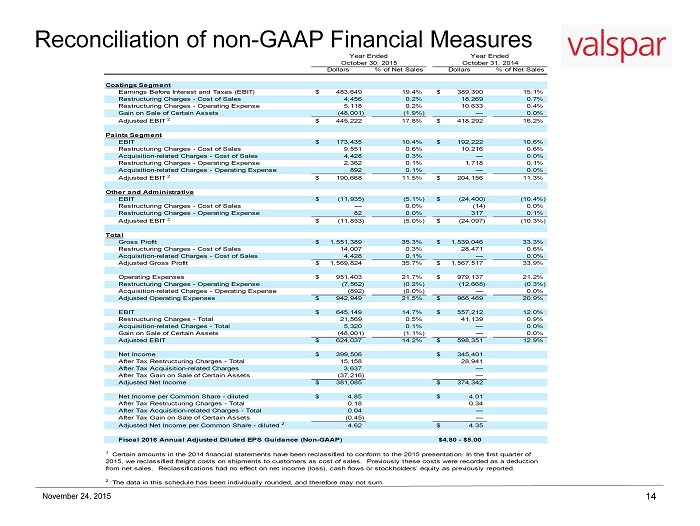
Reconciliation of non - GAAP Financial Measures 14 November 24, 2015 Dollars % of Net Sales Dollars % of Net Sales Earnings Before Interest and Taxes (EBIT) 483,649$ 19.4% 389,390$ 15.1% Restructuring Charges - Cost of Sales 4,456 0.2% 18,269 0.7% Restructuring Charges - Operating Expense 5,118 0.2% 10,633 0.4% Gain on Sale of Certain Assets (48,001) (1.9%) — 0.0% Adjusted EBIT 2 445,222$ 17.8% 418,292$ 16.2% EBIT 173,435$ 10.4% 192,222$ 10.6% Restructuring Charges - Cost of Sales 9,551 0.6% 10,216 0.6% Acquisition-related Charges - Cost of Sales 4,428 0.3% — 0.0% Restructuring Charges - Operating Expense 2,362 0.1% 1,718 0.1% Acquisition-related Charges - Operating Expense 892 0.1% — 0.0% Adjusted EBIT 2 190,668$ 11.5% 204,156$ 11.3% EBIT (11,935)$ (5.1%) (24,400)$ (10.4%) Restructuring Charges - Cost of Sales — 0.0% (14) 0.0% Restructuring Charges - Operating Expense 82 0.0% 317 0.1% Adjusted EBIT 2 (11,853)$ (5.0%) (24,097)$ (10.3%) Gross Profit 1,551,389$ 35.3% 1,539,046$ 33.3% Restructuring Charges - Cost of Sales 14,007 0.3% 28,471 0.6% Acquisition-related Charges - Cost of Sales 4,428 0.1% — 0.0% Adjusted Gross Profit 1,569,824$ 35.7% 1,567,517$ 33.9% Operating Expenses 951,403$ 21.7% 979,137$ 21.2% Restructuring Charges - Operating Expense (7,562) (0.2%) (12,668) (0.3%) Acquisition-related Charges - Operating Expense (892) (0.0%) — 0.0% Adjusted Operating Expenses 942,949$ 21.5% 966,469$ 20.9% EBIT 645,149$ 14.7% 557,212$ 12.0% Restructuring Charges - Total 21,569 0.5% 41,139 0.9% Acquisition-related Charges - Total 5,320 0.1% — 0.0% Gain on Sale of Certain Assets (48,001) (1.1%) — 0.0% Adjusted EBIT 624,037$ 14.2% 598,351$ 12.9% Net Income 399,506$ 345,401$ After Tax Restructuring Charges - Total 15,158 28,941 After Tax Acquisition-related Charges 3,637 — After Tax Gain on Sale of Certain Assets (37,216) — Adjusted Net Income 381,085$ 374,342$ Net Income per Common Share - diluted 4.85$ 4.01$ After Tax Restructuring Charges - Total 0.18 0.34 After Tax Acquisition-related Charges - Total 0.04 — After Tax Gain on Sale of Certain Assets (0.45) — Adjusted Net Income per Common Share - diluted 2 4.62 4.35$ Fiscal 2016 Annual Adjusted Diluted EPS Guidance (Non-GAAP) $4.80 - $5.00 2 The data in this schedule has been individually rounded, and therefore may not sum. 1 Certain amounts in the 2014 financial statements have been reclassified to conform to the 2015 presentation. In the first quarter of 2015, we reclassified freight costs on shipments to customers as cost of sales. Previously these costs were recorded as a deduction from net sales. Reclassifications had no effect on net income (loss), cash flows or stockholders’ equity as previously reported. Total October 30, 2015 October 31, 2014 Coatings Segment Paints Segment Other and Administrative Year Ended Year Ended
Valaris (NYSE:VAL)
Historical Stock Chart
From Mar 2024 to Apr 2024

Valaris (NYSE:VAL)
Historical Stock Chart
From Apr 2023 to Apr 2024
