UNITED STATES
SECURITIES
AND EXCHANGE COMMISSION
Washington,
D.C. 20549
FORM
8-K
CURRENT
REPORT
PURSUANT
TO SECTION 13 OR 15(d) OF THE
SECURITIES
EXCHANGE ACT OF 1934
Date
of Report (Date of earliest event reported)
February
3, 2016
Annaly
Capital Management, Inc.
(Exact
Name of Registrant as Specified in its Charter)
|
Maryland
|
|
1-13447
|
|
22-3479661
|
|
(State
or Other Jurisdiction
Of
Incorporation)
|
|
(Commission
File
Number)
|
|
(I.R.S.
Employer
Identification
No.)
|
|
1211
Avenue of the Americas
New
York, New York
|
|
10036
|
|
(Address
of Principal
Executive
Offices)
|
|
(Zip
Code)
|
Registrant’s
telephone number, including area code: (212) 696-0100
(Former
Name or Former Address, if Changed Since Last Report)
Check the
appropriate box below if the Form 8-K filing is intended to
simultaneously satisfy the filing obligation of the registrant under any
of the following provisions:
⃞
Written
communications pursuant to Rule 425 under the Securities Act (17 CFR
230.425)
⃞
Soliciting
material pursuant to Rule 14a-12 under the Exchange Act (17 CFR
240.14a-12)
⃞
Pre-commencement
communications pursuant to Rule 14d-2(b) under the Exchange Act (17 CFR
240.14d-2(b))
⃞
Pre-commencement
communications pursuant to Rule 13e-4(c) under the Exchange Act (17 CFR
240.13e-4(c))
Item 7.01. Regulation FD Disclosure
Annaly Capital Management, Inc. (the “Company”) hereby furnishes the
information set forth in the presentation (the “Presentation”) attached
hereto as Exhibit 99.1, which is incorporated herein by reference.
The
Presentation is being furnished pursuant to Item 7.01, and the
information contained therein shall not be deemed “filed” for the
purposes of Section 18 of the Securities Exchange Act of 1934, as
amended (the “Exchange Act”), or otherwise subject to the liabilities of
that section, nor shall it be deemed incorporated by reference in any
filing under the Securities Act of 1933, as amended, or the Exchange
Act, except as shall be expressly set forth by specific reference in
such filing.
The Presentation contains statements that, to the
extent they are not recitations of historical fact, constitute
“forward-looking statements” within the meaning of the Private
Securities Litigation Reform Act of 1995 (the “Reform Act”). All such
forward-looking statements are intended to be subject to the safe harbor
protection provided by the Reform Act. Actual outcomes and results could
differ materially from those forecast due to the impact of many factors
beyond the control of the Company. All forward looking statements
included in the Presentation are made only as of the date of the
Presentation and are subject to change without notice. Certain factors
that could cause actual results to differ materially from those
contained in the forward-looking statements are included in the
Company’s periodic reports filed with the SEC. Copies are available on
the SEC’s website at www.sec.gov. The Company disclaims any obligation
to update its forward looking statements unless required by law.
Item
9.01 Financial Statements and Exhibits
(d) Exhibits
99.1 Presentation
by Annaly Capital Management, Inc.
SIGNATURES
Pursuant to the requirements of the Securities Exchange Act of 1934, the
Registrant has duly caused this report to be signed on its behalf by the
undersigned hereunto duly authorized.
|
|
|
ANNALY CAPITAL MANAGEMENT, INC.
|
|
|
|
|
|
|
|
|
|
|
|
|
|
|
|
By:
|
/s/ Glenn A. Votek
|
|
|
|
|
|
Name:
|
Glenn A. Votek
|
|
|
|
|
Title:
|
Chief Financial Officer
|
|
|
|
|
|
|
|
|
|
|
|
|
|
|
|
Dated:
|
February 3, 2016
|
|
|
|
|

February 2016 Investor
Presentation
1 Safe Harbor This
Presentation contains statements that, to the extent they are not
recitations of historical fact, constitute “forward-looking statements”
within the meaning of the Private Securities Litigation Reform Act of
1995 (the “Reform Act”). All such forward-looking statements are
intended to be subject to the safe harbor protection provided by the
Reform Act. Actual outcomes and results could differ materially from
those forecast due to the impact of many factors beyond the control of
the Company. All forward looking statements included in this
Presentation are made only as of the date of this Presentation and are
subject to change without notice. Certain factors that could cause
actual results to differ materially from those contained in the
forward-looking statements are included in the Company’s periodic
reports filed with the SEC. Copies are available on the SEC’s website at
www.sec.gov. The Company disclaims any obligation to update its forward
looking statements unless required by law.

2 Introduction & Macro
Overview
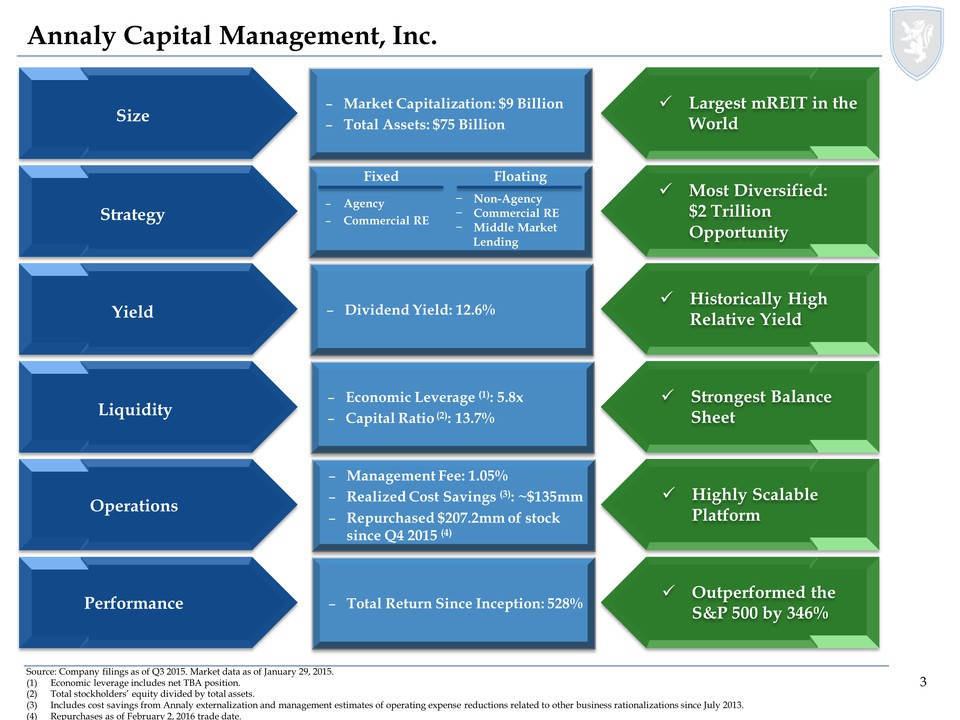
3 Historically High
Relative Yield Strongest Balance Sheet Highly Scalable Platform
Outperformed the S&P 500 by 346% Most Diversified: $2 Trillion
Opportunity Largest mREIT in the World Annaly Capital Management, Inc.
Size Strategy Yield Liquidity Operations Performance Source: Company
filings as of Q3 2015. Market data as of January 29, 2015. (1)Economic
leverage includes net TBA position. (2)Total stockholders’ equity
divided by total assets. (3)Includes cost savings from Annaly
externalization and management estimates of operating expense reductions
related to other business rationalizations since July 2013.
(4)Repurchases as of February 2, 2016 trade date. –Dividend Yield: 12.6%
–Economic Leverage (1): 5.8x –Capital Ratio (2): 13.7% –Management Fee:
1.05% –Realized Cost Savings (3): ~$135mm –Repurchased $207.2mm of stock
since Q4 2015 (4) –Total Return Since Inception: 528% –Agency
–Commercial RE –Market Capitalization: $9 Billion –Total Assets: $75
Billion −Non-Agency −Commercial RE −Middle Market Lending Fixed Floating
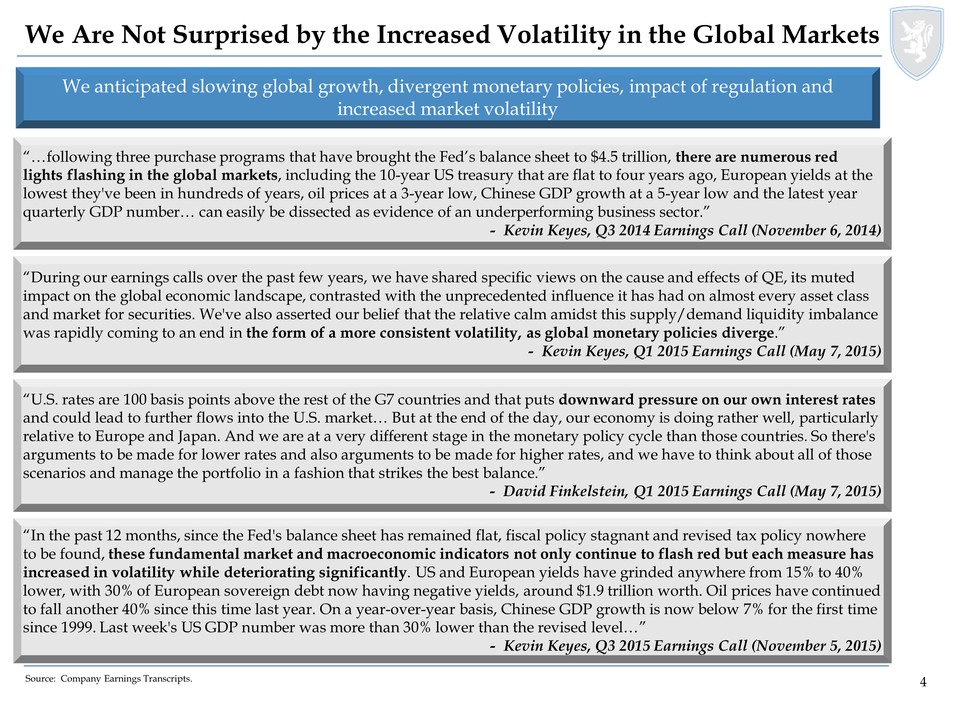
4 We Are Not Surprised by
the Increased Volatility in the Global Markets We anticipated slowing
global growth, divergent monetary policies, impact of regulation and
increased market volatility “In the past 12 months, since the Fed's
balance sheet has remained flat, fiscal policy stagnant and revised tax
policy nowhere to be found, these fundamental market and macroeconomic
indicators not only continue to flash red but each measure has increased
in volatility while deteriorating significantly. US and European yields
have grinded anywhere from 15% to 40% lower, with 30% of European
sovereign debt now having negative yields, around $1.9 trillion worth.
Oil prices have continued to fall another 40% since this time last year.
On a year-over-year basis, Chinese GDP growth is now below 7% for the
first time since 1999. Last week's US GDP number was more than 30% lower
than the revised level…” - Kevin Keyes, Q3 2015 Earnings Call (November
5, 2015) “…following three purchase programs that have brought the Fed’s
balance sheet to $4.5 trillion, there are numerous red lights flashing
in the global markets, including the 10-year US treasury that are flat
to four years ago, European yields at the lowest they've been in
hundreds of years, oil prices at a 3-year low, Chinese GDP growth at a
5-year low and the latest year quarterly GDP number… can easily be
dissected as evidence of an underperforming business sector.” - Kevin
Keyes, Q3 2014 Earnings Call (November 6, 2014) “U.S. rates are 100
basis points above the rest of the G7 countries and that puts downward
pressure on our own interest rates and could lead to further flows into
the U.S. market… But at the end of the day, our economy is doing rather
well, particularly relative to Europe and Japan. And we are at a very
different stage in the monetary policy cycle than those countries. So
there's arguments to be made for lower rates and also arguments to be
made for higher rates, and we have to think about all of those scenarios
and manage the portfolio in a fashion that strikes the best balance.” -
David Finkelstein, Q1 2015 Earnings Call (May 7, 2015) “During our
earnings calls over the past few years, we have shared specific views on
the cause and effects of QE, its muted impact on the global economic
landscape, contrasted with the unprecedented influence it has had on
almost every asset class and market for securities. We've also asserted
our belief that the relative calm amidst this supply/demand liquidity
imbalance was rapidly coming to an end in the form of a more consistent
volatility, as global monetary policies diverge.” - Kevin Keyes, Q1 2015
Earnings Call (May 7, 2015) Source: Company Earnings Transcripts.
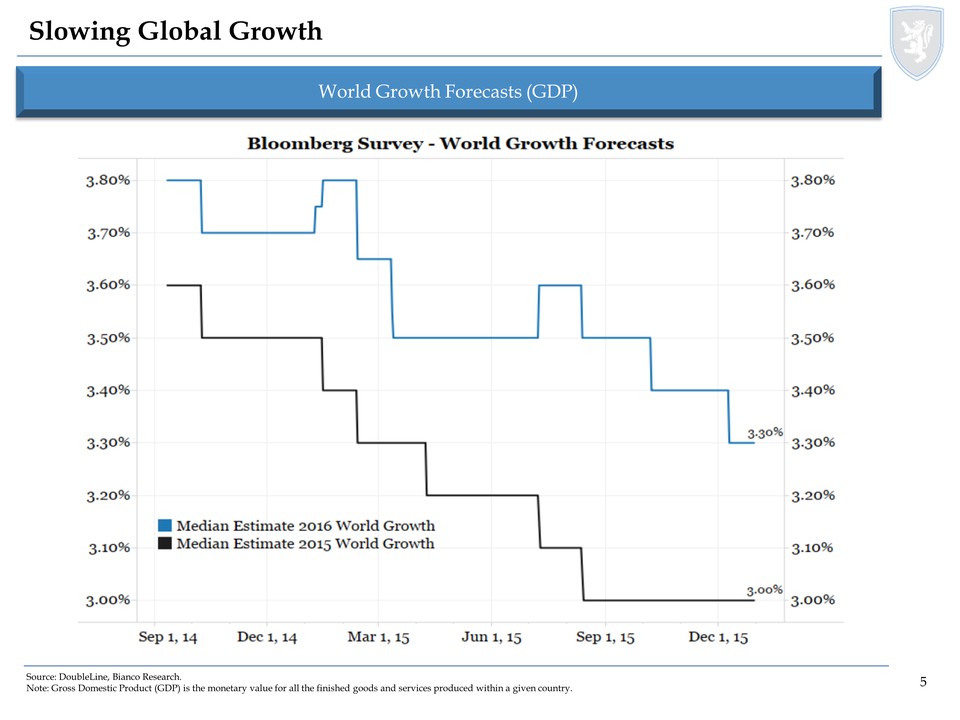
5 Source: DoubleLine,
Bianco Research. Note: Gross Domestic Product (GDP) is the monetary
value for all the finished goods and services produced within a given
country. Slowing Global Growth World Growth Forecasts (GDP) 3.80% 3.70%
3.60% 3.50% 3.40% 3.30% 3.20% 3.10% 3.00% Sep 1, 14 Dec 1, 14 Mar 1, 15
Jun 1, 15 Sep 1, 15 Dec 1, 15
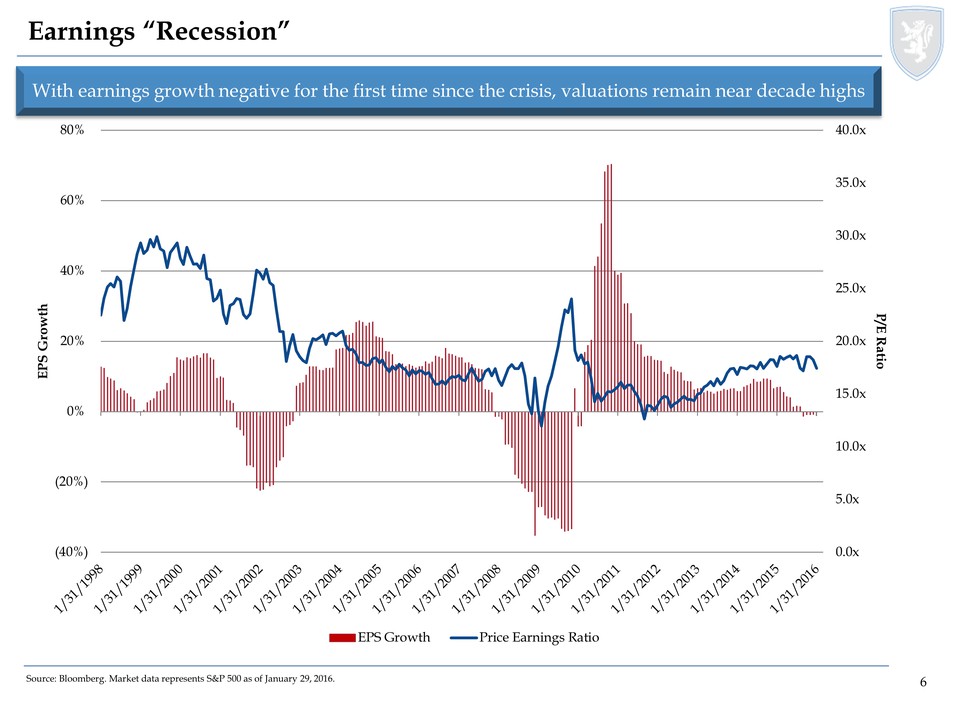
6 Source: Bloomberg. Market
data represents S&P 500 as of January 29, 2016. With earnings growth
negative for the first time since the crisis, valuations remain near
decade highs Earnings “Recession” 0.0x 5.0x 10.0x 15.0x 20.0x 25.0x
30.0x 35.0x 40.0x (40%) (20%) 0% 20% 40% 60% 80% P/E Ratio EPS Growth
EPS Growth Price Earnings Ratio 1/31/1998 1/31/1999 1/31/2000 1/31/2001
1/31/2002 1/31/2003 1/31/2004 1/31/2005 1/31/2006 1/31/2007 1/31/2008
1/31/2009 1/31/2010 1/31/2011 1/31/2012 1/31/2013 1/31/2014 1/31/2015
1/31/2016
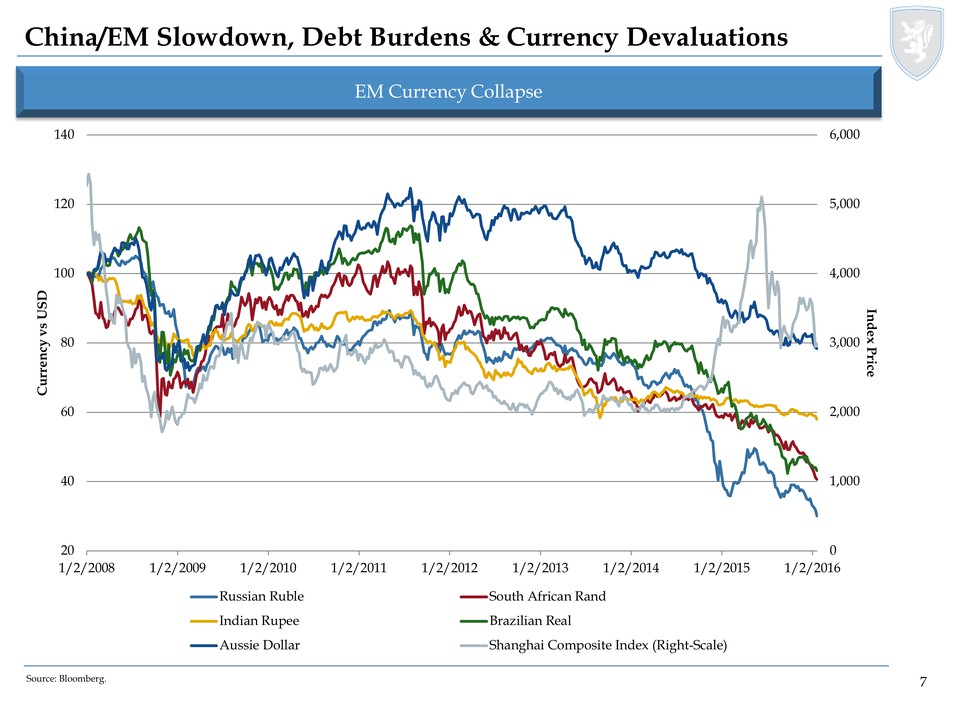
7 China/EM Slowdown, Debt
Burdens & Currency Devaluations EM Currency Collapse Source: Bloomberg.
0 1,000 2,000 3,000 4,000 5,000 6,000 20 40 60 80 100 120 140 1/2/2008
1/2/2009 1/2/2010 1/2/2011 1/2/2012 1/2/2013 1/2/2014 1/2/2015 1/2/2016
Index Price Currency vs USD Russian Ruble South African Rand Indian
Rupee Brazilian Real Aussie Dollar Shanghai Composite Index (Right-Scale)

8 Oil and Commodity
Collapse Signal Weakening Global Demand Commodity Prices (January 9,
1996 to January 11, 2016) Source: Bloomberg. Note: BCOM Commodity Index
is calculated on an excess return basis and reflects commodity futures
price movements with monthly rebalancing. You cannot invest directly in
an index. 240 220 200 180 160 140 120 100 60 ‘96’97 ’98 ’99 ’00 02 03 04
05 06 07 08 09 10 11 12 13 14 15 75.8560 237.9531 129.2791 74.2411 Last
Price High on 07/02/08 Average Low on 02/26/99
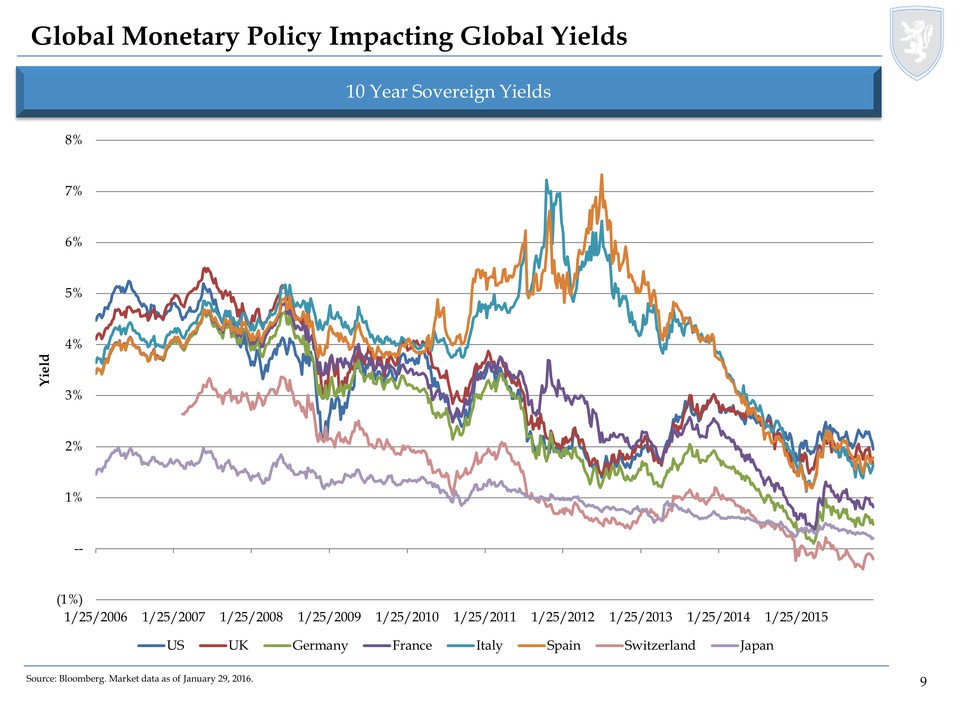
9 Global Monetary Policy
Impacting Global Yields 10 Year Sovereign Yields Source: Bloomberg.
Market data as of January 29, 2016. (1%) -- 1% 2% 3% 4% 5% 6% 7% 8%
1/25/2006 1/25/2007 1/25/2008 1/25/2009 1/25/2010 1/25/2011 1/25/2012
1/25/2013 1/25/2014 1/25/2015 Yield US UK Germany France Italy Spain
Switzerland Japan
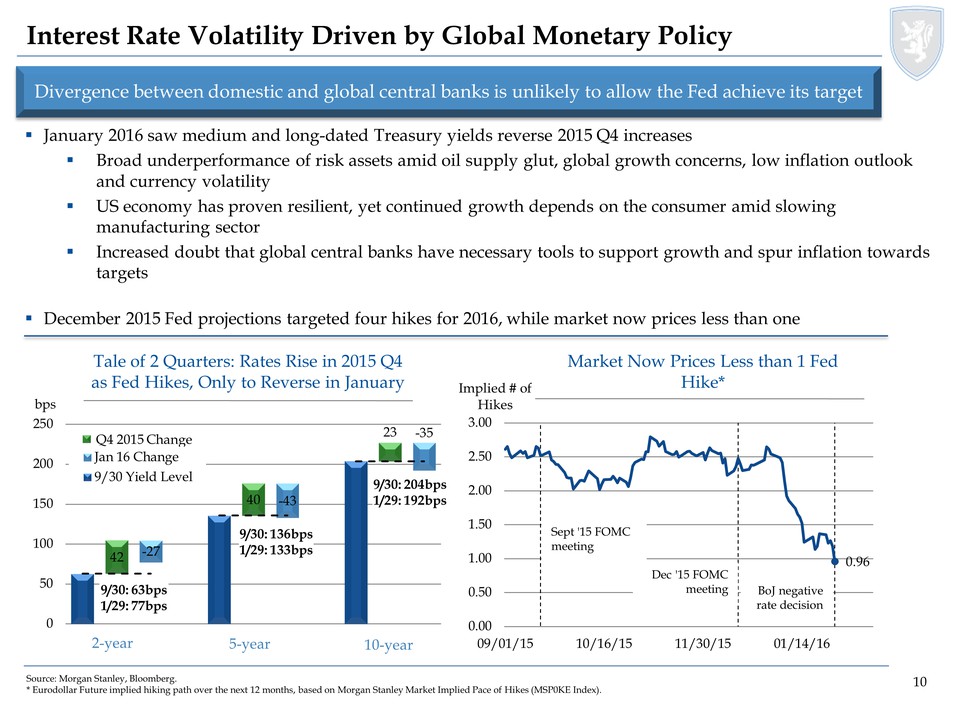
10 Source: Morgan Stanley,
Bloomberg. * Eurodollar Future implied hiking path over the next 12
months, based on Morgan Stanley Market Implied Pace of Hikes (MSP0KE
Index). Interest Rate Volatility Driven by Global Monetary Policy
January 2016 saw medium and long-dated Treasury yields reverse 2015 Q4
increases Broad underperformance of risk assets amid oil supply glut,
global growth concerns, low inflation outlook and currency volatility US
economy has proven resilient, yet continued growth depends on the
consumer amid slowing manufacturing sector Increased doubt that global
central banks have necessary tools to support growth and spur inflation
towards targets December 2015 Fed projections targeted four hikes for
2016, while market now prices less than one 0.96 0.00 0.50 1.00 1.50
2.00 2.50 3.00 09/01/15 10/16/15 11/30/15 01/14/16 Implied # of Hikes
Sept '15 FOMC meeting Dec '15 FOMC meeting BoJ negative rate decision 42
-27 40 -43 23 -35 0 50 100 150 200 250 bps Jan 16 Change 9/30 Yield
Level 2-year 5-year 10-year 9/30: 63bps 1/29: 77bps 9/30: 136bps 1/29:
133bps 9/30: 204bps 1/29: 192bps Q4 2015 Change Tale of 2 Quarters:
Rates Rise in 2015 Q4 as Fed Hikes, Only to Reverse in January Market
Now Prices Less than 1 Fed Hike* Divergence between domestic and global
central banks is unlikely to allow the Fed achieve its target

11 Annaly’s Positioning
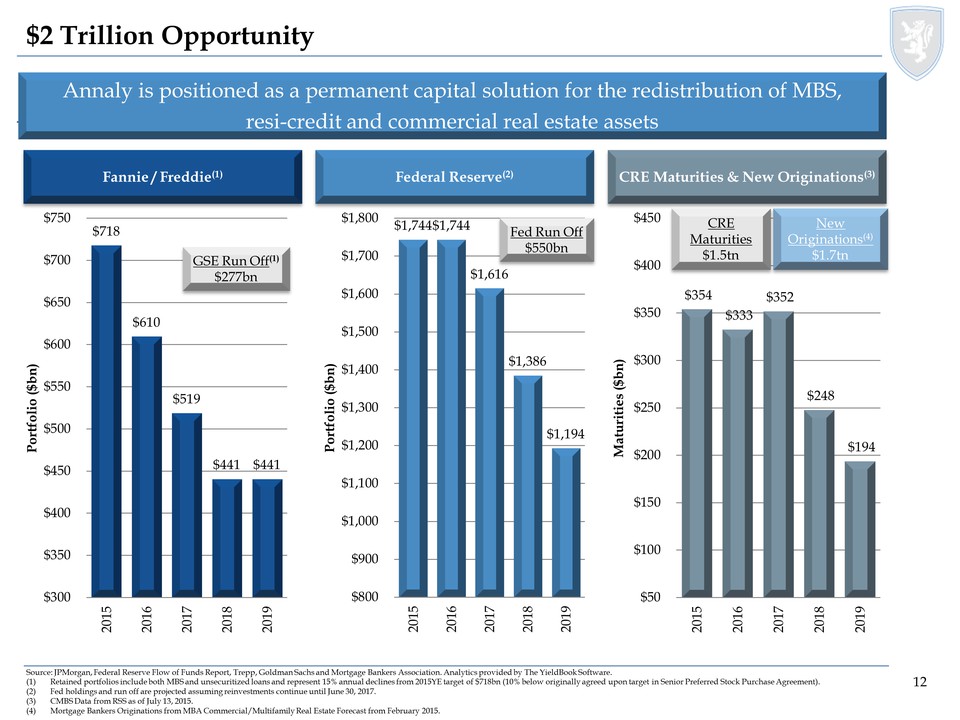
12 $1,744 $1,744 $1,616
$1,386 $1,194 $800 $900 $1,000 $1,100 $1,200 $1,300 $1,400 $1,500 $1,600
$1,700 $1,800 2015 2016 2017 2018 2019 Portfolio ($bn) $718 $610 $519
$441 $441 $300 $350 $400 $450 $500 $550 $600 $650 $700 $750 2015 2016
2017 2018 2019 Portfolio ($bn) $2 Trillion Opportunity Annaly is
positioned as a permanent capital solution for the redistribution of
MBS, resi-credit and commercial real estate assets Federal Reserve(2)
Fannie / Freddie(1) CRE Maturities & New Originations(3) Source:
JPMorgan, Federal Reserve Flow of Funds Report, Trepp, Goldman Sachs and
Mortgage Bankers Association. Analytics provided by The YieldBook
Software. (1)Retained portfolios include both MBS and unsecuritized
loans and represent 15% annual declines from 2015YE target of $718bn
(10% below originally agreed upon target in Senior Preferred Stock
Purchase Agreement). (2)Fed holdings and run off are projected assuming
reinvestments continue until June 30, 2017. (3)CMBS Data from RSS as of
July 13, 2015. (4)Mortgage Bankers Originations from MBA
Commercial/Multifamily Real Estate Forecast from February 2015. GSE Run
Off(1) $277bn Fed Run Off $550bn $354 $333 $352 $248 $194 $50 $100 $150
$200 $250 $300 $350 $400 $450 2015 2016 2017 2018 2019 Maturities ($bn)
CRE Maturities $1.5tn New Originations(4) $1.7tn
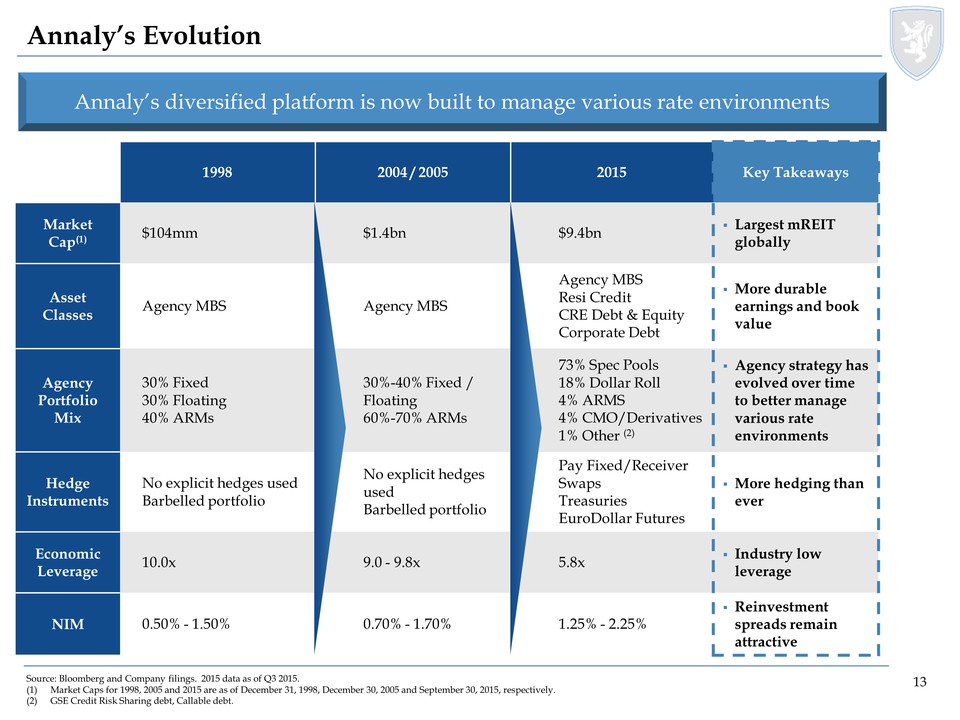
13 Source: Bloomberg and
Company filings. 2015 data as of Q3 2015. (1)Market Caps for 1998, 2005
and 2015 are as of December 31, 1998, December 30, 2005 and September
30, 2015, respectively. (2)GSE Credit Risk Sharing debt, Callable debt.
1998 2004 / 2005 2015 Key Takeaways Market Cap(1) $104mm $1.4bn $9.4bn
Largest mREIT globally Asset Classes Agency MBS Agency MBS Agency MBS
Resi Credit CRE Debt & Equity Corporate Debt More durable earnings and
book value Agency Portfolio Mix 30% Fixed 30% Floating 40% ARMs 30%-40%
Fixed / Floating 60%-70% ARMs 73% Spec Pools 18% Dollar Roll 4% ARMS 4%
CMO/Derivatives 1% Other (2) Agency strategy has evolved over time to
better manage various rate environments Hedge Instruments No explicit
hedges used Barbelled portfolio No explicit hedges used Barbelled
portfolio Pay Fixed/Receiver Swaps Treasuries EuroDollar Futures More
hedging than ever Economic Leverage 10.0x 9.0 - 9.8x 5.8x Industry low
leverage NIM 0.50% - 1.50% 0.70% - 1.70% 1.25% - 2.25% Reinvestment
spreads remain attractive Annaly’s Evolution Annaly’s diversified
platform is now built to manage various rate environments
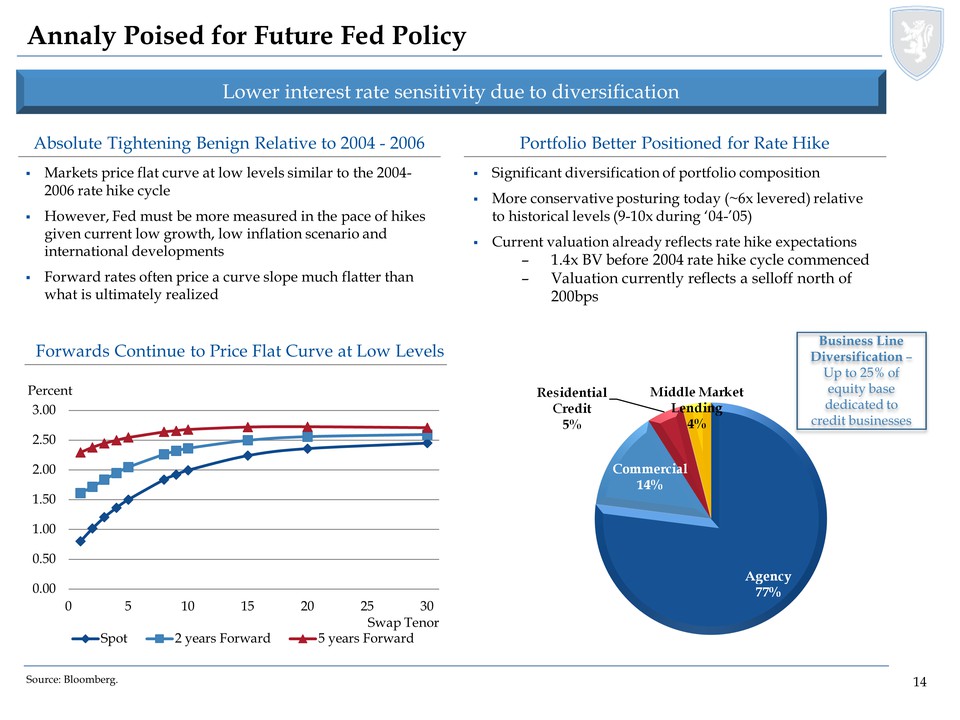
14 Absolute Tightening
Benign Relative to 2004 - 2006 Lower interest rate sensitivity due to
diversification Markets price flat curve at low levels similar to the
2004- 2006 rate hike cycle However, Fed must be more measured in the
pace of hikes given current low growth, low inflation scenario and
international developments Forward rates often price a curve slope much
flatter than what is ultimately realized Significant diversification of
portfolio composition More conservative posturing today (~6x levered)
relative to historical levels (9-10x during ‘04-’05) Current valuation
already reflects rate hike expectations – 1.4x BV before 2004 rate hike
cycle commenced – Valuation currently reflects a selloff north of 200bps
Agency 77% Commercial 14% Residential Credit 5% Middle Market Lending 4%
Portfolio Better Positioned for Rate Hike Annaly Poised for Future Fed
Policy Business Line Diversification – Up to 25% of equity base
dedicated to credit businesses 0.00 0.50 1.00 1.50 2.00 2.50 3.00 0 5 10
15 20 25 30 Percent Swap Tenor Spot 2 years Forward 5 years Forward
Forwards Continue to Price Flat Curve at Low Levels Source: Bloomberg.
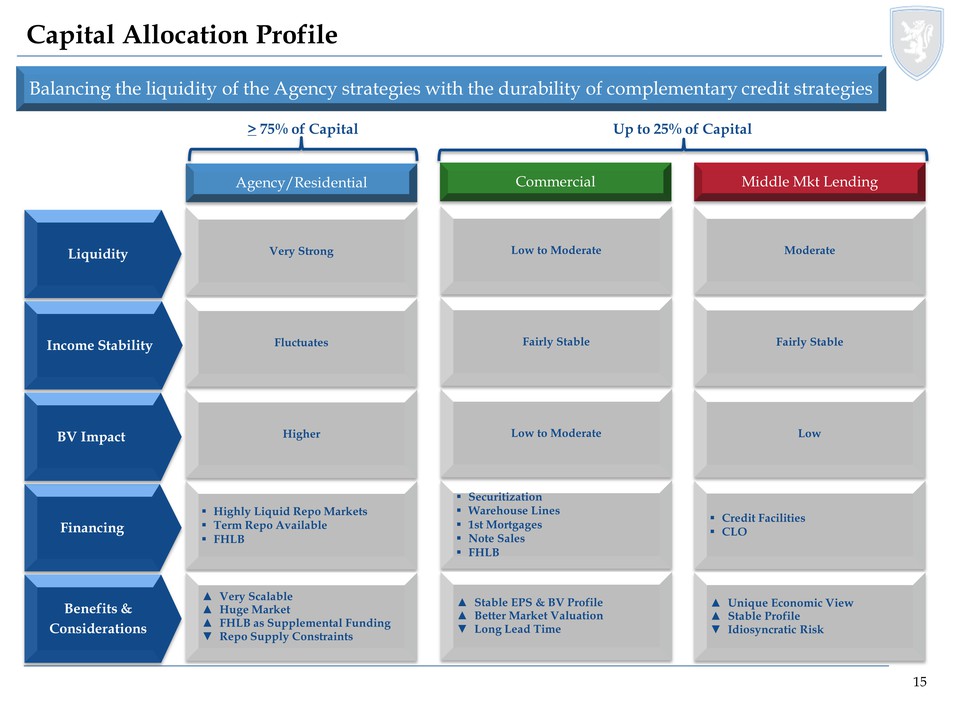
15 Agency/Residential
Commercial Middle Mkt Lending Financing Benefits &
Considerations Highly Liquid Repo Markets Term Repo Available FHLB Very
Scalable Huge Market FHLB as Supplemental Funding Repo Supply
Constraints Securitization Warehouse Lines 1st Mortgages Note
Sales FHLB Stable EPS & BV Profile Better Market Valuation Long Lead
Time Credit Facilities CLO Unique Economic View Stable Profile
Idiosyncratic Risk Liquidity Very Strong Low to Moderate Moderate
Benefits Higher Low to Moderate Low Fluctuates Fairly Stable Fairly
Stable Income Stability BV Impact Capital Allocation Profile > 75% of
Capital Up to 25% of Capital Balancing the liquidity of the Agency
strategies with the durability of complementary credit strategies
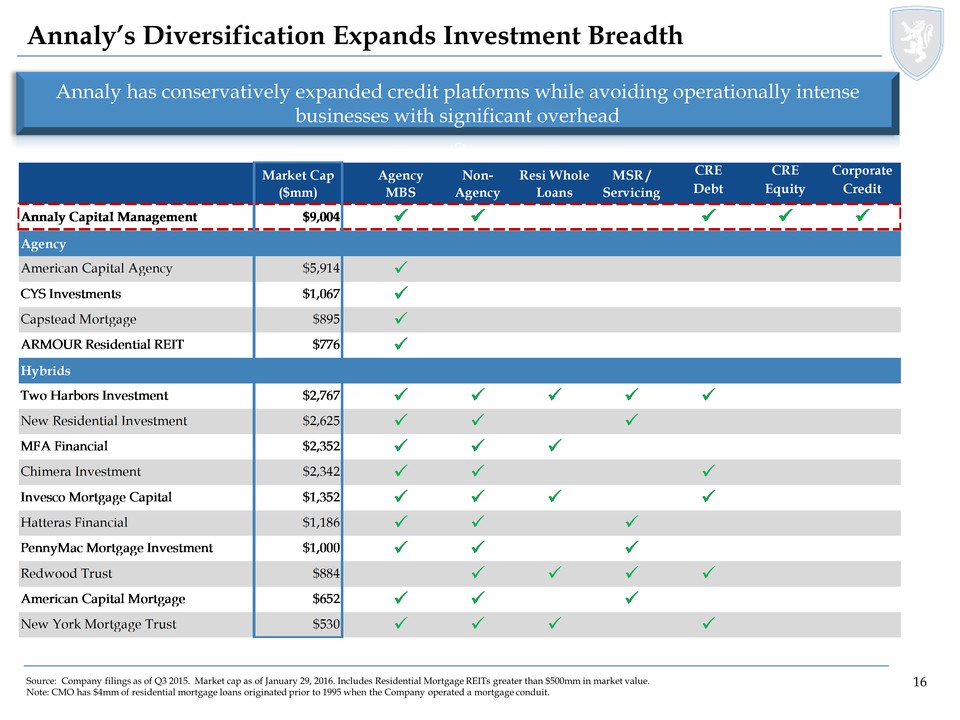
16 Annaly’s Diversification
Expands Investment Breadth Source: Company filings as of Q3 2015. Market
cap as of January 29, 2016. Includes Residential Mortgage REITs greater
than $500mm in market value. Note: CMO has $4mm of residential mortgage
loans originated prior to 1995 when the Company operated a mortgage
conduit. Annaly has conservatively expanded credit platforms while
avoiding operationally intense businesses with significant overhead
CRECRECorporateDebtEquityCreditAnnaly Capital Management$9,004
AgencyAmerican Capital Agency$5,914 CYS Investments$1,067 Capstead
Mortgage$895 ARMOUR Residential REIT$776 HybridsTwo Harbors
Investment$2,767 New Residential Investment$2,625 MFA Financial$2,352
Chimera Investment$2,342 Invesco Mortgage Capital$1,352 Hatteras
Financial$1,186 PennyMac Mortgage Investment$1,000 Redwood Trust$884
American Capital Mortgage$652 New York Mortgage Trust$530 Market Cap
($mm)MSR / ServicingAgency MBSNon-AgencyResi Whole Loans
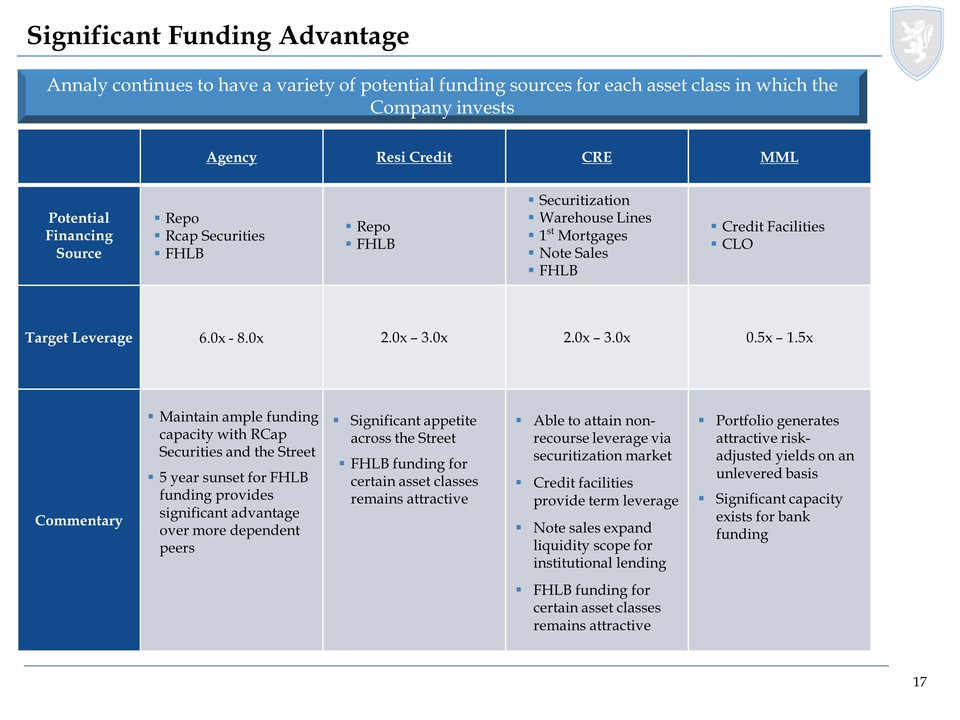
17 Significant Funding
Advantage Agency Resi Credit CRE MML Potential Financing
Source Repo Rcap
Securities FHLB Repo FHLB Securitization Warehouse Lines 1st
Mortgages Note Sales FHLB Credit Facilities CLO Target Leverage 6.0x
- 8.0x 2.0x – 3.0x 2.0x – 3.0x 0.5x – 1.5x Commentary Maintain ample
funding capacity with RCap Securities and the Street 5 year sunset for
FHLB funding provides significant advantage over more dependent
peers Significant appetite across the Street FHLB funding for certain
asset classes remains attractive Able to attain non-recourse leverage
via securitization market Credit facilities provide term leverage Note
sales expand liquidity scope for institutional lending FHLB funding for
certain asset classes remains attractive Portfolio generates attractive
risk-adjusted yields on an unlevered basis Significant capacity exists
for bank funding Annaly continues to have a variety of potential funding
sources for each asset class in which the Company invests
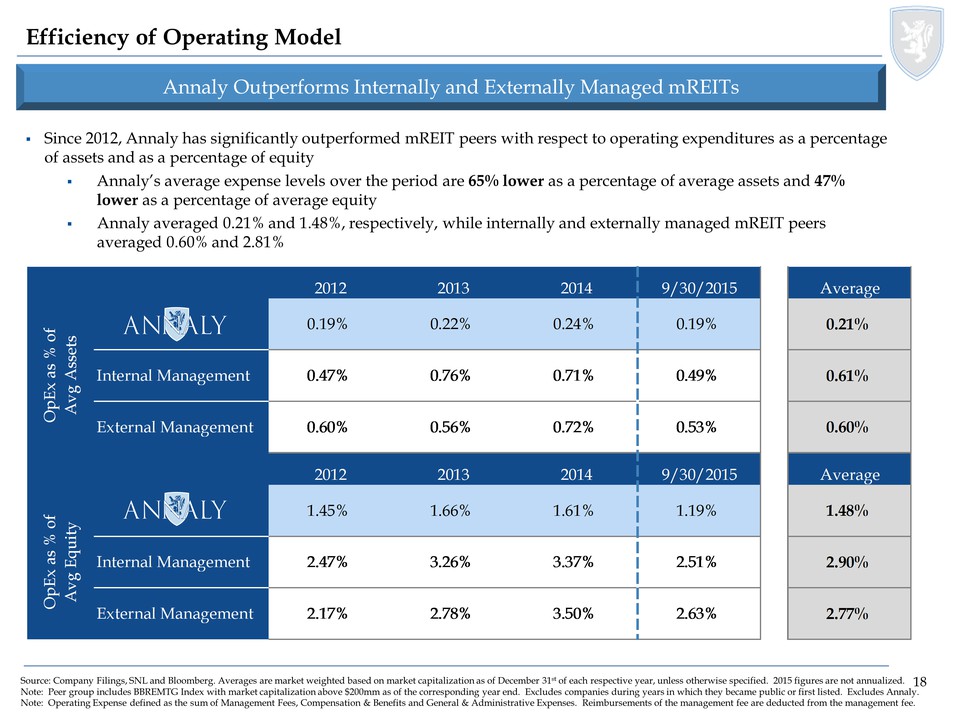
18 2012 2013 2014 9/30/2015
Average 0.19% 0.22% 0.24% 0.19% 0.21% Internal Management 0.47% 0.76%
0.71% 0.49% 0.61% External Management 0.60% 0.56% 0.72% 0.53% 0.60% 2012
2013 2014 9/30/2015 Average 1.45% 1.66% 1.61% 1.19% 1.48% Internal
Management 2.47% 3.26% 3.37% 2.51% 2.90% External Management 2.17% 2.78%
3.50% 2.63% 2.77% OpEx as % of Avg Equity OpEx as % of Avg Assets
Efficiency of Operating Model Since 2012, Annaly has significantly
outperformed mREIT peers with respect to operating expenditures as a
percentage of assets and as a percentage of equity Annaly’s average
expense levels over the period are 65% lower as a percentage of average
assets and 47% lower as a percentage of average equity Annaly averaged
0.21% and 1.48%, respectively, while internally and externally managed
mREIT peers averaged 0.60% and 2.81% Source: Company Filings, SNL and
Bloomberg. Averages are market weighted based on market capitalization
as of December 31st of each respective year, unless otherwise specified.
2015 figures are not annualized. Note: Peer group includes BBREMTG Index
with market capitalization above $200mm as of the corresponding year
end. Excludes companies during years in which they became public or
first listed. Excludes Annaly. Note: Operating Expense defined as the
sum of Management Fees, Compensation & Benefits and General &
Administrative Expenses. Reimbursements of the management fee are
deducted from the management fee. Annaly Outperforms Internally and
Externally Managed mREITs

19 Industry Landscape &
Performance
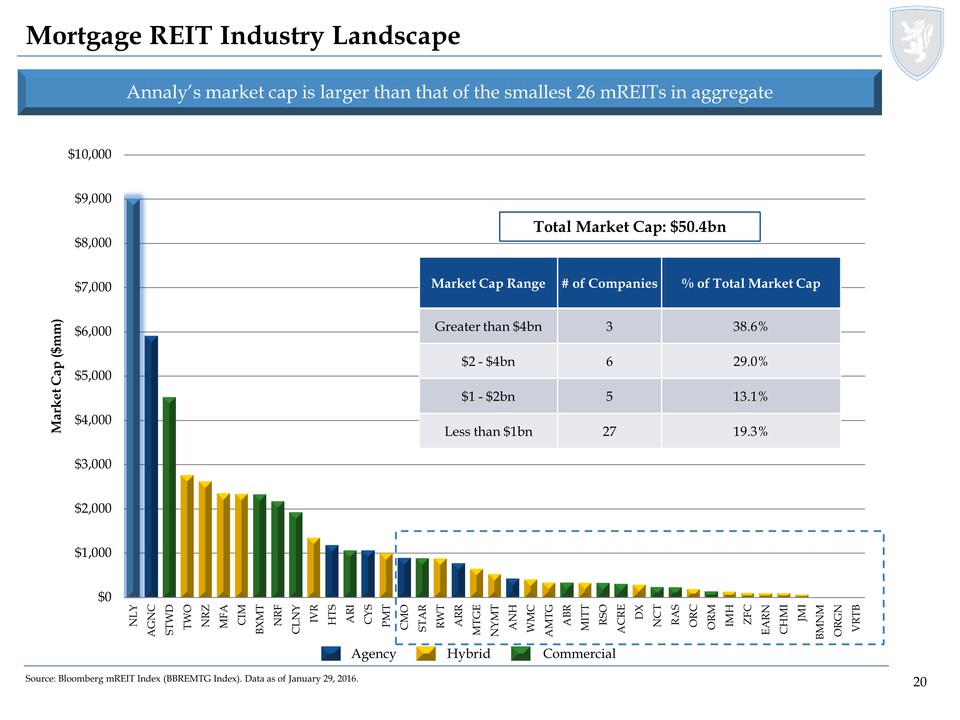
20 $0 $1,000 $2,000 $3,000
$4,000 $5,000 $6,000 $7,000 $8,000 $9,000 $10,000 NLY AGNC STWD TWO NRZ
MFA CIM BXMT NRF CLNY IVR HTS ARI CYS PMT CMO STAR RWT ARR MTGE NYMT ANH
WMC AMTG ABR MITT RSO ACRE DX NCT RAS ORC ORM IMH ZFC EARN CHMI JMI BMNM
ORGN VRTB Market Cap ($mm) Agency Hybrid Commercial Source: Bloomberg
mREIT Index (BBREMTG Index). Data as of January 29, 2016. Total Market
Cap: $50.4bn Market Cap Range # of Companies % of Total Market Cap
Greater than $4bn 3 38.6% $2 - $4bn 6 29.0% $1 - $2bn 5 13.1% Less than
$1bn 27 19.3% Annaly’s market cap is larger than that of the smallest 26
mREITs in aggregate Mortgage REIT Industry Landscape
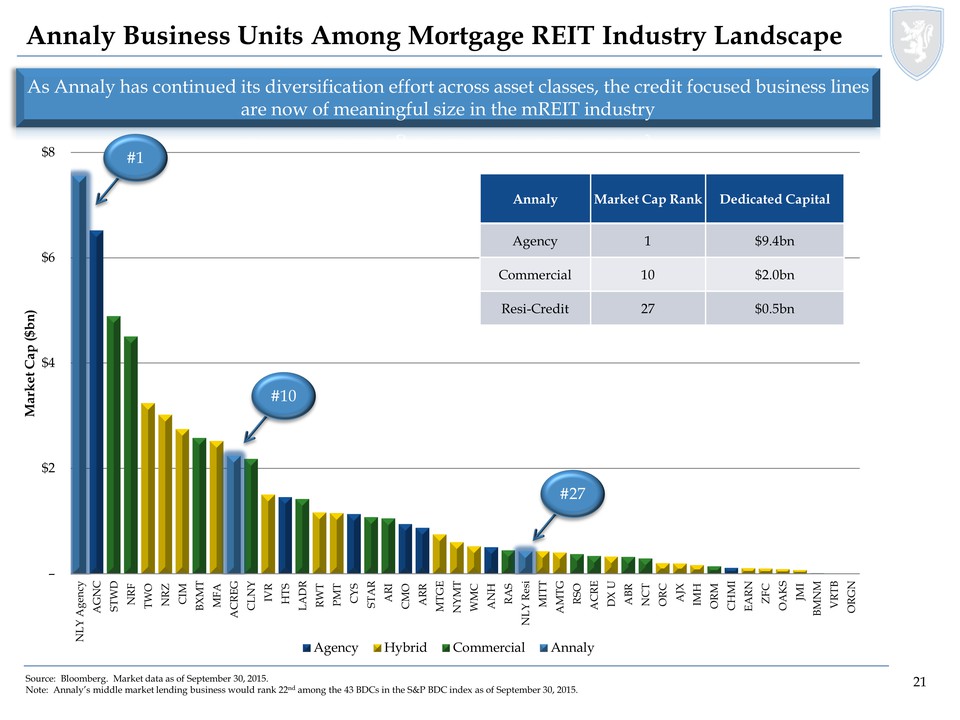
21 – $2 $4 $6 $8 NLY Agency
AGNC STWD NRF TWO NRZ CIM BXMT MFA ACREG CLNY IVR HTS LADR RWT PMT CYS
STAR ARI CMO ARR MTGE NYMT WMC ANH RAS NLY Resi MITT AMTG RSO ACRE DX U
ABR NCT ORC AJX IMH ORM CHMI EARN ZFC OAKS JMI BMNM VRTB ORGN Market Cap
($bn) Agency Hybrid Commercial Annaly Source: Bloomberg. Market data as
of September 30, 2015. Note: Annaly’s middle market lending business
would rank 22nd among the 43 BDCs in the S&P BDC index as of September
30, 2015. As Annaly has continued its diversification effort across
asset classes, the credit focused business lines are now of meaningful
size in the mREIT industry Annaly Market Cap Rank Dedicated Capital
Agency 1 $9.4bn Commercial 10 $2.0bn Resi-Credit 27 $0.5bn #1 #10 #27
Annaly Business Units Among Mortgage REIT Industry Landscape
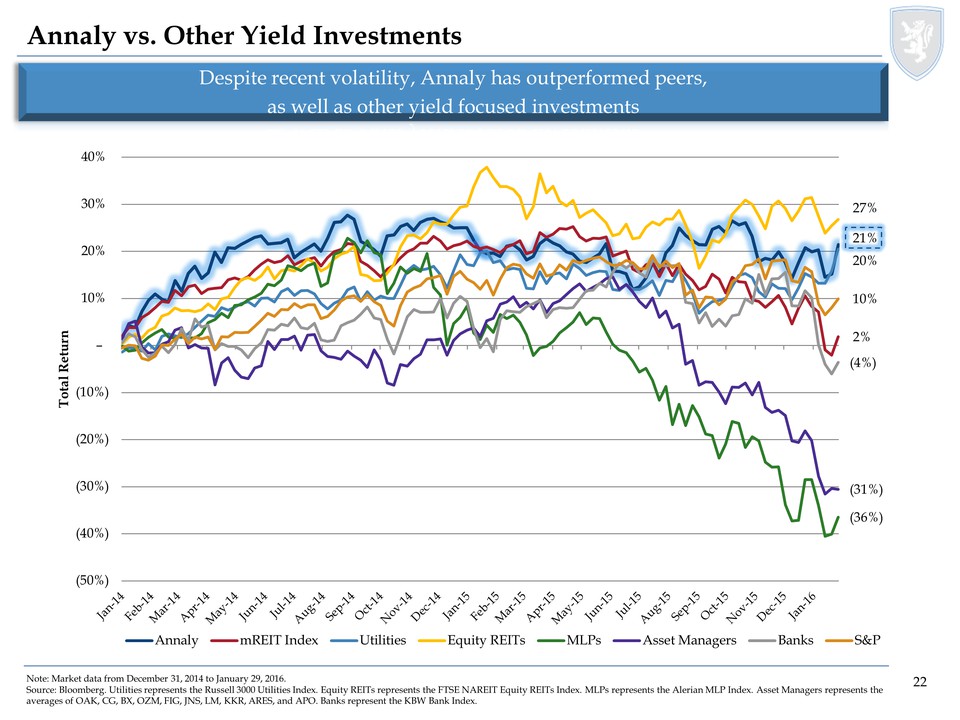
22 Annaly vs. Other Yield
Investments Note: Market data from December 31, 2014 to January 29,
2016. Source: Bloomberg. Utilities represents the Russell 3000 Utilities
Index. Equity REITs represents the FTSE NAREIT Equity REITs Index. MLPs
represents the Alerian MLP Index. Asset Managers represents the averages
of OAK, CG, BX, OZM, FIG, JNS, LM, KKR, ARES, and APO. Banks represent
the KBW Bank Index. Despite recent volatility, Annaly has outperformed
peers, as well as other yield focused investments 21% 2% 20% 27% (36%)
(31%) (4%) 10% (50%) (40%) (30%) (20%) (10%) – 10% 20% 30% 40% Total
Return Annaly mREIT Index Utilities Equity REITs MLPs Asset Managers
Banks S&P
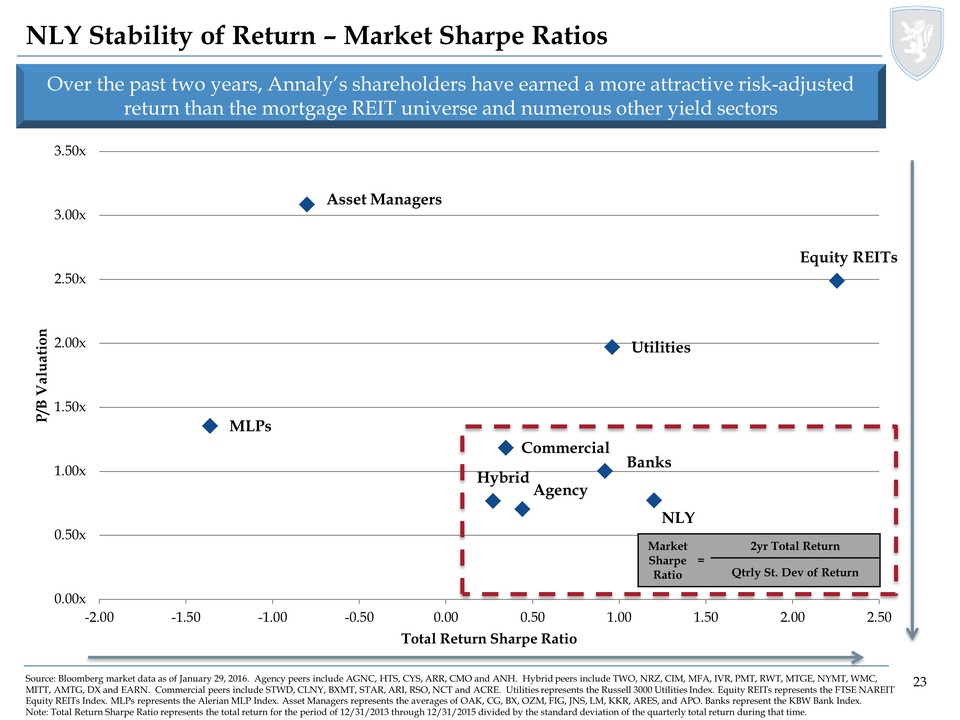
23 Utilities Equity REITs
MLPs Asset Managers Banks NLY Agency Commercial Hybrid 0.00x 0.50x 1.00x
1.50x 2.00x 2.50x 3.00x 3.50x -2.00 -1.50 -1.00 -0.50 0.00 0.50 1.00
1.50 2.00 2.50 P/B Valuation Total Return Sharpe Ratio Over the past two
years, Annaly’s shareholders have earned a more attractive risk-adjusted
return than the mortgage REIT universe and numerous other yield sectors
Source: Bloomberg market data as of January 29, 2016. Agency peers
include AGNC, HTS, CYS, ARR, CMO and ANH. Hybrid peers include TWO, NRZ,
CIM, MFA, IVR, PMT, RWT, MTGE, NYMT, WMC, MITT, AMTG, DX and EARN.
Commercial peers include STWD, CLNY, BXMT, STAR, ARI, RSO, NCT and ACRE.
Utilities represents the Russell 3000 Utilities Index. Equity REITs
represents the FTSE NAREIT Equity REITs Index. MLPs represents the
Alerian MLP Index. Asset Managers represents the averages of OAK, CG,
BX, OZM, FIG, JNS, LM, KKR, ARES, and APO. Banks represent the KBW Bank
Index. Note: Total Return Sharpe Ratio represents the total return for
the period of 12/31/2013 through 12/31/2015 divided by the standard
deviation of the quarterly total return during that time. NLY Stability
of Return – Market Sharpe Ratios Market Sharpe Ratio = 2yr Total Return
Qtrly St. Dev of Return
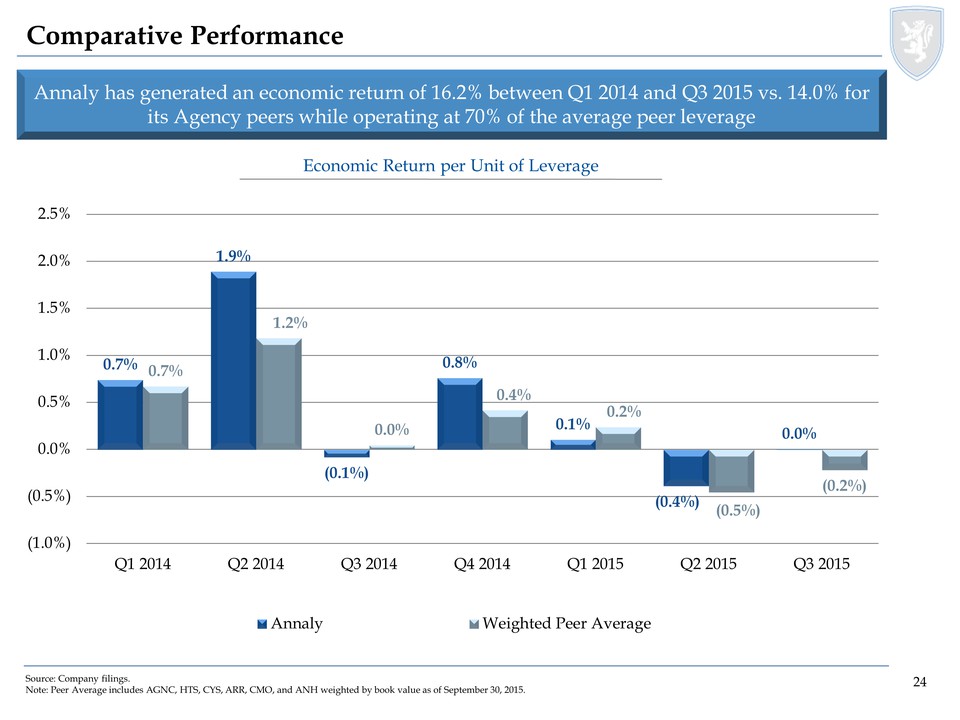
24 0.7% 1.9% (0.1%) 0.8%
0.1% (0.4%) 0.0% 0.7% 1.2% 0.0% 0.4% 0.2% (0.5%) (0.2%) (1.0%) (0.5%)
0.0% 0.5% 1.0% 1.5% 2.0% 2.5% Q1 2014 Q2 2014 Q3 2014 Q4 2014 Q1 2015 Q2
2015 Q3 2015 Annaly Weighted Peer Average Comparative Performance Annaly
has generated an economic return of 16.2% between Q1 2014 and Q3 2015
vs. 14.0% for its Agency peers while operating at 70% of the average
peer leverage Source: Company filings. Note: Peer Average includes AGNC,
HTS, CYS, ARR, CMO, and ANH weighted by book value as of September 30,
2015. Economic Return per Unit of Leverage
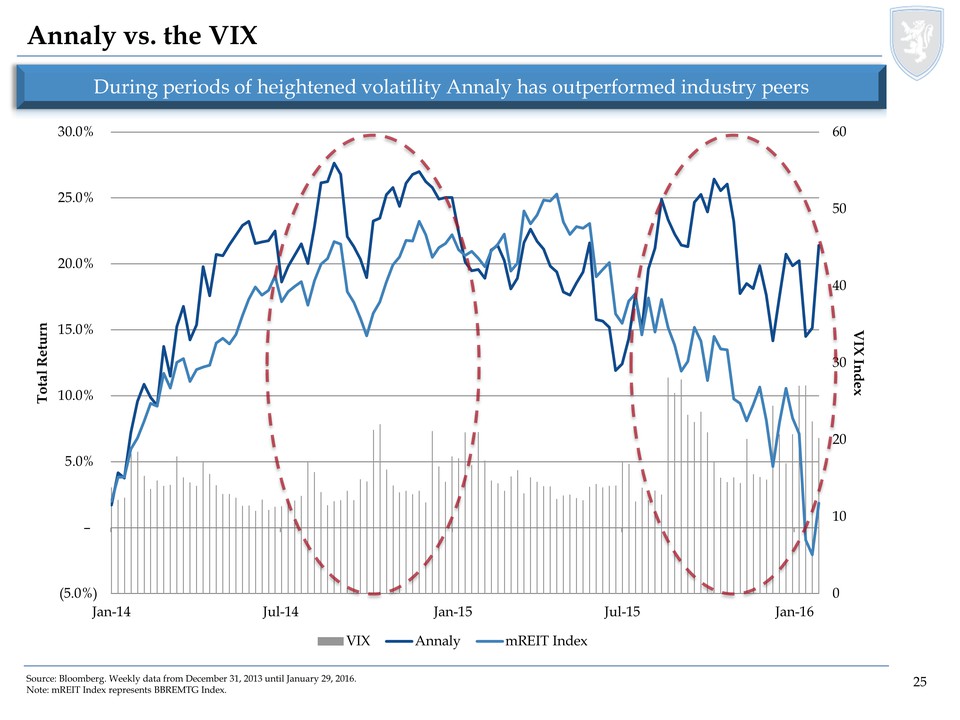
25 0 10 20 30 40 50 60
(5.0%) – 5.0% 10.0% 15.0% 20.0% 25.0% 30.0% Jan-14 Jul-14 Jan-15 Jul-15
Jan-16 VIX Index Total Return VIX Annaly mREIT Index Annaly vs. the VIX
Source: Bloomberg. Weekly data from December 31, 2013 until January 29,
2016. Note: mREIT Index represents BBREMTG Index. During periods of
heightened volatility Annaly has outperformed industry peers
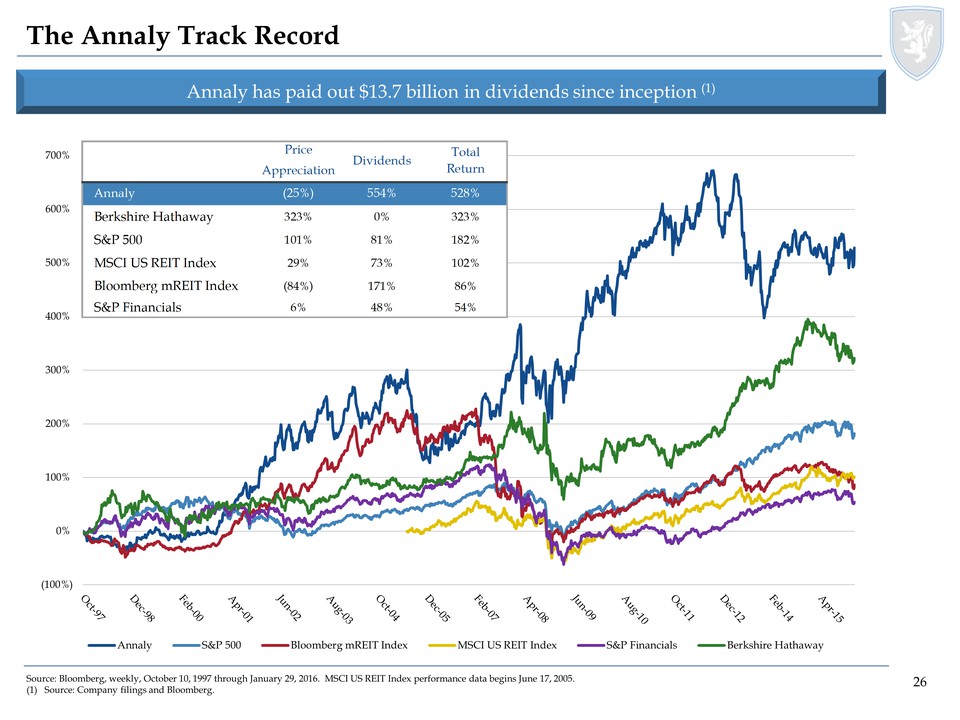
26 The Annaly Track Record
Annaly has paid out $13.7 billion in dividends since inception (1)
Source: Bloomberg, weekly, October 10, 1997 through January 29, 2016.
MSCI US REIT Index performance data begins June 17, 2005. (1) Source:
Company filings and Bloomberg. (100%) 0% 100% 200% 300% 400% 500% 600%
700% Annaly S&P 500 Bloomberg mREIT Index MSCI US REIT Index S&P
Financials Berkshire Hathaway Price AppreciationAnnaly(25%)554% 528%
Berkshire Hathaway323% 0% 323% S&P 500101% 81% 182% MSCI US REIT
Index29% 73% 102% Bloomberg mREIT Index(84%)171% 86% S&P Financials6%
48% 54% DividendsTotalReturn
Annaly Capital Management (NYSE:NLY)
Historical Stock Chart
From Aug 2024 to Sep 2024

Annaly Capital Management (NYSE:NLY)
Historical Stock Chart
From Sep 2023 to Sep 2024
