ETFs Race to Fastest Yearly Start Ever Based on Inflows, BlackRock Data Show
March 02 2017 - 7:34PM
Dow Jones News
By Asjylyn Loder
Investors poured $62.9 billion into exchange-traded funds in
February, pushing the year-to-date world-wide tally to $124
billion, the fastest start of any year in the history of the ETF
industry, according to data from BlackRock Inc.
U.S. ETFs accounted for $44 billion of that, pushing assets in
U.S. funds to almost $2.8 trillion.
Most of the money went to cheap, index-tracking ETFs, a sign
that the price war in ETFs isn't over yet. BlackRock's iShares ETFs
were the biggest winner, and its low-cost Core series garnered the
bulk of the $38 billion global haul.
"All of the money is going into the cheapest and most boring
ETFs. This is the retail investor getting back into the market with
a vengeance," said Dave Nadig, chief executive of ETF.com, an
industry website owned by Bats Global Markets, newly a subsidiary
of CBOE Holdings Inc.
The fastest-growing ETF so far this year is the iShares Core
Emerging Markets ETF, which took in $4.2 billion in the first two
months of the year, 18% of its assets, according to FactSet. Three
other Core ETFs that invest in U.S. stocks were also among the top
gainers last month.
Investment advisers are increasingly focused on low-cost
investments amid an industrywide shift to fee-based financial
advice, where advisers are paid by clients instead of commissions
on fund sales. BlackRock cut fees on its Core funds in October. The
shift has put pressure on asset managers to cut fees, and has cut
into their bottom line.
"The proliferation of passive management continued to pressure
both flows and effective fee rates, offsetting the positive impact
of higher markets," according to a Moody's Investors Service report
on Tuesday.
Asset managers need to gather more assets to offset the impact
of lower fees, something BlackRock has successfully done. Assets in
BlackRock ETFs surpassed $1 trillion in January.
"You can still grow revenue organically," said Martin Small,
head of U.S. iShares. "You just need to gather assets."
Write to Asjylyn Loder at asjylyn.loder@wsj.com
(END) Dow Jones Newswires
March 02, 2017 19:19 ET (00:19 GMT)
Copyright (c) 2017 Dow Jones & Company, Inc.
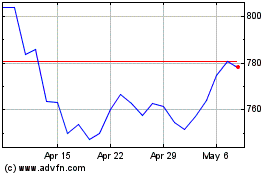
BlackRock (NYSE:BLK)
Historical Stock Chart
From Mar 2024 to Apr 2024

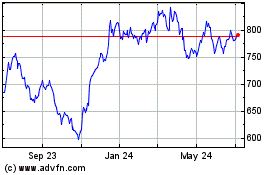
BlackRock (NYSE:BLK)
Historical Stock Chart
From Apr 2023 to Apr 2024
