UNITED STATES
SECURITIES AND EXCHANGE COMMISSION
Washington, D.C. 20549
______________
Form 8-K
Current Report
______________
Pursuant to Section 13 or 15(d)
of the Securities Exchange Act of
1934
January 21, 2016
Date of Report (Date of earliest
event reported)
BB&T Corporation
(Exact name of registrant as specified in its
charter)
Commission file number : 1-10853
______________
| North Carolina |
56-0939887 |
| (State of incorporation) |
(I.R.S. Employer Identification No.) |
| 200 West Second Street |
|
| Winston-Salem, North Carolina |
27101 |
| (Address of principal executive offices) |
(Zip Code) |
(336) 733-2000
(Registrant's telephone number, including area
code)
______________
Check the appropriate box below if the Form 8-K filing
is intended to simultaneously satisfy the filing obligation of the registrant under any of the following provisions:
[ ] Written communications pursuant to Rule 425 under
the Securities Act (17 CFR 230.425)
[ ] Soliciting material pursuant to Rule 14a-12 under
the Exchange Act (17 CFR 240.14a-12)
[ ] Pre-commencement communications pursuant to Rule
14d-2(b) under the Exchange Act (17 CFR 240.14d-2(b))
[ ] Pre-commencement communications pursuant to Rule 13e-4(c) under
the Exchange Act (17 CFR 240.13e-4(c))
| ITEM 2.02 |
Results of Operations and Financial Condition |
On January 21, 2016, BB&T Corporation issued a press release reporting fourth quarter 2015 results and posted
on its website its fourth quarter 2015 Earnings Release, Quarterly Performance Summary and Earnings Release Presentation. The release
contains forward-looking statements regarding BB&T and includes a cautionary statement identifying important factors that could
cause actual results to differ materially from those anticipated. The Earnings Release, Quarterly Performance Summary and Earnings
Release Presentation are furnished as Exhibits 99.1, 99.2 and 99.3, respectively.
| ITEM 9.01 |
Financial Statements and Exhibits |
| |
|
| Exhibit No. |
Description of Exhibit |
| |
|
| 99.1 |
BB&T Corporation's Earnings Release
issued January 21, 2016. |
| |
|
| 99.2 |
BB&T Corporation's Quarterly Performance Summary issued January 21, 2016. |
| |
|
| 99.3 |
BB&T Corporation's Earnings Release Presentation issued January 21, 2016. |
S I G N A T U R E
Pursuant to the
requirements of the Securities Exchange Act of 1934, the registrant has duly caused this report to be signed on its behalf by the
undersigned hereunto duly authorized.
| |
BB&T CORPORATION |
| |
(Registrant) |
| |
|
| |
By: /s/ Cynthia B. Powell |
| |
|
| |
Cynthia B. Powell |
| |
Executive Vice President and Corporate Controller |
| |
(Principal Accounting Officer) |
Date: January 21, 2016
Exhibit 99.1
January 21, 2016
FOR IMMEDIATE RELEASE
| Contacts: | |
| |
|
| ANALYSTS | |
| |
MEDIA |
| Alan Greer | |
Tamera Gjesdal | |
Cynthia A. Williams |
| Executive Vice President | |
Senior Vice President | |
Senior Executive Vice President |
| Investor Relations | |
Investor Relations | |
Corporate Communications |
| (336) 733-3021 | |
(336) 733-3058 | |
(336) 733-1470 |
BB&T reports revenue up 6.9% following
acquisitions
Diluted EPS of $0.64
($0.68 adjusted)
WINSTON-SALEM, N.C. -- BB&T Corporation (NYSE: BBT) today reported
quarterly earnings for the fourth quarter of 2015. Net income available to common shareholders was $502 million, or $0.64 per diluted
common share for the fourth quarter of 2015. Excluding merger-related and restructuring charges, net income available to common
shareholders was $535 million, or $0.68 per diluted share.
Net income available to common shareholders was $492 million ($0.64
per diluted share) and $551 million ($0.75 per diluted share) for the third quarter of 2015 and fourth quarter of 2014, respectively.
“We are pleased to report solid results for the quarter, driven
by strong net interest income following our acquisition of Susquehanna Bancshares during the third quarter,” said Chairman
and Chief Executive Officer Kelly S. King. “Our fee income remained steady and our net interest income was up more than 12%
from the fourth quarter of last year.
“Revenues were $2.6 billion, up $164 million compared to the
fourth quarter of 2014, reflecting our strategic acquisitions during the year. Revenues for the year were $9.8 billion, up 4% over
2014, led by record fee income of $4.0 billion,” said King. “With a strong balance sheet and cost reductions from acquisitions,
I am looking forward to our continued success during 2016.
“After the successful conversion of Susquehanna’s systems
in the fourth quarter, we were pleased to receive approval from our federal and state banking regulators for our acquisition of
National Penn, which is expected to close April 1st and significantly expand our presence in the mid-Atlantic region,” said
King.
Fourth Quarter 2015 Performance Highlights
| · | Taxable equivalent revenues were $2.6 billion for the fourth quarter, up $68 million from the third quarter of 2015 |
| o | Net interest income was up $41 million, primarily driven by a full quarter of Susquehanna activity |
| o | Net interest margin was 3.35%, flat compared to the prior quarter |
| o | Noninterest income was up $27 million primarily due to insurance income |
| o | Fee income ratio was 41.8%, compared to 42.1% for the prior quarter |
| · | Noninterest expense was $1.6 billion, essentially flat compared to the third quarter |
| o | Personnel expense and occupancy and equipment expense increased primarily due to the full quarter impact of Susquehanna’s
operations |
| o | Merger-related and restructuring charges were $27 million lower as Susquehanna related charges declined |
| o | The adjusted efficiency ratio was 58.8%, down from 59.2% in the prior quarter |
| · | Average loans and leases held for investment increased $4.3 billion compared to the third quarter of 2015; annualized growth
of approximately 2.0% excluding acquisitions |
| o | Average C&I loans increased 13.5% annualized; or 7.8% excluding acquisitions |
| o | Average direct retail loans increased 38.8% annualized; or 11.2% excluding acquisitions |
| o | Average other lending subsidiaries loans increased 13.7% annualized; or 7.3% excluding acquisitions |
| · | Average deposits increased $4.7 billion compared to the prior quarter |
| o | Average noninterest-bearing deposits increased an annualized 15.0%; or 7.5% excluding acquisitions |
| o | Average interest-bearing deposit costs were 0.24%, flat compared to the prior quarter |
| o | Deposit mix remained strong, with average noninterest-bearing deposits representing 30.9% of total deposits, compared to 30.7%
in the prior quarter |
| · | Asset quality remained strong |
| o | Nonperforming assets decreased $32 million during the quarter |
| o | Loans 90 days or more past due and still accruing were 0.23% of loans held for investment, compared to 0.28% in the prior quarter |
| o | Loans 30-89 days past due and still accruing were 0.76% of loans held for investment, compared to 0.67% in the prior quarter |
| o | The allowance for loan and lease losses was 1.07% of loans held for investment, compared to 1.08% in the prior quarter |
| o | The allowance for loan loss coverage ratio was 2.53 times nonperforming loans held for investment, versus 2.49 times in the
prior quarter |
| · | Capital levels remained strong across the board |
| o | Common equity tier 1 to risk-weighted assets was 10.2%, or 10.0% on a fully phased-in basis |
| o | Tier 1 risk-based capital was 11.8% |
| o | Leverage capital was 9.8% |
| o | Tangible common equity to tangible assets was 7.7% |
| EARNINGS HIGHLIGHTS |
|
|
|
|
|
|
|
|
|
Change |
|
Change |
| (dollars in millions, except per share data) |
Q4 |
|
Q3 |
|
Q4 |
|
Q4 15 vs. |
|
Q4 15 vs. |
| |
|
|
2015 |
|
2015 |
|
2014 (2) |
|
Q3 15 |
|
Q4 14 |
| Net income available to common shareholders |
$ |
502 |
|
$ |
492 |
|
$ |
551 |
|
$ |
10 |
|
$ |
(49) |
| Diluted earnings per common share |
|
0.64 |
|
|
0.64 |
|
|
0.75 |
|
|
― |
|
|
(0.11) |
| |
|
|
|
|
|
|
|
|
|
|
|
|
|
|
|
|
| Net interest income - taxable equivalent |
$ |
1,542 |
|
$ |
1,501 |
|
$ |
1,371 |
|
$ |
41 |
|
$ |
171 |
| Noninterest income |
|
1,015 |
|
|
988 |
|
|
1,022 |
|
|
27 |
|
|
(7) |
| |
Total revenue |
$ |
2,557 |
|
$ |
2,489 |
|
$ |
2,393 |
|
$ |
68 |
|
$ |
164 |
| |
|
|
|
|
|
|
|
|
|
|
|
|
|
|
|
|
| Return on average assets (%) |
|
1.03 |
|
|
1.04 |
|
|
1.28 |
|
|
(0.01) |
|
|
(0.25) |
| Return on average risk-weighted assets (%) |
|
1.29 |
|
|
1.32 |
|
|
1.68 |
|
|
(0.03) |
|
|
(0.39) |
| Return on average common shareholders' equity (%) |
|
8.06 |
|
|
8.14 |
|
|
9.99 |
|
|
(0.08) |
|
|
(1.93) |
| Return on average tangible common shareholders' |
|
|
|
|
|
|
|
|
|
|
|
|
|
|
| |
equity (1) (%) |
|
13.37 |
|
|
13.23 |
|
|
15.45 |
|
|
0.14 |
|
|
(2.08) |
| Net interest margin - taxable equivalent (%) |
|
3.35 |
|
|
3.35 |
|
|
3.36 |
|
|
― |
|
|
(0.01) |
| Efficiency ratio (1) (%) |
|
58.8 |
|
|
59.2 |
|
|
55.6 |
|
|
(0.4) |
|
|
3.2 |
| (1) | Excludes certain items as detailed in the non-GAAP reconciliations in the Quarterly Performance Summary. |
| (2) | Applicable Q4 2014 amounts were revised as a result of the January 1, 2015 adoption of new guidance related to the accounting
for investments in qualified affordable housing projects. |
Fourth Quarter 2015 compared to Third Quarter 2015
Total revenues were $2.6 billion for the fourth quarter of 2015,
an increase of $68 million compared to the prior quarter, which reflects an increase in taxable-equivalent net interest income
of $41 million and an increase in noninterest income of $27 million.
The net interest margin was 3.35% for the fourth quarter, flat compared
to the prior quarter. Average earning assets increased $4.7 billion and average interest-bearing liabilities increased $3.0 billion,
which primarily reflect the inclusion of Susquehanna’s operations for a full quarter.
The annualized yield on the total loan portfolio for the fourth
quarter was 4.31%, flat compared to the prior quarter. The annualized fully taxable-equivalent yield on the average securities
portfolio for the fourth quarter was 2.30%, up three basis points compared to the prior quarter.
The average annualized cost of interest-bearing deposits was 0.24%,
flat compared to the prior quarter. The average annualized rate paid on long-term debt was 2.11%, a decrease of one basis point
compared to the prior quarter.
Excluding acquired from FDIC and purchased credit impaired (“PCI”)
loans, the provision for credit losses was $128 million and net charge-offs were $130 million for the fourth quarter, compared
to $100 million and $107 million, respectively, for the prior quarter. The current quarter included net charge-offs of $7 million
related to the sale of approximately $50 million of nonperforming residential mortgage loans.
Noninterest income increased $27 million, primarily driven by higher
insurance income and other income, partially offset by lower investment banking and brokerage fees and commissions.
Noninterest expense was $1.6 billion for the fourth quarter, essentially
flat compared to the prior quarter. Higher personnel expense, occupancy and equipment expense and other expense were partially
offset by lower merger-related and restructuring charges and lower professional services.
The provision for income taxes was $251 million for the fourth quarter,
compared to $222 million for the prior quarter. This produced an effective tax rate for the fourth quarter of 31.7%, compared to
29.4% for the prior quarter. The increase is primarily attributable to a reduction in federal tax credits and higher pre-tax income.
Fourth Quarter 2015 compared to Fourth Quarter 2014
Total revenues were $2.6 billion for the fourth quarter of 2015,
up $164 million compared to the earlier quarter. This increase was driven by a $171 million increase in taxable-equivalent net
interest income, largely the result of the Susquehanna and The Bank of Kentucky acquisitions.
Net interest margin was 3.35%, compared to 3.36% for the earlier
quarter. Average earning assets increased $20.6 billion, or 12.7%, while average interest-bearing liabilities increased $13.3 billion,
or 11.4%, both of which were primarily driven by the Susquehanna and The Bank of Kentucky acquisitions. The annualized yield on
the total loan portfolio for the fourth quarter was 4.31%, an increase of two basis points compared to the earlier quarter, which
primarily reflects the impact of the current year acquisitions, partially offset by runoff of loans acquired from the FDIC. The
annualized fully taxable-equivalent yield on the average securities portfolio for the fourth quarter was 2.30%, compared to 2.45%
for the earlier period. This decline reflects lower rates on mortgage-backed securities, runoff of securities acquired from the
FDIC and larger holdings in U.S. Treasuries.
The average annualized cost of interest-bearing deposits was 0.24%,
a decline of one basis point compared to the earlier quarter. The average annualized rate paid on long-term debt was 2.11%, compared
to 2.22% for the earlier quarter. This decrease was primarily due to early extinguishments of higher cost FHLB advances.
Excluding acquired from FDIC and PCI loans, the provision for credit
losses was $128 million, compared to $84 million in the earlier quarter. The earlier quarter included a $24 million allowance release
related to the sale of nonperforming mortgage loans, which also resulted in $4 million of net recoveries. Net charge-offs for the
fourth quarter of 2015, excluding loans acquired from the FDIC and PCI, totaled $130 million, compared to $102 million for the
earlier quarter.
The $7 million decrease in noninterest income was driven by lower
insurance income, mortgage banking income and investment banking and brokerage fees and commissions, partially offset by improved
FDIC loss share income and higher other income.
Noninterest expense was $1.6 billion for the fourth quarter of 2015,
an increase of $203 million compared to the earlier quarter. This increase was primarily driven by the Susquehanna and The Bank
of Kentucky acquisitions, which resulted in higher personnel expense, occupancy and equipment expense, merger-related and restructuring
charges and other expense. These increases were partially offset by a decrease in loan-related expense.
The provision for income taxes was $251 million for the fourth quarter
of 2015, compared to $277 million for the earlier quarter. This produced an effective tax rate for the fourth quarter of 2015 of
31.7%, compared to 31.5% for the earlier quarter.
| NONINTEREST INCOME |
|
|
|
|
|
|
|
|
|
% Change |
|
% Change |
| (dollars in millions) |
Q4 |
|
Q3 |
|
Q4 |
|
Q4 15 vs. |
|
Q4 15 vs. |
| |
|
|
2015 |
|
2015 |
|
2014 |
|
Q3 15 |
|
Q4 14 |
| |
|
|
|
|
|
|
|
|
|
|
|
(annualized) |
|
|
|
| Insurance income |
$ |
380 |
|
$ |
354 |
|
$ |
409 |
|
|
29.1 |
|
|
(7.1) |
| Service charges on deposits |
|
165 |
|
|
167 |
|
|
160 |
|
|
(4.8) |
|
|
3.1 |
| Mortgage banking income |
|
104 |
|
|
111 |
|
|
128 |
|
|
(25.0) |
|
|
(18.8) |
| Investment banking and brokerage fees and |
|
|
|
|
|
|
|
|
|
|
|
|
|
|
| |
commissions |
|
91 |
|
|
105 |
|
|
112 |
|
|
(52.9) |
|
|
(18.8) |
| Trust and investment advisory revenues |
|
64 |
|
|
63 |
|
|
56 |
|
|
6.3 |
|
|
14.3 |
| Bankcard fees and merchant discounts |
|
56 |
|
|
57 |
|
|
52 |
|
|
(7.0) |
|
|
7.7 |
| Checkcard fees |
|
47 |
|
|
45 |
|
|
41 |
|
|
17.6 |
|
|
14.6 |
| Operating lease income |
|
33 |
|
|
32 |
|
|
29 |
|
|
12.4 |
|
|
13.8 |
| Income from bank-owned life insurance |
|
27 |
|
|
29 |
|
|
30 |
|
|
(27.4) |
|
|
(10.0) |
| FDIC loss share income, net |
|
(52) |
|
|
(58) |
|
|
(84) |
|
|
(41.0) |
|
|
(38.1) |
| Securities gains (losses), net |
|
― |
|
|
(2) |
|
|
― |
|
|
NM |
|
|
NM |
| Other income (1) |
|
100 |
|
|
85 |
|
|
89 |
|
|
70.0 |
|
|
12.4 |
| |
Total noninterest income |
$ |
1,015 |
|
$ |
988 |
|
$ |
1,022 |
|
|
10.8 |
|
|
(0.7) |
| |
|
|
|
|
|
|
|
|
|
|
|
|
|
|
|
|
| (1) |
The Q4 2014 amount was revised as a result of the January 1, 2015 adoption of new guidance related to the accounting for investments in qualified affordable housing projects. |
| NM - not meaningful. |
Fourth Quarter 2015 compared to Third Quarter 2015
Noninterest income was $1.0 billion for the fourth quarter, an increase
of $27 million compared to the prior quarter. This increase was driven by higher insurance income and other income, partially offset
by lower investment banking and brokerage fees and commissions.
Insurance income increased $26 million, primarily due to seasonality.
Other income increased $15 million, primarily due to a $25 million increase in income related to assets for certain post-employment
benefits, which is offset in personnel expense. The increase in other income also reflects a $12 million improvement in client
derivative income. These increases were partially offset by a decrease of $20 million in partnership and other investment income,
which was the result of an opportunistic sale that resulted in a $28 million gain in the prior quarter.
Investment banking and brokerage fees and commissions were $14 million
lower due to higher capital markets activity in the prior quarter.
Fourth Quarter 2015 compared to Fourth Quarter 2014
Noninterest income for the fourth quarter of 2015 decreased $7 million
compared to the earlier quarter. This decrease was driven by lower insurance income, mortgage banking income and investment banking
and brokerage fees and commissions, partially offset by improved FDIC loss share income and an increase in other income.
Insurance income declined $29 million primarily due to the second
quarter sale of American Coastal, which resulted in a $36 million reduction in revenue, partially offset by higher commission income
in the property and casualty insurance business.
Mortgage banking income declined $24 million, driven by $11 million
of lower mortgage servicing rights valuation adjustments and lower saleable loan volume.
Investment banking and brokerage fees and commissions declined $21
million, primarily due to higher capital markets activity occurring in the earlier quarter.
FDIC loss share income improved $32 million primarily due to lower
loan accretion. Other income increased $11 million primarily due to higher income from client derivatives and higher income related
to assets for certain post-employment benefits (which is offset in personnel expense), partially offset by lower partnerships and
investment income.
| NONINTEREST EXPENSE |
|
|
|
|
|
|
|
|
|
% Change |
|
% Change |
| (dollars in millions) |
Q4 |
|
Q3 |
|
Q4 |
|
Q4 15 vs. |
|
Q4 15 vs. |
| |
|
2015 |
|
2015 |
|
2014 |
|
Q3 15 |
|
Q4 14 |
| |
|
|
|
|
|
|
|
|
|
|
(annualized) |
|
|
|
| Personnel expense |
$ |
893 |
|
$ |
882 |
|
$ |
794 |
|
|
4.9 |
|
|
12.5 |
| Occupancy and equipment expense |
|
192 |
|
|
183 |
|
|
168 |
|
|
19.5 |
|
|
14.3 |
| Software expense |
|
52 |
|
|
50 |
|
|
45 |
|
|
15.9 |
|
|
15.6 |
| Loan-related expense |
|
37 |
|
|
38 |
|
|
71 |
|
|
(10.4) |
|
|
(47.9) |
| Outside IT services |
|
41 |
|
|
35 |
|
|
27 |
|
|
68.0 |
|
|
51.9 |
| Professional services |
|
29 |
|
|
42 |
|
|
38 |
|
|
(122.8) |
|
|
(23.7) |
| Amortization of intangibles |
|
32 |
|
|
29 |
|
|
22 |
|
|
41.0 |
|
|
45.5 |
| Regulatory charges |
|
28 |
|
|
25 |
|
|
24 |
|
|
47.6 |
|
|
16.7 |
| Foreclosed property expense |
|
11 |
|
|
15 |
|
|
10 |
|
|
(105.8) |
|
|
10.0 |
| Merger-related and restructuring charges, net |
|
50 |
|
|
77 |
|
|
18 |
|
|
(139.1) |
|
|
177.8 |
| Other expense |
|
232 |
|
|
218 |
|
|
177 |
|
|
25.5 |
|
|
31.1 |
| |
Total noninterest expense |
$ |
1,597 |
|
$ |
1,594 |
|
$ |
1,394 |
|
|
0.7 |
|
|
14.6 |
| |
|
|
|
|
|
|
|
|
|
|
|
|
|
|
|
| NM - not meaningful. |
Fourth Quarter 2015 compared to Third Quarter 2015
Noninterest expense was $1.6 billion for the fourth quarter, up
$3 million compared to the prior quarter. This change was driven by increases in other expense and personnel expense, as well as
smaller increases in various other categories, partially offset by lower merger-related and restructuring charges and a decrease
in professional services.
Other expense increased $14 million primarily reflecting higher
operating charge-offs, charitable contributions and travel.
Personnel expense increased $11 million, driven by $14 million of
higher salary expense due to a full quarter of increased headcount resulting from the Susquehanna acquisition. The higher personnel
expense also reflects a $25 million increase in certain post-employment benefits expense (offset in other income). These increases
were partially offset by an $18 million improvement in employee medical and insurance benefits and a $12 million reduction in equity-based
compensation due to the acceleration of expense for retirement eligible employees in the prior quarter.
Merger-related and restructuring charges declined by $27 million,
primarily due to the impact of the Susquehanna acquisition in the prior quarter. Professional services declined $13 million due
to lower volume.
Fourth Quarter 2015 compared to Fourth Quarter 2014
Noninterest expense for the fourth quarter of 2015 was $1.6 billion,
an increase of $203 million compared to the fourth quarter of 2014. This increase reflects higher expense in a number of categories
primarily resulting from acquisition activity, partially offset by a reduction in loan-related expense.
Personnel expense increased $99 million, driven by a $72 million
increase in salaries, which reflects an increase in FTEs of approximately 3,800 primarily resulting from the current year acquisitions.
Employee benefits expense increased $35 million, primarily due to $19 million of higher pension expense due to changes in actuarial
assumptions as well as $9 million of higher expense related to certain post-employment benefits (offset in other income). These
increases in personnel expense were partially offset by a $13 million reduction in incentives.
Other expense increased $55 million primarily due to a $15 million
franchise tax benefit recognized in the earlier quarter and increases in various categories of other expense including taxes and
licenses, depreciation on assets subject to operating leases, outsourced services, marketing and advertising. These increases and
other smaller increases were partially offset by a reduction in business referral fee expense primarily due to the sale of American
Coastal.
Merger-related and restructuring charges increased $32 million,
primarily due to the Susquehanna acquisition and expenses related to the planned acquisition of National Penn.
Outside IT services increased $14 million due to ongoing information
system enhancement projects and initiatives. Occupancy and equipment expense and amortization of intangibles both increased as
a result of the current year acquisitions.
Loan-related expense decreased $34 million largely due to a $27
million charge in the earlier quarter related to a review of mortgage lending processes.
| LOANS AND LEASES - average balances |
|
|
% Change |
|
% Change |
| (dollars in millions) |
Q4 |
|
Q3 |
|
Q4 |
|
Q4 15 vs. |
|
Q4 15 vs. |
| |
|
|
2015 |
|
2015 |
|
2014 |
|
Q3 15 |
|
Q4 14 |
| |
|
|
|
|
|
|
|
|
|
|
|
(annualized) |
|
|
| Commercial and industrial |
$ |
48,047 |
|
$ |
46,462 |
|
$ |
40,383 |
|
13.5 |
|
19.0 |
| CRE - income producing properties |
|
13,264 |
|
|
12,514 |
|
|
10,681 |
|
23.8 |
|
24.2 |
| CRE - construction and development |
|
3,766 |
|
|
3,502 |
|
|
2,772 |
|
29.9 |
|
35.9 |
| Dealer floor plan |
|
1,164 |
|
|
1,056 |
|
|
1,053 |
|
40.6 |
|
10.5 |
| Direct retail lending |
|
10,896 |
|
|
9,926 |
|
|
8,085 |
|
38.8 |
|
34.8 |
| Sales finance |
|
10,533 |
|
|
10,386 |
|
|
9,194 |
|
5.6 |
|
14.6 |
| Revolving credit |
|
2,458 |
|
|
2,421 |
|
|
2,427 |
|
6.1 |
|
1.3 |
| Residential mortgage |
|
30,334 |
|
|
30,384 |
|
|
31,046 |
|
(0.7) |
|
(2.3) |
| Other lending subsidiaries |
|
13,281 |
|
|
12,837 |
|
|
11,351 |
|
13.7 |
|
17.0 |
| Acquired from FDIC and PCI |
|
1,070 |
|
|
1,052 |
|
|
1,309 |
|
6.8 |
|
(18.3) |
| |
Total loans and leases held for investment |
$ |
134,813 |
|
$ |
130,540 |
|
$ |
118,301 |
|
13.0 |
|
14.0 |
Average loans held for investment for the fourth quarter of 2015
were $134.8 billion, up $4.3 billion compared to the third quarter of 2015. Excluding acquisitions (which comprises Susquehanna,
The Bank of Kentucky, both branch acquisitions in Texas and BankAtlantic), average loans held for investment were up approximately
2.0% on an annualized basis.
Average commercial and industrial loans increased $1.6 billion during
the fourth quarter of 2015. Approximately $740 million of the increase was the result of acquisitions while the remaining increase
reflects continued growth in large corporate lending. Average commercial real estate – income producing properties loans
increased $750 million and average commercial real estate – construction and development loans increased $264 million, with
the majority of both of these increases being attributable to acquisitions. Dealer floor plan average loans, which were not significantly
impacted by acquisition activity, were up $108 million or 40.6% annualized, due to strong organic growth.
Direct retail lending average loans increased $970 million; approximately
$735 million of the growth was due to acquisitions. Other lending subsidiaries average loans increased $444 million, with approximately
half of the increase due to acquisitions.
Excluding acquisition activity, average sales finance loans declined
approximately $400 million, which is partially due to dealer pricing structure changes implemented during the third quarter. Average
residential mortgage loans decreased approximately $430 million excluding acquisitions, which reflects the continued strategy to
sell conforming residential mortgage loan production.
| DEPOSITS - average balances |
|
|
|
|
|
|
|
|
|
% Change |
|
% Change |
| (dollars in millions) |
Q4 |
|
Q3 |
|
Q4 |
|
Q4 15 vs. |
|
Q4 15 vs. |
| |
|
2015 |
|
2015 |
|
2014 |
|
Q3 15 |
|
Q4 14 |
| |
|
|
|
|
|
|
|
|
|
(annualized) |
|
|
|
| Noninterest-bearing deposits |
$ |
45,824 |
|
$ |
44,153 |
|
$ |
39,130 |
|
|
15.0 |
|
|
17.1 |
| Interest checking |
|
24,157 |
|
|
22,593 |
|
|
19,308 |
|
|
27.5 |
|
|
25.1 |
| Money market and savings |
|
61,431 |
|
|
59,306 |
|
|
51,176 |
|
|
14.2 |
|
|
20.0 |
| Time deposits |
|
16,981 |
|
|
16,837 |
|
|
20,041 |
|
|
3.4 |
|
|
(15.3) |
| Foreign office deposits - interest-bearing |
|
98 |
|
|
948 |
|
|
660 |
|
|
NM |
|
|
(85.2) |
| |
Total deposits |
$ |
148,491 |
|
$ |
143,837 |
|
$ |
130,315 |
|
|
12.8 |
|
|
13.9 |
Average deposits for the fourth quarter were $148.5 billion, an
increase of $4.7 billion compared to the prior quarter. Average noninterest-bearing deposits increased $1.7 billion, with approximately
$870 million of the increase due to acquisitions. Interest checking grew $1.6 billion (approximately $220 million excluding acquisitions)
and money market and savings grew $2.1 billion (approximately $535 million excluding acquisitions. Excluding acquisition activity,
time deposits declined approximately $650 million, or an annualized 18.5%.
The growth in noninterest-bearing deposits and lower-cost deposits
drove continued improvement in mix during the quarter. Noninterest-bearing deposits represented 30.9% of total average deposits
for the fourth quarter, compared to 30.7% for the prior quarter and 30.0% a year ago.
The cost of interest-bearing deposits was 0.24% for the fourth quarter,
flat compared to the prior quarter.
| SEGMENT RESULTS |
|
|
|
|
|
|
|
|
|
|
Change |
|
Change |
| (dollars in millions) |
|
Q4 |
|
Q3 |
|
Q4 |
|
Q4 15 vs. |
|
Q4 15 vs. |
| Segment Net Income |
|
2015 |
|
2015 |
|
2014 |
|
Q3 15 |
|
Q4 14 |
| Community Banking |
|
$ |
272 |
|
$ |
263 |
|
$ |
250 |
|
$ |
9 |
|
$ |
22 |
| Residential Mortgage Banking |
|
|
49 |
|
|
59 |
|
|
82 |
|
|
(10) |
|
|
(33) |
| Dealer Financial Services |
|
|
42 |
|
|
44 |
|
|
34 |
|
|
(2) |
|
|
8 |
| Specialized Lending |
|
|
71 |
|
|
69 |
|
|
65 |
|
|
2 |
|
|
6 |
| Insurance Services |
|
|
36 |
|
|
21 |
|
|
65 |
|
|
15 |
|
|
(29) |
| Financial Services |
|
|
103 |
|
|
82 |
|
|
79 |
|
|
21 |
|
|
24 |
| Other, Treasury and Corporate |
|
|
(31) |
|
|
(5) |
|
|
28 |
|
|
(26) |
|
|
(59) |
| |
Total net income |
|
$ |
542 |
|
$ |
533 |
|
$ |
603 |
|
$ |
9 |
|
$ |
(61) |
| |
|
|
|
|
|
|
|
|
|
|
|
|
|
|
|
|
Fourth Quarter 2015 compared to Third Quarter 2015
The financial information related to Susquehanna’s operations was
included in the Other, Treasury & Corporate segment until the systems conversion, which occurred during the fourth quarter
of 2015.
Community Banking
Community Banking serves individual and business clients by offering a
variety of loan and deposit products and other financial services. The segment is primarily responsible for acquiring and maintaining
client relationships.
Community Banking net income was $272 million for the fourth quarter of
2015, an increase of $9 million compared to the prior quarter. The higher net income reflects the inclusion of Susquehanna’s
operations in segment results for approximately half the quarter due to the November systems conversion. Segment net interest income
increased $83 million, driven by the inclusion of Susquehanna since conversion and higher funding spreads on deposits, partially
offset by lower interest rates on new commercial loans. Noninterest income decreased $3 million, primarily due to lower checkcard
fees and letter of credit fees, partially offset by higher service charges on deposits and commercial loan fees. The allocated
provision for credit losses increased $35 million primarily as a result of higher loss estimates. Noninterest expense increased
$22 million driven by higher salary and employee insurance expense, primarily attributable to the Susquehanna acquisition, and
higher operating charge-offs, partially offset by lower legal expense.
Average loans grew $5.8 billion, or 44.4% on an annualized basis and average
transaction account deposits grew $4.8 billion, or 33.3% on an annualized basis, primarily attributable to the Susquehanna acquisition.
Residential Mortgage Banking
Residential Mortgage Banking retains and services mortgage loans originated
by BB&T as well as those purchased from various correspondent originators. Mortgage loan products include fixed and adjustable-rate
government guaranteed and conventional loans for the purpose of constructing, purchasing or refinancing residential properties.
Substantially all of the properties are owner-occupied.
Residential Mortgage Banking net income was $49 million for the fourth
quarter of 2015, a decrease of $10 million compared to the prior quarter. This decrease was primarily the result of a $14 million
decline in noninterest income, which was driven by lower gains on mortgage loan production as a result of lower saleable production
volumes and margins. Noninterest expense decreased by $6 million, which primarily reflects lower incentive, professional services
and loan processing expense.
Dealer Financial Services
Dealer Financial Services originates loans to consumers for the purchase
of automobiles. These loans are originated on an indirect basis through approved franchised and independent automobile dealers
throughout BB&T's market area through BB&T Dealer Finance, and on a national basis through Regional Acceptance Corporation.
Dealer Financial Services also originates loans for the purchase of recreational and marine vehicles and, in conjunction with the
Community Bank, provides financing and servicing to dealers for their inventories. The consumer auto leasing portfolio was moved
to the Dealer Financial Services segment from the Other, Treasury, and Corporate segment in connection with the systems conversion
during November.
Dealer Financial Services net income was $42 million for the fourth quarter
of 2015, a decrease of $2 million compared to the prior quarter. Segment net interest income increased $9 million, primarily due
to the consumer auto leasing business moving into the segment. The allocated provision for credit losses increased $11 million,
primarily due to seasonally higher net charge-offs in the Dealer Finance and Regional Acceptance loan portfolios.
Dealer Financial Services' average loans increased by $695 million, or
20.3%, on an annualized basis as a result of the Susquehanna acquisition, partially offset by lower average balances in the core
prime automobile loan portfolio.
Specialized Lending
Specialized Lending consists of businesses that provide specialty finance
alternatives to commercial and consumer clients including: commercial finance, mortgage warehouse lending, tax-exempt financing
for local governments and special-purpose districts, equipment leasing, full-service commercial mortgage banking, commercial and
retail insurance premium finance, and dealer-based financing of equipment for consumers and small businesses. The small business
equipment finance business unit, a former subsidiary of Susquehanna Bancshares, was moved to the Specialized Lending segment from
the Other, Treasury, and Corporate segment in connection with the systems conversion during November.
Specialized Lending net income was $71 million for the fourth quarter
of 2015, an increase of $2 million compared to the prior quarter. Noninterest income increased $13 million driven by higher commercial
mortgage income and operating lease income and higher gains on finance leases. Noninterest expense increased $8 million, primarily
due to higher incentive expense, higher depreciation of property under operating leases and lower recoveries of operating charge-offs
compared to the prior quarter.
Specialized Lending average loans were up $99 million, or 2.2% on an annualized
basis, primarily due to the Susquehanna acquisition, partially offset by mortgage warehouse lending.
Insurance Services
BB&T's insurance agency / brokerage network is the fifth largest in
the United States and sixth largest in the world. Insurance Services provides property and casualty, life and health insurance
to businesses and individual clients. It also provides small business and corporate products, such as workers compensation and
professional liability, as well as surety coverage and title insurance.
Insurance Services net income was $36 million in the fourth quarter of
2015, an increase of $15 million compared to the prior quarter. Insurance Service's noninterest income increased $35 million, which
primarily reflects seasonality in the commercial property and casualty insurance business and higher life insurance commissions
as a result of seasonality and improved production. Noninterest expense increased $11 million driven by higher salary and incentive
expense, merger-related charges and operating charge-offs.
Financial Services
Financial Services provides personal trust administration, estate planning,
investment counseling, wealth management, asset management, employee benefits services, corporate banking and corporate trust services
to individuals, corporations, institutions, foundations and government entities. In addition, Financial Services offers clients
investment alternatives, including discount brokerage services, equities, fixed-rate and variable-rate annuities, mutual funds
and governmental and municipal bonds through BB&T Investment Services, Inc. The segment also includes BB&T Securities,
a full-service brokerage and investment banking firm, the Corporate Banking Division, which originates and services large corporate
relationships, syndicated lending relationships and client derivatives, and BB&T Capital Partners, which manages the company's
SBIC private equity investments. Various financial-related business units of Susquehanna moved into the Financial Services segment
on a post-merger basis, with the financial history prior to systems conversion remaining in the Other, Treasury and Corporate segment.
Financial Services net income was $103 million in the fourth quarter of
2015, an increase of $21 million compared to the prior quarter. Segment net interest income increased $10 million driven by Corporate
Banking and BB&T Wealth loan and deposit growth and higher funding spreads on deposits. Noninterest income decreased $16 million
primarily due to lower capital markets fees and lower income from SBIC private equity investments, partially offset by higher investment
advisory fees. The allocated provision for credit losses was a benefit of $3 million in the fourth quarter of 2015, compared to
a $21 million charge in the prior quarter as a result of lower loss estimates for the Corporate Banking loan portfolio as well
as changes in the portfolio mix and risk expectations related to the oil and energy sector in the prior quarter. Noninterest expense
decreased $9 million compared to the prior quarter, primarily driven by lower professional services expense.
Financial Services generated significant loan growth, with Corporate Banking's
average loan balances increasing $887 million, or an annualized 29.2%, over the prior quarter, while BB&T Wealth's average
loan balances increased $61 million, or 15.6% on an annualized basis. BB&T Wealth’s average transaction account deposits
grew $194 million, or 20.7% on an annualized basis.
Other, Treasury & Corporate
Net income in Other, Treasury & Corporate can vary due to the changing
needs of the Corporation, including the size of the investment portfolio, the need for wholesale funding and income received from
derivatives used to hedge the balance sheet.
In the fourth quarter of 2015, Other, Treasury & Corporate generated
a net loss of $31 million, compared to a net loss of $5 million in the prior quarter. Segment net interest income decreased $59
million driven primarily by an increase in long-term debt, lower funding spreads and the inclusion of Susquehanna in the segment
for a greater period in the prior quarter. Noninterest income increased $11 million, primarily due to improved FDIC loss share
income. Noninterest expense decreased $28 million, due to lower personnel expense primarily attributable to the post-conversion
move of the Susquehanna business units into the operating segments and lower merger-related charges, partially offset by higher
occupancy and equipment and IT professional services expense.
Fourth Quarter 2015 compared to Fourth Quarter 2014
Community Banking
Community Banking net income was $272 million for the fourth quarter of
2015, an increase of $22 million compared to the earlier quarter. Segment net interest income increased $125 million, driven by
higher commercial and retail loans and deposits, partially attributable to acquisitions, and higher funding spreads on deposits,
partially offset by lower interest rates on new commercial loans. Noninterest income increased $5 million, primarily due to higher
service charges on deposits, bankcard and merchant services fees and commercial loan fees. The allocated provision for credit losses
increased $19 million as a result of loan growth and higher loss estimates in the commercial loan portfolio. Noninterest expense
increased $67 million driven by higher personnel and occupancy and equipment expense and merger-related charges, primarily attributable
to the acquisitions.
Residential Mortgage Banking
Residential Mortgage Banking net income was $49 million for the fourth
quarter of 2015, a decrease of $33 million compared to the earlier quarter. Segment net interest income decreased $9 million primarily
resulting from lower average loan balances. Noninterest income decreased $22 million driven by lower net mortgage servicing rights
valuation adjustments and lower gains on mortgage loan production and sales as a result of lower saleable production volumes and
margins. The allocated provision for credit losses was $8 million in the fourth quarter of 2015, compared to a benefit of $38 million
in the earlier quarter. The earlier quarter included a $24 million allowance release related to a loan sale. Noninterest expense
decreased $27 million compared to the earlier quarter, which primarily reflects a charge related to a review of mortgage lending
processes in the earlier quarter.
Dealer Financial Services
Dealer Financial Services net income was $42 million for the fourth quarter
of 2015, an increase of $8 million compared to the earlier quarter. Segment net interest income increased $20 million, primarily
attributable to Susquehanna’s consumer auto leasing business and growth in the Regional Acceptance loan portfolio. Noninterest
expense increased $10 million driven by higher personnel and other expense, partially related to the acquired consumer auto leasing
business.
Specialized Lending
Specialized Lending net income was $71 million for the fourth quarter
of 2015, an increase of $6 million compared to the earlier quarter. Segment net interest income increased $18 million, primarily
attributable to Susquehanna’s small business equipment finance business and growth in the small ticket consumer finance portfolio,
partially offset by lower interest rates on new loans. Noninterest income increased $4 million driven by higher operating lease
income and higher gains on finance leases, partially offset by lower commercial mortgage income. Noninterest expense increased
$13 million, primarily due to higher personnel expense and higher depreciation of property under operating leases.
Insurance Services
Insurance Services net income was $36 million for the fourth quarter of
2015, a decrease of $29 million compared to the earlier quarter. Insurance Service’s noninterest income decreased $33 million,
primarily due to the sale of American Coastal in the second quarter of 2015. Noninterest expense increased $14 million driven by
higher salary and pension expense, merger-related charges and operating charge-offs as well as a reduction in certain actuarially-determined
loss reserves in the earlier period, partially offset by lower business referral expense attributable to the sale of American Coastal.
Financial Services
Financial Services net income was $103 million in the fourth quarter of
2015, an increase of $24 million compared to the earlier quarter. Segment net interest income increased $24 million driven by Corporate
Banking and BB&T Wealth loan and deposit growth and higher funding spreads on deposits. Noninterest income decreased $10 million
primarily due to lower capital market fees and lower income from SBIC private equity investments, partially offset by higher investment
advisory fees, trust income and brokerage commissions. The allocated provision for credit losses was $20 million lower than the
earlier quarter as a result of lower loss estimates in the Corporate Banking loan portfolio, partially offset by loan growth.
Other, Treasury & Corporate
In the fourth quarter of 2015, Other, Treasury & Corporate generated
a net loss of $31 million compared to net income of $28 million in the earlier quarter. Segment net interest income decreased $8
million driven primarily by lower funding spreads on deposits. Noninterest income increased $46 million, primarily due to improved
FDIC loss share income and higher service charges on deposits and checkcard fees primarily related to the inclusion of Susquehanna
in operating results until the systems conversion in early November. Noninterest expense increased $120 million, primarily due
to higher personnel and occupancy and equipment expense primarily related to Susquehanna, as well as higher IT professional services,
software expense, franchise taxes and merger-related charges. Amortization of intangibles increased $12 million primarily due to
core deposit intangible amortization related to 2015 acquisitions. Allocated corporate expense decreased by $11 million compared
to the earlier quarter, reflecting modest increases in corporate expense allocated to the operating segments.
| CAPITAL RATIOS (1) |
|
|
|
|
|
|
|
|
|
| |
|
|
Basel III |
|
Basel I |
| |
Q4 |
|
Q3 |
|
Q2 |
|
Q1 |
|
Q4 |
| |
2015 |
|
2015 |
|
2015 |
|
2015 |
|
2014 |
| Risk-based: |
|
|
|
|
|
|
|
|
|
| |
Common equity Tier 1 (%) |
10.2 |
|
10.1 |
|
10.4 |
|
10.5 |
|
N/A |
| |
Tier 1 (%) |
11.8 |
|
11.7 |
|
12.1 |
|
12.2 |
|
12.4 |
| |
Total (%) |
14.2 |
|
14.2 |
|
14.2 |
|
14.4 |
|
14.9 |
| Leverage (%) |
9.8 |
|
9.9 |
|
10.2 |
|
10.1 |
|
9.9 |
| Tangible common equity to tangible assets (%) (2) |
7.7 |
|
7.7 |
|
8.1 |
|
8.0 |
|
8.0 |
| |
|
|
|
|
|
|
|
|
|
|
|
| (1) | Current quarter regulatory capital ratios are preliminary. |
| (2) | Tangible common equity and related ratios are non-GAAP measures. See the calculations and management's reasons for using these
measures in the Capital Information – Five Quarter Trend of the Quarterly Performance Summary. |
Capital levels remained strong at December 31, 2015. BB&T declared
total common dividends of $0.27 during the fourth quarter of 2015, which resulted in a dividend payout ratio of 42.2%. Risk-based
capital ratios were up slightly compared to the prior quarter as earnings in excess of dividends was partially offset by higher
risk-weighted assets.
BB&T’s estimated common equity Tier 1 ratio under Basel
III, on a fully-phased in basis, was approximately 10.0% at December 31, 2015 and 9.9% at September 30, 2015.
BB&T’s liquidity coverage ratio was approximately 130%
at December 31, 2015, compared to the regulatory minimum of 90%. In addition, the liquid asset buffer, which is defined as high
quality unencumbered liquid assets as a percentage of total assets, was 13.5% at December 31, 2015.
| ASSET QUALITY (1) |
|
|
|
|
|
|
|
|
|
Change |
|
Change |
| (dollars in millions) |
Q4 |
|
Q3 |
|
Q4 |
|
Q4 15 vs. |
|
Q4 15 vs. |
| |
|
2015 |
|
2015 |
|
2014 |
|
Q3 15 |
|
Q4 14 |
| Total nonperforming assets |
$ |
712 |
|
$ |
744 |
|
$ |
782 |
|
$ |
(32) |
|
$ |
(70) |
| Total performing TDRs |
|
982 |
|
|
976 |
|
|
1,050 |
|
|
6 |
|
|
(68) |
| Total loans 90 days past due and still accruing (2) |
|
312 |
|
|
381 |
|
|
535 |
|
|
(69) |
|
|
(223) |
| Total loans 30-89 days past due |
|
1,028 |
|
|
906 |
|
|
896 |
|
|
122 |
|
|
132 |
| |
|
|
|
|
|
|
|
|
|
|
|
|
|
|
|
| Nonperforming loans and leases as a percentage of |
|
|
|
|
|
|
|
|
|
|
|
|
|
|
| |
loans and leases held for investment (%) |
|
0.42 |
|
|
0.43 |
|
|
0.51 |
|
|
(0.01) |
|
|
(0.09) |
| Nonperforming assets as a percentage of total assets (%) |
|
0.34 |
|
|
0.36 |
|
|
0.42 |
|
|
(0.02) |
|
|
(0.08) |
| Allowance for loan and lease losses as a percentage of |
|
|
|
|
|
|
|
|
|
|
|
|
|
|
| |
loans and leases held for investment (%) |
|
1.07 |
|
|
1.08 |
|
|
1.23 |
|
|
(0.01) |
|
|
(0.16) |
| Net charge-offs as a percentage of average loans and |
|
|
|
|
|
|
|
|
|
|
|
|
|
|
| |
leases (%) annualized |
|
0.38 |
|
|
0.32 |
|
|
0.39 |
|
|
0.06 |
|
|
(0.01) |
| Ratio of allowance for loan and lease losses to net |
|
|
|
|
|
|
|
|
|
|
|
|
|
|
| |
charge-offs (times) annualized |
|
2.83 |
|
|
3.44 |
|
|
3.21 |
|
|
(0.61) |
|
|
(0.38) |
| Ratio of allowance for loan and lease losses to |
|
|
|
|
|
|
|
|
|
|
|
|
|
|
| |
nonperforming loans and leases held for |
|
|
|
|
|
|
|
|
|
|
|
|
|
|
| |
investment (times) |
|
2.53 |
|
|
2.49 |
|
|
2.39 |
|
|
0.04 |
|
|
0.14 |
| (1) | Excludes amounts related to government guaranteed GNMA mortgage loans that BB&T has the right but not the obligation to
repurchase. See footnotes on the Credit Quality pages of the Quarterly Performance Summary for additional information. |
| (2) | The Q3 2015 amount has been revised from the previously reported amount. See the footnotes on page 14 of the Quarterly Performance
Summary for additional information. |
Nonperforming assets totaled $712 million at December 31, 2015,
a decrease of $32 million compared to September 30, 2015. The decrease was driven by the fourth quarter sale of nonperforming residential
mortgage loans, partially offset by a residential mortgage and direct retail lending policy change to move loans to nonaccrual
status at 120 days past due instead of 180 days. At December 31, 2015, nonperforming loans and leases represented 0.42% of loans
and leases held for investment, compared to 0.43% at September 30, 2015.
Loans 30-89 days past due and still accruing, excluding government
guaranteed GNMA mortgage loans that BB&T has the right but not the obligation to repurchase, totaled $1.0 billion at December
31, 2015, an increase of $122 million compared to the prior quarter. This increase was primarily driven by a $31 million increase
for residential mortgage loans, which was primarily the result of conforming the delinquency calculation methodology of Susquehanna
loans to BB&T’s method upon conversion of the related loan system. The increase is also driven by a $30 million increase
in the other lending subsidiaries portfolio, which reflects seasonality in the nonprime portfolio.
Loans 90 days or more past due and still accruing totaled $312 million
at December 31, 2015, a decrease of $69 million compared to the prior quarter, primarily driven by loans acquired from the FDIC
and PCI loans. Excluding acquired from FDIC and PCI loans, the ratio of loans 90 days or more past due and still accruing as a
percentage of loans and leases was 0.15% at December 31, 2015, a decline of one basis point compared to the prior quarter.
Net charge-offs during the fourth quarter totaled $130 million, an increase of $23 million compared to the
prior quarter, partially due to the previously mentioned nonperforming residential mortgage loan sale. As a percentage of average
loans and leases, annualized net charge-offs were 0.38%, compared to 0.32% in the prior quarter.
The allowance for loan and lease losses, excluding the allowance
for loans acquired from the FDIC and PCI loans, was $1.4 billion, essentially flat compared to the prior quarter. The allowance
for loans acquired from the FDIC and PCI loans was $61 million, also essentially flat compared to the prior quarter. As of December
31, 2015, the total allowance for loan and lease losses was 1.07% of loans and leases held for investment, compared to 1.08% at
September 30, 2015.
The allowance for loan and lease losses was 2.53 times nonperforming
loans and leases held for investment, compared to 2.49 times at September 30, 2015. At December 31, 2015, the allowance for loan
and lease losses was 2.83 times annualized net charge-offs, compared to 3.44 times at September 30, 2015.
Earnings presentation and Quarterly Performance Summary
To listen to BB&T’s live fourth quarter 2015 earnings
conference call at 8 a.m. (ET) today, please call 1-888-632-5009 and enter the participant code 5184622. A presentation will be
used during the earnings conference call and is available on our website at www.bbt.com.
Replays of the conference call will be available for 30 days by dialing 888-203-1112 (access code 4313363).
The presentation, including an appendix reconciling non-GAAP disclosures,
is available at www.bbt.com.
BB&T’s fourth quarter 2015 Quarterly Performance Summary,
which contains detailed financial schedules, is available on BB&T’s website at www.bbt.com.
About BB&T
As of December 31, 2015, BB&T is one of the largest financial
services holding companies in the U.S. with $209.9 billion in assets and market capitalization of $29.5 billion. Based in Winston-Salem,
N.C., the company operates 2,139 financial centers in 15 states and Washington, D.C., and offers a full range of consumer and
commercial banking, securities brokerage, asset management, mortgage and insurance products and services. A Fortune 500 company,
BB&T is consistently recognized for outstanding client satisfaction by the U.S. Small Business Administration, Greenwich Associates
and others. More information about BB&T and its full line of products and services is available at www.bbt.com.
#-#-#
Capital ratios are preliminary. Credit quality data excludes
government guaranteed GNMA loans where applicable.
This news release contains financial information and performance
measures determined by methods other than in accordance with accounting principles generally accepted in the United States of America
(“GAAP”). BB&T’s management uses these “non-GAAP” measures in their analysis of the Corporation’s
performance and the efficiency of its operations. Management believes that these non-GAAP measures provide a greater understanding
of ongoing operations and enhance comparability of results with prior periods as well as demonstrating the effects of significant
gains and charges in the current period. The company believes that a meaningful analysis of its financial performance requires
an understanding of the factors underlying that performance. BB&T’s management believes that investors may use these
non-GAAP financial measures to analyze financial performance without the impact of unusual items that may obscure trends in the
company’s underlying performance. These disclosures should not be viewed as a substitute for financial measures determined
in accordance with GAAP, nor are they necessarily comparable to non-GAAP performance measures that may be presented by other companies.
Below is a listing of the types of non-GAAP measures used in this news release:
| · | Tangible common equity and related ratios are non-GAAP measures. The return on average risk-weighted
assets is a non-GAAP measure. BB&T's management uses these measures to assess the quality of capital and believes that investors
may find them useful in their analysis of the Corporation. |
| · | The ratio of loans greater than 90 days and still accruing interest as a percentage of loans
held for investment has been adjusted to remove the impact of loans that are or were covered by FDIC loss sharing agreements and
PCI loans. Management believes that their inclusion may result in distortion of these ratios such that they might not be comparable
to other periods presented or to other portfolios that were not impacted by purchase accounting. |
| · | Adjusted fee income and adjusted efficiency ratios are non-GAAP in that they exclude securities
gains (losses), foreclosed property expense, amortization of intangible assets, merger-related and restructuring charges, the impact
of FDIC loss share accounting and other selected items. BB&T’s management uses these measures in their analysis of the
Corporation’s performance. BB&T’s management believes these measures provide a greater understanding of ongoing
operations and enhance comparability of results with prior periods, as well as demonstrating the effects of significant gains and
charges. |
| · | Return on average tangible common shareholders’ equity is a non-GAAP measure that calculates
the return on average common shareholders’ equity without the impact of intangible assets and their related amortization.
This measure is useful for evaluating the performance of a business consistently, whether acquired or developed internally. |
| · | Core net interest margin is a non-GAAP measure that adjusts net interest margin to exclude
the impact of interest income and funding costs associated with loans and securities acquired in the Colonial acquisition and purchased
credit impaired (“PCI”) loans acquired from Susquehanna. Core net interest margin is also adjusted to remove the purchase
accounting marks and related amortization for non-PCI loans and deposits acquired from Susquehanna. BB&T’s management
believes that the adjustments to the calculation of net interest margin for certain assets and deposits acquired provide investors
with useful information related to the performance of BB&T’s earning assets. |
A reconciliation of these non-GAAP measures to the most directly
comparable GAAP measure is included in BB&T’s Fourth Quarter 2015 Quarterly Performance Summary, which is available
on BB&T’s website at www.bbt.com.
This news release contains “forward-looking statements”
within the meaning of the Private Securities Litigation Reform Act of 1995, regarding the financial condition, results of operations,
business plans and the future performance of BB&T that are based on the beliefs and assumptions of the management of BB&T
and the information available to management at the time that these disclosures were prepared. Words such as “anticipates,”
“believes,” “estimates,” “expects,” “forecasts,” “intends,” “plans,”
“projects,” “may,” “will,” “should,” “could,” and other similar expressions
are intended to identify these forward-looking statements. Such statements are subject to factors that could cause actual results
to differ materially from anticipated results. Such factors include, but are not limited to, the following:
| · | general economic or business conditions, either nationally or regionally, may be less favorable than expected, resulting
in, among other things, a deterioration in credit quality and/or a reduced demand for credit, insurance or other services; |
| · | disruptions to the credit and financial markets, either nationally or globally, including the impact of a downgrade of U.S.
government obligations by one of the credit ratings agencies, the adverse effects of recessionary conditions in Europe and the
impact of recent market disruptions in China; |
| · | changes in the interest rate environment, including interest rate changes made by the Federal Reserve, and cash flow reassessments
may reduce NIM and/or the volumes and values of loans made or held as well as the value of other financial assets held; |
| · | competitive pressures among depository and other financial institutions may increase significantly; |
| · | legislative, regulatory or accounting changes, including changes resulting from the adoption and implementation of the Dodd-Frank
Act may adversely affect the businesses in which BB&T is engaged; |
| · | local, state or federal taxing authorities may take tax positions that are adverse to BB&T; |
| · | a reduction may occur in BB&T’s credit ratings; |
| · | adverse changes may occur in the securities markets; |
| · | competitors of BB&T may have greater financial resources and develop products that enable them to compete more successfully
than BB&T and may be subject to different regulatory standards than BB&T; |
| · | natural or other disasters, including acts of domestic or foreign terrorism, could have an adverse effect on BB&T in
that such events could materially disrupt BB&T’s operations or the ability or willingness of BB&T’s customers
to access the financial services BB&T offers; |
| · | costs or difficulties related to the integration of the businesses of BB&T and its merger partners may be greater than
expected; |
| · | expected cost savings or revenue growth associated with completed mergers and acquisitions may not be fully realized or
realized within the expected time frames; |
| · | significant litigation could have a material adverse effect on BB&T; |
| · | deposit attrition, customer loss and/or revenue loss following completed mergers and acquisitions may be greater than expected; |
| · | cyber-security risks, including “denial of service,” “hacking” and “identity theft,”
could adversely affect BB&T’s business, financial performance, or reputation; |
| · | higher than expected costs related to information technology infrastructure or a failure to successfully implement future
system enhancements could adversely impact BB&T’s financial condition and results of operations and could result in significant
additional costs to BB&T; |
| · | failure to execute on the Company’s strategic or operational plans, including the ability to successfully complete
and/or integrate mergers and acquisitions, could adversely impact BB&T’s financial condition and results of operations;
and |
| · | widespread system outages, caused by the failure of critical internal systems or critical services provided by third parties,
could adversely impact BB&T’s financial conditions and results of operations. |
Readers are cautioned not to place undue reliance on these forward-looking
statements, which speak only as of the date of this report. Actual results may differ materially from those expressed in or implied
by any forward-looking statement. Except to the extent required by applicable law or regulation, BB&T undertakes no obligation
to revise or update publicly any forward-looking statements for any reason.
- 21 -

BB&T Corporation
Quarterly Performance Summary
Fourth Quarter 2015
| BB&T Corporation |
|
|
|
|
|
|
|
|
 |
| Financial Highlights |
|
|
|
|
|
|
|
|
|
| (Dollars in millions, except per share data, shares in thousands) |
|
|
|
|
|
|
|
|
|
|
|
|
|
|
|
|
|
|
|
|
|
| |
|
Quarter Ended |
|
|
|
|
Year-to-Date |
|
|
|
| |
|
December 31 |
|
% |
|
December 31 |
|
% |
| |
|
2015 |
|
2014 |
|
Change |
|
2015 |
|
2014 |
|
Change |
| Summary Income Statement |
|
|
|
|
|
|
|
|
|
|
|
|
|
|
|
|
|
|
|
|
|
| Interest income |
$ |
1,733 |
|
|
$ |
1,554 |
|
|
11.5 |
% |
|
$ |
6,473 |
|
|
$ |
6,286 |
|
|
3.0 |
% |
| Interest expense |
|
191 |
|
|
|
183 |
|
|
4.4 |
|
|
|
735 |
|
|
|
769 |
|
|
(4.4) |
|
| |
Net interest income - taxable equivalent |
|
1,542 |
|
|
|
1,371 |
|
|
12.5 |
|
|
|
5,738 |
|
|
|
5,517 |
|
|
4.0 |
|
| Less: Taxable-equivalent adjustment |
|
38 |
|
|
|
36 |
|
|
5.6 |
|
|
|
146 |
|
|
|
143 |
|
|
2.1 |
|
| |
Net interest income |
|
1,504 |
|
|
|
1,335 |
|
|
12.7 |
|
|
|
5,592 |
|
|
|
5,374 |
|
|
4.1 |
|
| Provision for credit losses |
|
129 |
|
|
|
83 |
|
|
55.4 |
|
|
|
428 |
|
|
|
251 |
|
|
70.5 |
|
| |
Net interest income after provision for credit losses |
|
1,375 |
|
|
|
1,252 |
|
|
9.8 |
|
|
|
5,164 |
|
|
|
5,123 |
|
|
0.8 |
|
| Noninterest income |
|
1,015 |
|
|
|
1,022 |
|
|
(0.7) |
|
|
|
4,019 |
|
|
|
3,856 |
|
|
4.2 |
|
| Noninterest expense |
|
1,597 |
|
|
|
1,394 |
|
|
14.6 |
|
|
|
6,266 |
|
|
|
5,852 |
|
|
7.1 |
|
| Income before income taxes |
|
793 |
|
|
|
880 |
|
|
(9.9) |
|
|
|
2,917 |
|
|
|
3,127 |
|
|
(6.7) |
|
| Provision for income taxes |
|
251 |
|
|
|
277 |
|
|
(9.4) |
|
|
|
794 |
|
|
|
921 |
|
|
(13.8) |
|
| |
Net income |
|
542 |
|
|
|
603 |
|
|
(10.1) |
|
|
|
2,123 |
|
|
|
2,206 |
|
|
(3.8) |
|
| Noncontrolling interests |
|
3 |
|
|
|
15 |
|
|
(80.0) |
|
|
|
39 |
|
|
|
75 |
|
|
(48.0) |
|
| Preferred stock dividends |
|
37 |
|
|
|
37 |
|
|
― |
|
|
|
148 |
|
|
|
148 |
|
|
― |
|
| |
Net income available to common shareholders |
|
502 |
|
|
|
551 |
|
|
(8.9) |
|
|
|
1,936 |
|
|
|
1,983 |
|
|
(2.4) |
|
| Per Common Share Data |
|
|
|
|
|
|
|
|
|
|
|
|
|
|
|
|
|
|
|
|
|
| Earnings: |
|
|
|
|
|
|
|
|
|
|
|
|
|
|
|
|
|
|
|
|
|
| |
Basic |
$ |
0.64 |
|
|
$ |
0.77 |
|
|
(16.9) |
% |
|
$ |
2.59 |
|
|
$ |
2.76 |
|
|
(6.2) |
% |
| |
Diluted |
|
0.64 |
|
|
|
0.75 |
|
|
(14.7) |
|
|
|
2.56 |
|
|
|
2.72 |
|
|
(5.9) |
|
| Cash dividends declared |
|
0.27 |
|
|
|
0.24 |
|
|
12.5 |
|
|
|
1.05 |
|
|
|
0.95 |
|
|
10.5 |
|
| Common equity |
|
31.66 |
|
|
|
30.09 |
|
|
5.2 |
|
|
|
31.66 |
|
|
|
30.09 |
|
|
5.2 |
|
| Tangible common equity (1) |
|
19.82 |
|
|
|
19.86 |
|
|
(0.2) |
|
|
|
19.82 |
|
|
|
19.86 |
|
|
(0.2) |
|
| |
|
|
|
|
|
|
|
|
|
|
|
|
|
|
|
|
|
|
|
|
|
|
| End of period shares outstanding |
|
780,337 |
|
|
|
720,698 |
|
|
8.3 |
|
|
|
780,337 |
|
|
|
720,698 |
|
|
8.3 |
|
| Weighted average shares: |
|
|
|
|
|
|
|
|
|
|
|
|
|
|
|
|
|
|
|
|
|
| |
Basic |
|
780,261 |
|
|
|
720,418 |
|
|
8.3 |
|
|
|
748,010 |
|
|
|
718,140 |
|
|
4.2 |
|
| |
Diluted |
|
790,244 |
|
|
|
730,652 |
|
|
8.2 |
|
|
|
757,765 |
|
|
|
728,372 |
|
|
4.0 |
|
| Performance Ratios |
|
|
|
|
|
|
|
|
|
|
|
|
|
|
|
|
|
|
|
|
|
| Return on average assets |
|
1.03 |
% |
|
|
1.28 |
% |
|
|
|
|
|
1.08 |
% |
|
|
1.19 |
% |
|
|
|
| Return on average risk-weighted assets |
|
1.29 |
|
|
|
1.68 |
|
|
|
|
|
|
1.35 |
|
|
|
1.58 |
|
|
|
|
| Return on average common shareholders' equity |
|
8.06 |
|
|
|
9.99 |
|
|
|
|
|
|
8.34 |
|
|
|
9.32 |
|
|
|
|
| Return on average tangible common shareholders' equity (2) |
|
13.37 |
|
|
|
15.45 |
|
|
|
|
|
|
13.34 |
|
|
|
14.68 |
|
|
|
|
| Net interest margin - taxable equivalent |
|
3.35 |
|
|
|
3.36 |
|
|
|
|
|
|
3.32 |
|
|
|
3.42 |
|
|
|
|
| Fee income ratio (3) |
|
41.8 |
|
|
|
46.2 |
|
|
|
|
|
|
43.9 |
|
|
|
44.7 |
|
|
|
|
| Efficiency ratio (3) |
|
58.8 |
|
|
|
55.6 |
|
|
|
|
|
|
58.9 |
|
|
|
57.7 |
|
|
|
|
| Credit Quality |
|
|
|
|
|
|
|
|
|
|
|
|
|
|
|
|
|
|
|
| Nonperforming assets as a percentage of: |
|
|
|
|
|
|
|
|
|
|
|
|
|
|
|
|
|
|
|
|
|
| |
Total assets |
|
0.34 |
% |
|
|
0.42 |
% |
|
|
|
|
|
0.34 |
% |
|
|
0.42 |
% |
|
|
|
| |
Loans and leases plus foreclosed property |
|
0.52 |
|
|
|
0.65 |
|
|
|
|
|
|
0.52 |
|
|
|
0.65 |
|
|
|
|
| Net charge-offs as a percentage of average |
|
|
|
|
|
|
|
|
|
|
|
|
|
|
|
|
|
|
|
|
|
| |
loans and leases |
|
0.38 |
|
|
|
0.39 |
|
|
|
|
|
|
0.35 |
|
|
|
0.46 |
|
|
|
|
| Allowance for loan and lease losses as a percentage |
|
|
|
|
|
|
|
|
|
|
|
|
|
|
|
|
|
|
|
|
|
| |
of loans and leases held for investment |
|
1.07 |
|
|
|
1.23 |
|
|
|
|
|
|
1.07 |
|
|
|
1.23 |
|
|
|
|
| Ratio of allowance for loan and lease losses to |
|
|
|
|
|
|
|
|
|
|
|
|
|
|
|
|
|
|
|
|
|
| |
nonperforming loans and leases held for investment |
|
2.53 |
X |
|
|
2.39 |
X |
|
|
|
|
|
2.53 |
X |
|
|
2.39 |
X |
|
|
|
| Average Balances |
|
|
|
|
|
|
|
|
|
|
|
|
|
|
|
|
|
|
|
|
|
| Total assets |
$ |
209,217 |
|
|
$ |
186,462 |
|
|
12.2 |
% |
|
$ |
197,347 |
|
|
$ |
185,095 |
|
|
6.6 |
% |
| Total securities (4) |
|
43,468 |
|
|
|
40,817 |
|
|
6.5 |
|
|
|
42,103 |
|
|
|
40,541 |
|
|
3.9 |
|
| Loans and leases |
|
136,190 |
|
|
|
119,912 |
|
|
13.6 |
|
|
|
127,802 |
|
|
|
118,830 |
|
|
7.6 |
|
| Deposits |
|
148,491 |
|
|
|
130,315 |
|
|
13.9 |
|
|
|
138,498 |
|
|
|
129,077 |
|
|
7.3 |
|
| Common shareholders' equity |
|
24,736 |
|
|
|
21,895 |
|
|
13.0 |
|
|
|
23,206 |
|
|
|
21,280 |
|
|
9.1 |
|
| Shareholders' equity |
|
27,378 |
|
|
|
24,574 |
|
|
11.4 |
|
|
|
25,871 |
|
|
|
23,954 |
|
|
8.0 |
|
| Period-End Balances |
|
|
|
|
|
|
|
|
|
|
|
|
|
|
|
|
|
|
|
|
|
| Total assets |
$ |
209,947 |
|
|
$ |
186,834 |
|
|
12.4 |
% |
|
$ |
209,947 |
|
|
$ |
186,834 |
|
|
12.4 |
% |
| Total securities (4) |
|
43,827 |
|
|
|
41,147 |
|
|
6.5 |
|
|
|
43,827 |
|
|
|
41,147 |
|
|
6.5 |
|
| Loans and leases |
|
136,986 |
|
|
|
121,307 |
|
|
12.9 |
|
|
|
136,986 |
|
|
|
121,307 |
|
|
12.9 |
|
| Deposits |
|
149,124 |
|
|
|
129,040 |
|
|
15.6 |
|
|
|
149,124 |
|
|
|
129,040 |
|
|
15.6 |
|
| Common shareholders' equity |
|
24,703 |
|
|
|
21,686 |
|
|
13.9 |
|
|
|
24,703 |
|
|
|
21,686 |
|
|
13.9 |
|
| Shareholders' equity |
|
27,340 |
|
|
|
24,377 |
|
|
12.2 |
|
|
|
27,340 |
|
|
|
24,377 |
|
|
12.2 |
|
| Capital Ratios - Preliminary |
|
|
|
|
|
|
|
|
|
|
|
|
|
|
|
|
|
|
|
|
|
| Risk-based: |
Basel III |
|
Basel I |
|
|
|
|
Basel III |
|
Basel I |
|
|
|
| |
Common equity Tier 1 |
|
10.2 |
% |
|
|
N/A |
|
|
|
|
|
|
10.2 |
% |
|
|
N/A |
|
|
|
|
| |
Tier 1 |
|
11.8 |
|
|
|
12.4 |
% |
|
|
|
|
|
11.8 |
|
|
|
12.4 |
% |
|
|
|
| |
Total |
|
14.2 |
|
|
|
14.9 |
|
|
|
|
|
|
14.2 |
|
|
|
14.9 |
|
|
|
|
| Leverage |
|
9.8 |
|
|
|
9.9 |
|
|
|
|
|
|
9.8 |
|
|
|
9.9 |
|
|
|
|
| Tangible common equity to tangible assets (1) |
|
7.7 |
|
|
|
8.0 |
|
|
|
|
|
|
7.7 |
|
|
|
8.0 |
|
|
|
|
| NM - not meaningful. |
| Applicable ratios are annualized. Risk-based and leverage capital ratios for the first quarter of 2015 and later are determined in accordance with the Basel III Standardized Transitional Approach, which became effective January 1, 2015. Ratios for earlier periods were determined in accordance with Basel I. |
| (1) |
Tangible common equity per share and tangible common equity to tangible assets ratios are non-GAAP measures. See the calculations and management's reasons for using these measures in the Capital Information - Five Quarter Trend section of this supplement. |
| (2) |
Return on average tangible common shareholders' equity is a non-GAAP measure. See the calculation and management's reasons for using this measure in the Non-GAAP Reconciliations section of this supplement. |
| (3) |
Excludes certain items as detailed in the Non-GAAP Reconciliations section of this supplement. |
| (4) |
Excludes trading securities. Average balances reflect both AFS and HTM securities at amortized cost. Period-end balances reflect AFS securities at fair value and HTM securities at amortized cost. |
| |
| |
| BB&T Corporation |
|
|
|
|
|
|
| Financial Highlights - Five Quarter Trend |
|
|
|
|
|
|
|
|
|
|
|
|
|
|
|
|
|
|
|
| (Dollars in millions, except per share data, shares in thousands) |
|
|
|
|
|
|
|
|
|
|
|
|
|
|
|
|
|
|
|
| |
|
|
|
|
|
|
|
|
|
|
|
|
|
|
|
|
|
|
|
|
| |
|
Quarter Ended |
| |
|
Dec. 31 |
|
Sept. 30 |
|
June 30 |
|
March 31 |
|
Dec. 31 |
| |
|
2015 |
|
2015 |
|
2015 |
|
2015 |
|
2014 |
| Summary Income Statement |
|
|
|
|
|
|
|
|
|
|
|
|
|
|
|
|
|
|
|
| Interest income |
$ |
1,733 |
|
|
$ |
1,687 |
|
|
$ |
1,525 |
|
|
$ |
1,528 |
|
|
$ |
1,554 |
|
| Interest expense |
|
191 |
|
|
|
186 |
|
|
|
177 |
|
|
|
181 |
|
|
|
183 |
|
| |
Net interest income - taxable equivalent |
|
1,542 |
|
|
|
1,501 |
|
|
|
1,348 |
|
|
|
1,347 |
|
|
|
1,371 |
|
| Less: Taxable-equivalent adjustment |
|
38 |
|
|
|
37 |
|
|
|
36 |
|
|
|
35 |
|
|
|
36 |
|
| |
Net interest income |
|
1,504 |
|
|
|
1,464 |
|
|
|
1,312 |
|
|
|
1,312 |
|
|
|
1,335 |
|
| Provision for credit losses |
|
129 |
|
|
|
103 |
|
|
|
97 |
|
|
|
99 |
|
|
|
83 |
|
| |
Net interest income after provision for credit losses |
|
1,375 |
|
|
|
1,361 |
|
|
|
1,215 |
|
|
|
1,213 |
|
|
|
1,252 |
|
| Noninterest income |
|
1,015 |
|
|
|
988 |
|
|
|
1,019 |
|
|
|
997 |
|
|
|
1,022 |
|
| Noninterest expense |
|
1,597 |
|
|
|
1,594 |
|
|
|
1,653 |
|
|
|
1,422 |
|
|
|
1,394 |
|
| Income before income taxes |
|
793 |
|
|
|
755 |
|
|
|
581 |
|
|
|
788 |
|
|
|
880 |
|
| Provision for income taxes |
|
251 |
|
|
|
222 |
|
|
|
80 |
|
|
|
241 |
|
|
|
277 |
|
| |
Net income |
|
542 |
|
|
|
533 |
|
|
|
501 |
|
|
|
547 |
|
|
|
603 |
|
| Noncontrolling interests |
|
3 |
|
|
|
4 |
|
|
|
10 |
|
|
|
22 |
|
|
|
15 |
|
| Preferred stock dividends |
|
37 |
|
|
|
37 |
|
|
|
37 |
|
|
|
37 |
|
|
|
37 |
|
| |
Net income available to common shareholders |
|
502 |
|
|
|
492 |
|
|
|
454 |
|
|
|
488 |
|
|
|
551 |
|
| Per Common Share Data |
|
|
|
|
|
|
|
|
|
|
|
|
|
|
|
|
|
|
|
| Earnings: |
|
|
|
|
|
|
|
|
|
|
|
|
|
|
|
|
|
|
|
| |
Basic |
$ |
0.64 |
|
|
$ |
0.64 |
|
|
$ |
0.63 |
|
|
$ |
0.68 |
|
|
$ |
0.77 |
|
| |
Diluted |
|
0.64 |
|
|
|
0.64 |
|
|
|
0.62 |
|
|
|
0.67 |
|
|
|
0.75 |
|
| Cash dividends declared |
|
0.27 |
|
|
|
0.27 |
|
|
|
0.27 |
|
|
|
0.24 |
|
|
|
0.24 |
|
| Common equity |
|
31.66 |
|
|
|
31.56 |
|
|
|
30.64 |
|
|
|
30.48 |
|
|
|
30.09 |
|
| Tangible common equity (1) |
|
19.82 |
|
|
|
19.77 |
|
|
|
20.21 |
|
|
|
20.13 |
|
|
|
19.86 |
|
| |
|
|
|
|
|
|
|
|
|
|
|
|
|
|
|
|
|
|
|
|
| End of period shares outstanding |
|
780,337 |
|
|
|
780,150 |
|
|
|
733,481 |
|
|
|
723,159 |
|
|
|
720,698 |
|
| Weighted average shares: |
|
|
|
|
|
|
|
|
|
|
|
|
|
|
|
|
|
|
|
| |
Basic |
|
780,261 |
|
|
|
764,435 |
|
|
|
724,880 |
|
|
|
721,639 |
|
|
|
720,418 |
|
| |
Diluted |
|
790,244 |
|
|
|
774,023 |
|
|
|
734,527 |
|
|
|
731,511 |
|
|
|
730,652 |
|
| Performance Ratios |
|
|
|
|
|
|
|
|
|
|
|
|
|
|
|
|
|
|
|
| Return on average assets |
|
1.03 |
% |
|
|
1.04 |
% |
|
|
1.06 |
% |
|
|
1.18 |
% |
|
|
1.28 |
% |
| Return on average risk-weighted assets |
|
1.29 |
|
|
|
1.32 |
|
|
|
1.32 |
|
|
|
1.48 |
|
|
|
1.68 |
|
| Return on average common shareholders' equity |
|
8.06 |
|
|
|
8.14 |
|
|
|
8.20 |
|
|
|
9.05 |
|
|
|
9.99 |
|
| Return on average tangible common shareholders' equity (2) |
|
13.37 |
|
|
|
13.23 |
|
|
|
12.76 |
|
|
|
14.00 |
|
|
|
15.45 |
|
| Net interest margin - taxable equivalent |
|
3.35 |
|
|
|
3.35 |
|
|
|
3.27 |
|
|
|
3.33 |
|
|
|
3.36 |
|
| Fee income ratio (3) |
|
41.8 |
|
|
|
42.1 |
|
|
|
46.3 |
|
|
|
45.8 |
|
|
|
46.2 |
|
| Efficiency ratio (3) |
|
58.8 |
|
|
|
59.2 |
|
|
|
59.2 |
|
|
|
58.5 |
|
|
|
55.6 |
|
| Credit Quality |
|
|
|
|
|
|
|
|
|
|
|
|
|
|
|
|
|
|
|
| Nonperforming assets as a percentage of: |
|
|
|
|
|
|
|
|
|
|
|
|
|
|
|
|
|
|
|
| |
Total assets |
|
0.34 |
% |
|
|
0.36 |
% |
|
|
0.38 |
% |
|
|
0.40 |
% |
|
|
0.42 |
% |
| |
Loans and leases plus foreclosed property |
|
0.52 |
|
|
|
0.55 |
|
|
|
0.60 |
|
|
|
0.64 |
|
|
|
0.65 |
|
| Net charge-offs as a percentage of average |
|
|
|
|
|
|
|
|
|
|
|
|
|
|
|
|
|
|
|
| |
loans and leases |
|
0.38 |
|
|
|
0.32 |
|
|
|
0.33 |
|
|
|
0.34 |
|
|
|
0.39 |
|
| Allowance for loan and lease losses as a percentage |
|
|
|
|
|
|
|
|
|
|
|
|
|
|
|
|
|
|
|
| |
of loans and leases held for investment |
|
1.07 |
|
|
|
1.08 |
|
|
|
1.19 |
|
|
|
1.22 |
|
|
|
1.23 |
|
| Ratio of allowance for loan and lease losses to |
|
|
|
|
|
|
|
|
|
|
|
|
|
|
|
|
|
|
|
| |
nonperforming loans and leases held for investment |
|
2.53 |
X |
|
|
2.49 |
X |
|
|
2.55 |
X |
|
|
2.45 |
X |
|
|
2.39 |
X |
| Average Balances |
|
|
|
|
|
|
|
|
|
|
|
|
|
|
|
|
|
|
|
| Total assets |
$ |
209,217 |
|
|
$ |
203,531 |
|
|
$ |
189,033 |
|
|
$ |
187,297 |
|
|
$ |
186,462 |
|
| Total securities (4) |
|
43,468 |
|
|
|
43,048 |
|
|
|
40,727 |
|
|
|
41,133 |
|
|
|
40,817 |
|
| Loans and leases |
|
136,190 |
|
|
|
132,499 |
|
|
|
122,056 |
|
|
|
120,235 |
|
|
|
119,912 |
|
| Deposits |
|
148,491 |
|
|
|
143,837 |
|
|
|
131,868 |
|
|
|
129,531 |
|
|
|
130,315 |
|
| Common shareholders' equity |
|
24,736 |
|
|
|
23,957 |
|
|
|
22,210 |
|
|
|
21,883 |
|
|
|
21,895 |
|
| Total shareholders' equity |
|
27,378 |
|
|
|
26,612 |
|
|
|
24,888 |
|
|
|
24,566 |
|
|
|
24,574 |
|
| Period-End Balances |
|
|
|
|
|
|
|
|
|
|
|
|
|
|
|
|
|
|
|
| Total assets |
$ |
209,947 |
|
|
$ |
208,809 |
|
|
$ |
191,017 |
|
|
$ |
189,228 |
|
|
$ |
186,834 |
|
| Total securities (4) |
|
43,827 |
|
|
|
43,494 |
|
|
|
40,620 |
|
|
|
42,089 |
|
|
|
41,147 |
|
| Loans and leases |
|
136,986 |
|
|
|
136,967 |
|
|
|
124,770 |
|
|
|
122,027 |
|
|
|
121,307 |
|
| Deposits |
|
149,124 |
|
|
|
147,827 |
|
|
|
132,783 |
|
|
|
131,229 |
|
|
|
129,040 |
|
| Common shareholders' equity |
|
24,703 |
|
|
|
24,621 |
|
|
|
22,477 |
|
|
|
22,039 |
|
|
|
21,686 |
|
| Shareholders' equity |
|
27,340 |
|
|
|
27,264 |
|
|
|
25,132 |
|
|
|
24,738 |
|
|
|
24,377 |
|
| Capital Ratios - Preliminary |
|
|
|
|
|
|
|
|
|
|
|
|
|
|
|
|
|
|
|
| Risk-based: |
Basel III |
|
Basel I |
| |
Common equity Tier 1 |
|
10.2 |
% |
|
|
10.1 |
% |
|
|
10.4 |
% |
|
|
10.5 |
% |
|
|
N/A |
|
| |
Tier 1 |
|
11.8 |
|
|
|
11.7 |
|
|
|
12.1 |
|
|
|
12.2 |
|
|
|
12.4 |
% |
| |
Total |
|
14.2 |
|
|
|
14.2 |
|
|
|
14.2 |
|
|
|
14.4 |
|
|
|
14.9 |
|
| Leverage |
|
9.8 |
|
|
|
9.9 |
|
|
|
10.2 |
|
|
|
10.1 |
|
|
|
9.9 |
|
| Tangible common equity to tangible assets (1) |
|
7.7 |
|
|
|
7.7 |
|
|
|
8.1 |
|
|
|
8.0 |
|
|
|
8.0 |
|
| Applicable ratios are annualized. Risk-based and leverage capital ratios for the first quarter of 2015 and later are determined in accordance with the Basel III Standardized Transitional Approach, which became effective January 1, 2015. Ratios for earlier periods were determined in accordance with Basel I. |
| (1) |
Tangible common equity per share and tangible common equity to tangible assets ratios are non-GAAP measures. See the calculations and management's reasons for using these measures in the Capital Information - Five Quarter Trend section of this supplement. |
| (2) |
Return on average tangible common shareholders' equity is a non-GAAP measure. See the calculation and management's reasons for using this measure in the Non-GAAP Reconciliations section of this supplement. |
| (3) |
Excludes certain items as detailed in the Non-GAAP Reconciliations section of this supplement. |
| (4) |
Excludes trading securities. Average balances reflect both AFS and HTM securities at amortized cost. Period-end balances reflect AFS securities at fair value and HTM securities at amortized cost. |
| BB&T Corporation |
|
| Consolidated Statements of Income |
|
|
|
|
|
|
|
|
|
|
|
|
| (Dollars in millions, except per share data, shares in thousands) |
|
|
|
|
|
|
|
|
|
|
|
|
| |
|
|
|
|
|
|
|
|
|
|
|
|
|
|
|
|
|
|
|
|
|
|
|
| |
|
|
Quarter Ended |
|
|
|
|
|
|
Year-to-Date |
|
|
|
|
| |
|
|
Dec. 31 |
|
Change |
|
Dec. 31 |
|
Change |
| |
|
|
2015 |
|
2014 |
|
$ |
% |
|
2015 |
|
2014 |
|
$ |
% |
| Interest Income |
|
|
|
|
|
|
|
|
|
|
|
|
|
|
|
|
|
|
|
|
|
| |
Interest and fees on loans and leases |
$ |
1,449 |
|
$ |
1,272 |
|
$ |
177 |
13.9 |
% |
|
$ |
5,347 |
|
$ |
5,163 |
|
$ |
184 |
3.6 |
% |
| |
Interest and dividends on securities |
|
237 |
|
|
237 |
|
|
― |
― |
|
|
|
941 |
|
|
939 |
|
|
2 |
0.2 |
|
| |
Interest on other earning assets |
|
9 |
|
|
9 |
|
|
― |
― |
|
|
|
39 |
|
|
40 |
|
|
(1) |
(2.5) |
|
| |
|
Total interest income |
|
1,695 |
|
|
1,518 |
|
|
177 |
11.7 |
|
|
|
6,327 |
|
|
6,142 |
|
|
185 |
3.0 |
|
| Interest Expense |
|
|
|
|
|
|
|
|
|
|
|
|
|
|
|
|
|
|
|
|
|
| |
Interest on deposits |
|
62 |
|
|
58 |
|
|
4 |
6.9 |
|
|
|
233 |
|
|
239 |
|
|
(6) |
(2.5) |
|
| |
Interest on short-term borrowings |
|
1 |
|
|
1 |
|
|
― |
― |
|
|
|
4 |
|
|
4 |
|
|
― |
― |
|
| |
Interest on long-term debt |
|
128 |
|
|
124 |
|
|
4 |
3.2 |
|
|
|
498 |
|
|
525 |
|
|
(27) |
(5.1) |
|
| |
|
Total interest expense |
|
191 |
|
|
183 |
|
|
8 |
4.4 |
|
|
|
735 |
|
|
768 |
|
|
(33) |
(4.3) |
|
| Net interest income |
|
1,504 |
|
|
1,335 |
|
|
169 |
12.7 |
|
|
|
5,592 |
|
|
5,374 |
|
|
218 |
4.1 |
|
| |
Provision for credit losses |
|
129 |
|
|
83 |
|
|
46 |
55.4 |
|
|
|
428 |
|
|
251 |
|
|
177 |
70.5 |
|
| Net interest income after provision for credit losses |
|
1,375 |
|
|
1,252 |
|
|
123 |
9.8 |
|
|
|
5,164 |
|
|
5,123 |
|
|
41 |
0.8 |
|
| Noninterest income |
|
|
|
|
|
|
|
|
|
|
|
|
|
|
|
|
|
|
|
|
|
| |
Insurance income |
|
380 |
|
|
409 |
|
|
(29) |
(7.1) |
|
|
|
1,596 |
|
|
1,643 |
|
|
(47) |
(2.9) |
|
| |
Service charges on deposits |
|
165 |
|
|
160 |
|
|
5 |
3.1 |
|
|
|
631 |
|
|
632 |
|
|
(1) |
(0.2) |
|
| |
Mortgage banking income |
|
104 |
|
|
128 |
|
|
(24) |
(18.8) |
|
|
|
455 |
|
|
395 |
|
|
60 |
15.2 |
|
| |
Investment banking and brokerage fees and commissions |
|
91 |
|
|
112 |
|
|
(21) |
(18.8) |
|
|
|
398 |
|
|
387 |
|
|
11 |
2.8 |
|
| |
Trust and investment advisory revenues |
|
64 |
|
|
56 |
|
|
8 |
14.3 |
|
|
|
240 |
|
|
221 |
|
|
19 |
8.6 |
|
| |
Bankcard fees and merchant discounts |
|
56 |
|
|
52 |
|
|
4 |
7.7 |
|
|
|
218 |
|
|
207 |
|
|
11 |
5.3 |
|
| |
Checkcard fees |
|
47 |
|
|
41 |
|
|
6 |
14.6 |
|
|
|
174 |
|
|
163 |
|
|
11 |
6.7 |
|
| |
Operating lease income |
|
33 |
|
|
29 |
|
|
4 |
13.8 |
|
|
|
124 |
|
|
95 |
|
|
29 |
30.5 |
|
| |
Income from bank-owned life insurance |
|
27 |
|
|
30 |
|
|
(3) |
(10.0) |
|
|
|
113 |
|
|
110 |
|
|
3 |
2.7 |
|
| |
FDIC loss share income, net |
|
(52) |
|
|
(84) |
|
|
32 |
(38.1) |
|
|
|
(253) |
|
|
(343) |
|
|
90 |
(26.2) |
|
| |
Securities gains (losses), net |
|
― |
|
|
― |
|
|
― |
NM |
|
|
|
(3) |
|
|
(3) |
|
|
― |
― |
|
| |
Other income |
|
100 |
|
|
89 |
|
|
11 |
12.4 |
|
|
|
326 |
|
|
349 |
|
|
(23) |
(6.6) |
|
| |
|
Total noninterest income |
|
1,015 |
|
|
1,022 |
|
|
(7) |
(0.7) |
|
|
|
4,019 |
|
|
3,856 |
|
|
163 |
4.2 |
|
| Noninterest Expense |
|
|
|
|
|
|
|
|
|
|
|
|
|
|
|
|
|
|
|
|
|
| |
Personnel expense |
|
893 |
|
|
794 |
|
|
99 |
12.5 |
|
|
|
3,469 |
|
|
3,180 |
|
|
289 |
9.1 |
|
| |
Occupancy and equipment expense |
|
192 |
|
|
168 |
|
|
24 |
14.3 |
|
|
|
708 |
|
|
682 |
|
|
26 |
3.8 |
|
| |
Software expense |
|
52 |
|
|
45 |
|
|
7 |
15.6 |
|
|
|
192 |
|
|
174 |
|
|
18 |
10.3 |
|
| |
Loan-related expense |
|
37 |
|
|
71 |
|
|
(34) |
(47.9) |
|
|
|
150 |
|
|
267 |
|
|
(117) |
(43.8) |
|
| |
Outside IT services |
|
41 |
|
|
27 |
|
|
14 |
51.9 |
|
|
|
135 |
|
|
115 |
|
|
20 |
17.4 |
|
| |
Professional services |
|
29 |
|
|
38 |
|
|
(9) |
(23.7) |
|
|
|
130 |
|
|
139 |
|
|
(9) |
(6.5) |
|
| |
Amortization of intangibles |
|
32 |
|
|
22 |
|
|
10 |
45.5 |
|
|
|
105 |
|
|
91 |
|
|
14 |
15.4 |
|
| |
Regulatory charges |
|
28 |
|
|
24 |
|
|
4 |
16.7 |
|
|
|
101 |
|
|
106 |
|
|
(5) |
(4.7) |
|
| |
Foreclosed property expense |
|
11 |
|
|
10 |
|
|
1 |
10.0 |
|
|
|
53 |
|
|
40 |
|
|
13 |
32.5 |
|
| |
Merger-related and restructuring charges, net |
|
50 |
|
|
18 |
|
|
32 |
177.8 |
|
|
|
165 |
|
|
46 |
|
|
119 |
NM |
|
| |
Loss on early extinguishment of debt |
|
― |
|
|
― |
|
|
― |
NM |
|
|
|
172 |
|
|
122 |
|
|
50 |
41.0 |
|
| |
Other expense |
|
232 |
|
|
177 |
|
|
55 |
31.1 |
|
|
|
886 |
|
|
890 |
|
|
(4) |
(0.4) |
|
| |
|
Total noninterest expense |
|
1,597 |
|
|
1,394 |
|
|
203 |
14.6 |
|
|
|
6,266 |
|
|
5,852 |
|
|
414 |
7.1 |
|
| Earnings |
|
|
|
|
|
|
|
|
|
|
|
|
|
|
|
|
|
|
|
|
|
| |
Income before income taxes |
|
793 |
|
|
880 |
|
|
(87) |
(9.9) |
|
|
|
2,917 |
|
|
3,127 |
|
|
(210) |
(6.7) |
|
| |
Provision for income taxes |
|
251 |
|
|
277 |
|
|
(26) |
(9.4) |
|
|
|
794 |
|
|
921 |
|
|
(127) |
(13.8) |
|
| |
|
Net Income |
|
542 |
|
|
603 |
|
|
(61) |
(10.1) |
|
|
|
2,123 |
|
|
2,206 |
|
|
(83) |
(3.8) |
|
| |
Noncontrolling interests |
|
3 |
|
|
15 |
|
|
(12) |
(80.0) |
|
|
|
39 |
|
|
75 |
|
|
(36) |
(48.0) |
|
| |
Preferred stock dividends |
|
37 |
|
|
37 |
|
|
― |
― |
|
|
|
148 |
|
|
148 |
|
|
― |
― |
|
| |
|
Net income available to common shareholders |
$ |
502 |
|
$ |
551 |
|
$ |
(49) |
(8.9) |
% |
|
$ |
1,936 |
|
$ |
1,983 |
|
$ |
(47) |
(2.4) |
% |
| |
|
|
|
|
|
|
|
|
|
|
|
|
|
|
|
|
|
|
|
|
|
|
|
| Earnings Per Common Share |
|
|
|
|
|
|
|
|
|
|
|
|
|
|
|
|
|
|
|
|
|
| |
|
Basic |
$ |
0.64 |
|
$ |
0.77 |
|
$ |
(0.13) |
(16.9) |
% |
|
$ |
2.59 |
|
$ |
2.76 |
|
$ |
(0.17) |
(6.2) |
% |
| |
|
Diluted |
|
0.64 |
|
|
0.75 |
|
|
(0.11) |
(14.7) |
|
|
|
2.56 |
|
|
2.72 |
|
|
(0.16) |
(5.9) |
|
| |
|
|
|
|
|
|
|
|
|
|
|
|
|
|
|
|
|
|
|
|
|
|
|
| Weighted Average Shares Outstanding |
|
|
|
|
|
|
|
|
|
|
|
|
|
|
|
|
|
|
|
|
|
| |
|
Basic |
|
780,261 |
|
|
720,418 |
|
|
59,843 |
8.3 |
|
|
|
748,010 |
|
|
718,140 |
|
|
29,870 |
4.2 |
|
| |
|
Diluted |
|
790,244 |
|
|
730,652 |
|
|
59,592 |
8.2 |
|
|
|
757,765 |
|
|
728,372 |
|
|
29,393 |
4.0 |
|
| NM - not meaningful. |
|
|
|
|
|
|
|
|
|
|
|
|
|
|
|
|
|
|
|
|
|
| BB&T Corporation |
|
|
| Consolidated Statements of Income - Five Quarter Trend |
|
|
|
|
|
|
|
|
|
|
|
|
|
|
| (Dollars in millions, except per share data, shares in thousands) |
|
|
|
|
|
|
|
|
|
|
|
|
|
|
| |
|
|
|
|
|
|
|
|
|
|
|
|
|
|
|
|
| |
|
|
Quarter Ended |
| |
|
|
Dec. 31 |
|
Sept. 30 |
|
June 30 |
|
March 31 |
|
Dec. 31 |
| |
|
|
2015 |
|
2015 |
|
2015 |
|
2015 |
|
2014 |
| Interest Income |
|
|
|
|
|
|
|
|
|
|
|
|
|
|
| |
Interest and fees on loans and leases |
$ |
1,449 |
|
$ |
1,412 |
|
$ |
1,249 |
|
$ |
1,237 |
|
$ |
1,272 |
| |
Interest and dividends on securities |
|
237 |
|
|
232 |
|
|
232 |
|
|
240 |
|
|
237 |
| |
Interest on other earning assets |
|
9 |
|
|
6 |
|
|
8 |
|
|
16 |
|
|
9 |
| |
|
Total interest income |
|
1,695 |
|
|
1,650 |
|
|
1,489 |
|
|
1,493 |
|
|
1,518 |
| Interest Expense |
|
|
|
|
|
|
|
|
|
|
|
|
|
|
| |
Interest on deposits |
|
62 |
|
|
61 |
|
|
55 |
|
|
55 |
|
|
58 |
| |
Interest on short-term borrowings |
|
1 |
|
|
1 |
|
|
1 |
|
|
1 |
|
|
1 |
| |
Interest on long-term debt |
|
128 |
|
|
124 |
|
|
121 |
|
|
125 |
|
|
124 |
| |
|
Total interest expense |
|
191 |
|
|
186 |
|
|
177 |
|
|
181 |
|
|
183 |
| Net interest income |
|
1,504 |
|
|
1,464 |
|
|
1,312 |
|
|
1,312 |
|
|
1,335 |
| |
Provision for credit losses |
|
129 |
|
|
103 |
|
|
97 |
|
|
99 |
|
|
83 |
| Net interest income after provision for credit losses |
|
1,375 |
|
|
1,361 |
|
|
1,215 |
|
|
1,213 |
|
|
1,252 |
| Noninterest income |
|
|
|
|
|
|
|
|
|
|
|
|
|
|
| |
Insurance income |
|
380 |
|
|
354 |
|
|
422 |
|
|
440 |
|
|
409 |
| |
Service charges on deposits |
|
165 |
|
|
167 |
|
|
154 |
|
|
145 |
|
|
160 |
| |
Mortgage banking income |
|
104 |
|
|
111 |
|
|
130 |
|
|
110 |
|
|
128 |
| |
Investment banking and brokerage fees and commissions |
|
91 |
|
|
105 |
|
|
108 |
|
|
94 |
|
|
112 |
| |
Trust and investment advisory revenues |
|
64 |
|
|
63 |
|
|
57 |
|
|
56 |
|
|
56 |
| |
Bankcard fees and merchant discounts |
|
56 |
|
|
57 |
|
|
55 |
|
|
50 |
|
|
52 |
| |
Checkcard fees |
|
47 |
|
|
45 |
|
|
43 |
|
|
39 |
|
|
41 |
| |
Operating lease income |
|
33 |
|
|
32 |
|
|
30 |
|
|
29 |
|
|
29 |
| |
Income from bank-owned life insurance |
|
27 |
|
|
29 |
|
|
27 |
|
|
30 |
|
|
30 |
| |
FDIC loss share income, net |
|
(52) |
|
|
(58) |
|
|
(64) |
|
|
(79) |
|
|
(84) |
| |
Securities gains (losses), net |
|
― |
|
|
(2) |
|
|
(1) |
|
|
― |
|
|
― |
| |
Other income |
|
100 |
|
|
85 |
|
|
58 |
|
|
83 |
|
|
89 |
| |
|
Total noninterest income |
|
1,015 |
|
|
988 |
|
|
1,019 |
|
|
997 |
|
|
1,022 |
| Noninterest Expense |
|
|
|
|
|
|
|
|
|
|
|
|
|
|
| |
Personnel expense |
|
893 |
|
|
882 |
|
|
864 |
|
|
830 |
|
|
794 |
| |
Occupancy and equipment expense |
|
192 |
|
|
183 |
|
|
166 |
|
|
167 |
|
|
168 |
| |
Software expense |
|
52 |
|
|
50 |
|
|
46 |
|
|
44 |
|
|
45 |
| |
Loan-related expense |
|
37 |
|
|
38 |
|
|
37 |
|
|
38 |
|
|
71 |
| |
Outside IT services |
|
41 |
|
|
35 |
|
|
29 |
|
|
30 |
|
|
27 |
| |
Professional services |
|
29 |
|
|
42 |
|
|
35 |
|
|
24 |
|
|
38 |
| |
Amortization of intangibles |
|
32 |
|
|
29 |
|
|
23 |
|
|
21 |
|
|
22 |
| |
Regulatory charges |
|
28 |
|
|
25 |
|
|
25 |
|
|
23 |
|
|
24 |
| |
Foreclosed property expense |
|
11 |
|
|
15 |
|
|
14 |
|
|
13 |
|
|
10 |
| |
Merger-related and restructuring charges, net |
|
50 |
|
|
77 |
|
|
25 |
|
|
13 |
|
|
18 |
| |
Loss on early extinguishment of debt |
|
― |
|
|
― |
|
|
172 |
|
|
― |
|
|
― |
| |
Other expense |
|
232 |
|
|
218 |
|
|
217 |
|
|
219 |
|
|
177 |
| |
|
Total noninterest expense |
|
1,597 |
|
|
1,594 |
|
|
1,653 |
|
|
1,422 |
|
|
1,394 |
| Earnings |
|
|
|
|
|
|
|
|
|
|
|
|
|
|
| |
Income before income taxes |
|
793 |
|
|
755 |
|
|
581 |
|
|
788 |
|
|
880 |
| |
Provision for income taxes |
|
251 |
|
|
222 |
|
|
80 |
|
|
241 |
|
|
277 |
| |
|
Net Income |
|
542 |
|
|
533 |
|
|
501 |
|
|
547 |
|
|
603 |
| |
Noncontrolling interests |
|
3 |
|
|
4 |
|
|
10 |
|
|
22 |
|
|
15 |
| |
Preferred stock dividends |
|
37 |
|
|
37 |
|
|
37 |
|
|
37 |
|
|
37 |
| |
|
Net income available to common shareholders |
$ |
502 |
|
$ |
492 |
|
$ |
454 |
|
$ |
488 |
|
$ |
551 |
| |
|
|
|
|
|
|
|
|
|
|
|
|
|
|
|
|
| Earnings Per Common Share |
|
|
|
|
|
|
|
|
|
|
|
|
|
|
| |
|
Basic |
$ |
0.64 |
|
$ |
0.64 |
|
$ |
0.63 |
|
$ |
0.68 |
|
$ |
0.77 |
| |
|
Diluted |
|
0.64 |
|
|
0.64 |
|
|
0.62 |
|
|
0.67 |
|
|
0.75 |
| |
|
|
|
|
|
|
|
|
|
|
|
|
|
|
|
|
| Weighted Average Shares Outstanding |
|
|
|
|
|
|
|
|
|
|
|
|
|
|
| |
|
Basic |
|
780,261 |
|
|
764,435 |
|
|
724,880 |
|
|
721,639 |
|
|
720,418 |
| |
|
Diluted |
|
790,244 |
|
|
774,023 |
|
|
734,527 |
|
|
731,511 |
|
|
730,652 |
| BB&T Corporation |
|
|
|
|
|
| Lines of Business Financial Performance - Five Quarter Trend (1) |
|
|
|
|
|
|
|
|
|
|
|
|
|
|
| (Dollars in millions) |
|
|
|
|
|
|
|
|
|
|
|
|
|
|
| |
|
|
Quarter Ended |
| Community Banking |
Dec. 31 |
|
Sept. 30 |
|
June 30 |
|
March 31 |
|
Dec. 31 |
| |
|
|
2015 |
|
2015 |
|
2015 |
|
2015 |
|
2014 |
| Net interest income (expense) |
$ |
493 |
|
$ |
450 |
|
$ |
432 |
|
$ |
426 |
|
$ |
435 |
| Net intersegment interest income (expense) |
|
362 |
|
|
322 |
|
|
305 |
|
|
283 |
|
|
295 |
| |
Segment net interest income |
|
855 |
|
|
772 |
|
|
737 |
|
|
709 |
|
|
730 |
| Allocated provision (benefit) for credit losses |
|
39 |
|
|
4 |
|
|
11 |
|
|
13 |
|
|
20 |
| Noninterest income |
|
301 |
|
|
304 |
|
|
290 |
|
|
271 |
|
|
296 |
| Intersegment net referral fees (expense) |
|
30 |
|
|
35 |
|
|
39 |
|
|
31 |
|
|
33 |
| Noninterest expense |
|
404 |
|
|
382 |
|
|
373 |
|
|
358 |
|
|
337 |
| Amortization of intangibles |
|
5 |
|
|
5 |
|
|
7 |
|
|
6 |
|
|
7 |
| Allocated corporate expenses |
|
309 |
|
|
305 |
|
|
306 |
|
|
305 |
|
|
301 |
| |
Income (loss) before income taxes |
|
429 |
|
|
415 |
|
|
369 |
|
|
329 |
|
|
394 |
| |
Provision (benefit) for income taxes |
|
157 |
|
|
152 |
|
|
135 |
|
|
120 |
|
|
144 |
| |
|
Segment net income (loss) |
$ |
272 |
|
$ |
263 |
|
$ |
234 |
|
$ |
209 |
|
$ |
250 |
| |
|
|
|
|
|
|
|
|
|
|
|
|
|
|
|
|
| Identifiable assets (period end) |
$ |
68,245 |
|
$ |
57,494 |
|
$ |
56,911 |
|
$ |
55,277 |
|
$ |
55,495 |
| |
|
|
|
|
|
|
|
|
|
|
|
|
|
|
|
|
| |
|
|
|
|
|
|
|
|
|
|
|
|
|
|
|
|
| |
|
|
Quarter Ended |
| Residential Mortgage Banking |
Dec. 31 |
|
Sept. 30 |
|
June 30 |
|
March 31 |
|
Dec. 31 |
| |
|
|
2015 |
|
2015 |
|
2015 |
|
2015 |
|
2014 |
| Net interest income (expense) |
$ |
336 |
|
$ |
337 |
|
$ |
343 |
|
$ |
341 |
|
$ |
357 |
| Net intersegment interest income (expense) |
|
(225) |
|
|
(221) |
|
|
(227) |
|
|
(232) |
|
|
(237) |
| |
Segment net interest income |
|
111 |
|
|
116 |
|
|
116 |
|
|
109 |
|
|
120 |
| Allocated provision (benefit) for credit losses |
|
8 |
|
|
10 |
|
|
3 |
|
|
(12) |
|
|
(38) |
| Noninterest income |
|
78 |
|
|
92 |
|
|
101 |
|
|
84 |
|
|
100 |
| Intersegment net referral fees (expense) |
|
1 |
|
|
1 |
|
|
― |
|
|
― |
|
|
1 |
| Noninterest expense |
|
77 |
|
|
83 |
|
|
75 |
|
|
79 |
|
|
104 |
| Amortization of intangibles |
|
― |
|
|
― |
|
|
― |
|
|
― |
|
|
― |
| Allocated corporate expenses |
|
25 |
|
|
22 |
|
|
23 |
|
|
23 |
|
|
23 |
| |
Income (loss) before income taxes |
|
80 |
|
|
94 |
|
|
116 |
|
|
103 |
|
|
132 |
| |
Provision (benefit) for income taxes |
|
31 |
|
|
35 |
|
|
44 |
|
|
39 |
|
|
50 |
| |
|
Segment net income (loss) |
$ |
49 |
|
$ |
59 |
|
$ |
72 |
|
$ |
64 |
|
$ |
82 |
| |
|
|
|
|
|
|
|
|
|
|
|
|
|
|
|
|
| Identifiable assets (period end) |
$ |
33,407 |
|
$ |
32,973 |
|
$ |
34,218 |
|
$ |
34,323 |
|
$ |
34,463 |
| |
|
|
|
|
|
|
|
|
|
|
|
|
|
|
|
|
| |
|
|
|
|
|
|
|
|
|
|
|
|
|
|
|
|
| |
|
|
Quarter Ended |
| Dealer Financial Services |
Dec. 31 |
|
Sept. 30 |
|
June 30 |
|
March 31 |
|
Dec. 31 |
| |
|
|
2015 |
|
2015 |
|
2015 |
|
2015 |
|
2014 |
| Net interest income (expense) |
$ |
231 |
|
$ |
221 |
|
$ |
216 |
|
$ |
213 |
|
$ |
214 |
| Net intersegment interest income (expense) |
|
(39) |
|
|
(38) |
|
|
(38) |
|
|
(38) |
|
|
(42) |
| |
Segment net interest income |
|
192 |
|
|
183 |
|
|
178 |
|
|
175 |
|
|
172 |
| Allocated provision (benefit) for credit losses |
|
78 |
|
|
67 |
|
|
48 |
|
|
61 |
|
|
80 |
| Noninterest income |
|
4 |
|
|
3 |
|
|
― |
|
|
― |
|
|
1 |
| Intersegment net referral fees (expense) |
|
― |
|
|
― |
|
|
― |
|
|
― |
|
|
― |
| Noninterest expense |
|
40 |
|
|
38 |
|
|
41 |
|
|
32 |
|
|
30 |
| Amortization of intangibles |
|
― |
|
|
― |
|
|
― |
|
|
― |
|
|
― |
| Allocated corporate expenses |
|
10 |
|
|
10 |
|
|
10 |
|
|
9 |
|
|
8 |
| |
Income (loss) before income taxes |
|
68 |
|
|
71 |
|
|
79 |
|
|
73 |
|
|
55 |
| |
Provision (benefit) for income taxes |
|
26 |
|
|
27 |
|
|
30 |
|
|
28 |
|
|
21 |
| |
|
Segment net income (loss) |
$ |
42 |
|
$ |
44 |
|
$ |
49 |
|
$ |
45 |
|
$ |
34 |
| |
|
|
|
|
|
|
|
|
|
|
|
|
|
|
|
|
| Identifiable assets (period end) |
$ |
15,130 |
|
$ |
13,794 |
|
$ |
13,906 |
|
$ |
14,012 |
|
$ |
12,821 |
| |
|
|
|
|
|
|
|
|
|
|
|
|
|
|
|
|
| |
|
|
|
|
|
|
|
|
|
|
|
|
|
|
|
|
| |
|
|
Quarter Ended |
| Specialized Lending |
Dec. 31 |
|
Sept. 30 |
|
June 30 |
|
March 31 |
|
Dec. 31 |
| |
|
|
2015 |
|
2015 |
|
2015 |
|
2015 |
|
2014 |
| Net interest income (expense) |
$ |
178 |
|
$ |
172 |
|
$ |
154 |
|
$ |
147 |
|
$ |
148 |
| Net intersegment interest income (expense) |
|
(52) |
|
|
(49) |
|
|
(43) |
|
|
(42) |
|
|
(40) |
| |
Segment net interest income |
|
126 |
|
|
123 |
|
|
111 |
|
|
105 |
|
|
108 |
| Allocated provision (benefit) for credit losses |
|
12 |
|
|
10 |
|
|
7 |
|
|
19 |
|
|
13 |
| Noninterest income |
|
73 |
|
|
60 |
|
|
74 |
|
|
64 |
|
|
69 |
| Intersegment net referral fees (expense) |
|
― |
|
|
― |
|
|
― |
|
|
― |
|
|
― |
| Noninterest expense |
|
71 |
|
|
63 |
|
|
65 |
|
|
57 |
|
|
58 |
| Amortization of intangibles |
|
2 |
|
|
1 |
|
|
1 |
|
|
1 |
|
|
2 |
| Allocated corporate expenses |
|
17 |
|
|
16 |
|
|
16 |
|
|
15 |
|
|
16 |
| |
Income (loss) before income taxes |
|
97 |
|
|
93 |
|
|
96 |
|
|
77 |
|
|
88 |
| |
Provision (benefit) for income taxes |
|
26 |
|
|
24 |
|
|
26 |
|
|
19 |
|
|
23 |
| |
|
Segment net income (loss) |
$ |
71 |
|
$ |
69 |
|
$ |
70 |
|
$ |
58 |
|
$ |
65 |
| |
|
|
|
|
|
|
|
|
|
|
|
|
|
|
|
|
| Identifiable assets (period end) |
$ |
20,732 |
|
$ |
20,098 |
|
$ |
19,561 |
|
$ |
18,661 |
|
$ |
18,218 |
| (1) |
Lines of business results are preliminary. |
| |
|
| BB&T Corporation |
|
|
|
| Lines of Business Financial Performance - Five Quarter Trend (1) |
|
|
|
|
|
|
|
|
|
|
|
|
|
|
| (Dollars in millions) |
|
|
|
|
|
|
|
|
|
|
|
|
|
|
| |
|
|
Quarter Ended |
| Insurance Services |
Dec. 31 |
|
Sept. 30 |
|
June 30 |
|
March 31 |
|
Dec. 31 |
| |
|
|
2015 |
|
2015 |
|
2015 |
|
2015 |
|
2014 |
| Net interest income (expense) |
$ |
― |
|
$ |
1 |
|
$ |
― |
|
$ |
1 |
|
$ |
1 |
| Net intersegment interest income (expense) |
|
2 |
|
|
2 |
|
|
1 |
|
|
2 |
|
|
2 |
| |
Segment net interest income |
|
2 |
|
|
3 |
|
|
1 |
|
|
3 |
|
|
3 |
| Allocated provision (benefit) for credit losses |
|
― |
|
|
― |
|
|
― |
|
|
― |
|
|
― |
| Noninterest income |
|
388 |
|
|
353 |
|
|
425 |
|
|
442 |
|
|
421 |
| Intersegment net referral fees (expense) |
|
― |
|
|
― |
|
|
― |
|
|
― |
|
|
― |
| Noninterest expense |
|
295 |
|
|
284 |
|
|
310 |
|
|
302 |
|
|
281 |
| Amortization of intangibles |
|
12 |
|
|
12 |
|
|
11 |
|
|
12 |
|
|
13 |
| Allocated corporate expenses |
|
24 |
|
|
25 |
|
|
25 |
|
|
25 |
|
|
29 |
| |
Income (loss) before income taxes |
|
59 |
|
|
35 |
|
|
80 |
|
|
106 |
|
|
101 |
| |
Provision (benefit) for income taxes |
|
23 |
|
|
14 |
|
|
27 |
|
|
34 |
|
|
36 |
| |
|
Segment net income (loss) |
$ |
36 |
|
$ |
21 |
|
$ |
53 |
|
$ |
72 |
|
$ |
65 |
| |
|
|
|
|
|
|
|
|
|
|
|
|
|
|
|
|
| Identifiable assets (period end) |
$ |
2,804 |
|
$ |
2,668 |
|
$ |
2,907 |
|
$ |
2,811 |
|
$ |
2,965 |
| |
|
|
|
|
|
|
|
|
|
|
|
|
|
|
|
|
| |
|
|
|
|
|
|
|
|
|
|
|
|
|
|
|
|
| |
|
|
Quarter Ended |
| Financial Services |
Dec. 31 |
|
Sept. 30 |
|
June 30 |
|
March 31 |
|
Dec. 31 |
| |
|
|
2015 |
|
2015 |
|
2015 |
|
2015 |
|
2014 |
| Net interest income (expense) |
$ |
58 |
|
$ |
53 |
|
$ |
53 |
|
$ |
49 |
|
$ |
50 |
| Net intersegment interest income (expense) |
|
86 |
|
|
81 |
|
|
74 |
|
|
72 |
|
|
70 |
| |
Segment net interest income |
|
144 |
|
|
134 |
|
|
127 |
|
|
121 |
|
|
120 |
| Allocated provision (benefit) for credit losses |
|
(3) |
|
|
21 |
|
|
23 |
|
|
24 |
|
|
17 |
| Noninterest income |
|
209 |
|
|
225 |
|
|
212 |
|
|
201 |
|
|
219 |
| Intersegment net referral fees (expense) |
|
11 |
|
|
5 |
|
|
3 |
|
|
3 |
|
|
7 |
| Noninterest expense |
|
167 |
|
|
176 |
|
|
176 |
|
|
161 |
|
|
171 |
| Amortization of intangibles |
|
1 |
|
|
1 |
|
|
― |
|
|
1 |
|
|
― |
| Allocated corporate expenses |
|
34 |
|
|
34 |
|
|
34 |
|
|
33 |
|
|
31 |
| |
Income (loss) before income taxes |
|
165 |
|
|
132 |
|
|
109 |
|
|
106 |
|
|
127 |
| |
Provision (benefit) for income taxes |
|
62 |
|
|
50 |
|
|
41 |
|
|
40 |
|
|
48 |
| |
|
Segment net income (loss) |
$ |
103 |
|
$ |
82 |
|
$ |
68 |
|
$ |
66 |
|
$ |
79 |
| |
|
|
|
|
|
|
|
|
|
|
|
|
|
|
|
|
| Identifiable assets (period end) |
$ |
16,374 |
|
$ |
15,436 |
|
$ |
14,486 |
|
$ |
14,012 |
|
$ |
12,849 |
| |
|
|
|
|
|
|
|
|
|
|
|
|
|
|
|
|
| |
|
|
|
|
|
|
|
|
|
|
|
|
|
|
|
|
| |
|
|
Quarter Ended |
| Other, Treasury & Corporate (2)(3) |
Dec. 31 |
|
Sept. 30 |
|
June 30 |
|
March 31 |
|
Dec. 31 |
| |
|
|
2015 |
|
2015 |
|
2015 |
|
2015 |
|
2014 |
| Net interest income (expense) |
$ |
208 |
|
$ |
230 |
|
$ |
114 |
|
$ |
135 |
|
$ |
130 |
| Net intersegment interest income (expense) |
|
(134) |
|
|
(97) |
|
|
(72) |
|
|
(45) |
|
|
(48) |
| |
Segment net interest income |
|
74 |
|
|
133 |
|
|
42 |
|
|
90 |
|
|
82 |
| Allocated provision (benefit) for credit losses |
|
(5) |
|
|
(9) |
|
|
5 |
|
|
(6) |
|
|
(9) |
| Noninterest income |
|
(38) |
|
|
(49) |
|
|
(83) |
|
|
(65) |
|
|
(84) |
| Intersegment net referral fees (expense) |
|
(42) |
|
|
(41) |
|
|
(42) |
|
|
(34) |
|
|
(41) |
| Noninterest expense |
|
511 |
|
|
539 |
|
|
590 |
|
|
412 |
|
|
391 |
| Amortization of intangibles |
|
12 |
|
|
10 |
|
|
4 |
|
|
1 |
|
|
― |
| Allocated corporate expenses |
|
(419) |
|
|
(412) |
|
|
(414) |
|
|
(410) |
|
|
(408) |
| |
Income (loss) before income taxes |
|
(105) |
|
|
(85) |
|
|
(268) |
|
|
(6) |
|
|
(17) |
| |
Provision (benefit) for income taxes |
|
(74) |
|
|
(80) |
|
|
(223) |
|
|
(39) |
|
|
(45) |
| |
|
Segment net income (loss) |
$ |
(31) |
|
$ |
(5) |
|
$ |
(45) |
|
$ |
33 |
|
$ |
28 |
| |
|
|
|
|
|
|
|
|
|
|
|
|
|
|
|
|
| Identifiable assets (period end) |
$ |
53,255 |
|
$ |
66,346 |
|
$ |
49,028 |
|
$ |
50,132 |
|
$ |
50,023 |
| |
|
|
|
|
|
|
|
|
|
|
|
|
|
|
|
|
| |
|
|
|
|
|
|
|
|
|
|
|
|
|
|
|
|
| |
|
|
Quarter Ended |
| Total BB&T Corporation |
Dec. 31 |
|
Sept. 30 |
|
June 30 |
|
March 31 |
|
Dec. 31 |
| |
|
|
2015 |
|
2015 |
|
2015 |
|
2015 |
|
2014 |
| Net interest income (expense) |
$ |
1,504 |
|
$ |
1,464 |
|
$ |
1,312 |
|
$ |
1,312 |
|
$ |
1,335 |
| Net intersegment interest income (expense) |
|
― |
|
|
― |
|
|
― |
|
|
― |
|
|
― |
| |
Segment net interest income |
|
1,504 |
|
|
1,464 |
|
|
1,312 |
|
|
1,312 |
|
|
1,335 |
| Allocated provision (benefit) for credit losses |
|
129 |
|
|
103 |
|
|
97 |
|
|
99 |
|
|
83 |
| Noninterest income |
|
1,015 |
|
|
988 |
|
|
1,019 |
|
|
997 |
|
|
1,022 |
| Intersegment net referral fees (expense) |
|
― |
|
|
― |
|
|
― |
|
|
― |
|
|
― |
| Noninterest expense |
|
1,565 |
|
|
1,565 |
|
|
1,630 |
|
|
1,401 |
|
|
1,372 |
| Amortization of intangibles |
|
32 |
|
|
29 |
|
|
23 |
|
|
21 |
|
|
22 |
| Allocated corporate expenses |
|
― |
|
|
― |
|
|
― |
|
|
― |
|
|
― |
| |
Income (loss) before income taxes |
|
793 |
|
|
755 |
|
|
581 |
|
|
788 |
|
|
880 |
| |
Provision (benefit) for income taxes |
|
251 |
|
|
222 |
|
|
80 |
|
|
241 |
|
|
277 |
| |
|
Segment net income (loss) |
$ |
542 |
|
$ |
533 |
|
$ |
501 |
|
$ |
547 |
|
$ |
603 |
| |
|
|
|
|
|
|
|
|
|
|
|
|
|
|
|
|
| Identifiable assets (period end) |
$ |
209,947 |
|
$ |
208,809 |
|
$ |
191,017 |
|
$ |
189,228 |
|
$ |
186,834 |
| (1) |
Lines of business results are preliminary. |
| (2) |
Includes financial data from subsidiaries below the quantitative and qualitative thresholds requiring disclosure. |
| (3) |
Includes financial data related to Susquehanna Bancshares, Inc. until the completion of the systems conversion, which occurred
during the fourth quarter of 2015. |
| BB&T Corporation |
|
|
| Consolidated Balance Sheets |
|
|
|
|
|
|
|
|
|
|
|
| (Dollars in millions) |
|
|
|
|
|
|
|
|
|
|
|
| |
|
|
|
|
|
|
|
|
|
|
|
|
|
|
| |
|
|
|
|
|
|
|
|
|
|
|
|
|
|
| |
|
|
|
|
|
|
|
|
|
|
|
|
|
|
| |
|
|
|
As of December 31 |
|
Change |
| |
|
|
|
2015 |
|
2014 |
|
$ |
|
% |
| Assets |
|
|
|
|
|
|
|
|
|
|
|
| |
Cash and due from banks |
$ |
2,123 |
|
$ |
1,639 |
|
$ |
484 |
|
29.5 |
% |
| |
Interest-bearing deposits with banks |
|
1,435 |
|
|
529 |
|
|
906 |
|
171.3 |
|
| |
Federal funds sold and securities purchased under |
|
|
|
|
|
|
|
|
|
|
|
| |
|
resale agreements or similar arrangements |
|
153 |
|
|
157 |
|
|
(4) |
|
(2.5) |
|
| |
Restricted cash |
|
456 |
|
|
374 |
|
|
82 |
|
21.9 |
|
| |
Securities available for sale at fair value |
|
25,297 |
|
|
20,907 |
|
|
4,390 |
|
21.0 |
|
| |
Securities held to maturity at amortized cost |
|
18,530 |
|
|
20,240 |
|
|
(1,710) |
|
(8.4) |
|
| |
Loans and leases: |
|
|
|
|
|
|
|
|
|
|
|
| |
|
Commercial: |
|
|
|
|
|
|
|
|
|
|
|
| |
|
|
Commercial and industrial |
|
48,430 |
|
|
41,454 |
|
|
6,976 |
|
16.8 |
|
| |
|
|
Commercial real estate-income producing properties |
|
13,421 |
|
|
10,722 |
|
|
2,699 |
|
25.2 |
|
| |
|
|
Commercial real estate-construction and development |
|
3,732 |
|
|
2,735 |
|
|
997 |
|
36.5 |
|
| |
|
|
Dealer floor plan |
|
1,215 |
|
|
1,091 |
|
|
124 |
|
11.4 |
|
| |
|
Direct retail lending |
|
11,140 |
|
|
8,146 |
|
|
2,994 |
|
36.8 |
|
| |
|
Sales finance |
|
10,327 |
|
|
9,509 |
|
|
818 |
|
8.6 |
|
| |
|
Revolving credit |
|
2,510 |
|
|
2,460 |
|
|
50 |
|
2.0 |
|
| |
|
Residential mortgage |
|
30,533 |
|
|
31,090 |
|
|
(557) |
|
(1.8) |
|
| |
|
Other lending subsidiaries |
|
13,521 |
|
|
11,462 |
|
|
2,059 |
|
18.0 |
|
| |
|
Acquired from FDIC and PCI |
|
1,122 |
|
|
1,215 |
|
|
(93) |
|
(7.7) |
|
| |
|
|
Total loans and leases held for investment |
|
135,951 |
|
|
119,884 |
|
|
16,067 |
|
13.4 |
|
| |
|
Loans held for sale |
|
1,035 |
|
|
1,423 |
|
|
(388) |
|
(27.3) |
|
| |
|
|
Total loans and leases |
|
136,986 |
|
|
121,307 |
|
|
15,679 |
|
12.9 |
|
| |
Allowance for loan and lease losses |
|
(1,460) |
|
|
(1,474) |
|
|
14 |
|
(0.9) |
|
| |
Premises and equipment |
|
2,007 |
|
|
1,827 |
|
|
180 |
|
9.9 |
|
| |
Goodwill |
|
8,548 |
|
|
6,869 |
|
|
1,679 |
|
24.4 |
|
| |
Core deposit and other intangible assets |
|
686 |
|
|
505 |
|
|
181 |
|
35.8 |
|
| |
Residential mortgage servicing rights at fair value |
|
880 |
|
|
844 |
|
|
36 |
|
4.3 |
|
| |
Other assets |
|
14,306 |
|
|
13,110 |
|
|
1,196 |
|
9.1 |
|
| |
|
Total assets |
$ |
209,947 |
|
$ |
186,834 |
|
$ |
23,113 |
|
12.4 |
% |
| Liabilities and Shareholders' Equity |
|
|
|
|
|
|
|
|
|
|
|
| |
Deposits: |
|
|
|
|
|
|
|
|
|
|
|
| |
|
Noninterest-bearing deposits |
$ |
45,695 |
|
$ |
38,786 |
|
$ |
6,909 |
|
17.8 |
% |
| |
|
Interest checking |
|
25,410 |
|
|
20,262 |
|
|
5,148 |
|
25.4 |
|
| |
|
Money market and savings |
|
60,461 |
|
|
50,604 |
|
|
9,857 |
|
19.5 |
|
| |
|
Time deposits |
|
17,558 |
|
|
19,388 |
|
|
(1,830) |
|
(9.4) |
|
| |
|
|
Total deposits |
|
149,124 |
|
|
129,040 |
|
|
20,084 |
|
15.6 |
|
| |
Short-term borrowings |
|
3,593 |
|
|
3,717 |
|
|
(124) |
|
(3.3) |
|
| |
Long-term debt |
|
23,769 |
|
|
23,312 |
|
|
457 |
|
2.0 |
|
| |
Accounts payable and other liabilities |
|
6,121 |
|
|
6,388 |
|
|
(267) |
|
(4.2) |
|
| |
|
Total liabilities |
|
182,607 |
|
|
162,457 |
|
|
20,150 |
|
12.4 |
|
| |
Shareholders' equity: |
|
|
|
|
|
|
|
|
|
|
|
| |
|
Preferred stock |
|
2,603 |
|
|
2,603 |
|
|
― |
|
― |
|
| |
|
Common stock |
|
3,902 |
|
|
3,603 |
|
|
299 |
|
8.3 |
|
| |
|
Additional paid-in capital |
|
8,365 |
|
|
6,517 |
|
|
1,848 |
|
28.4 |
|
| |
|
Retained earnings |
|
13,464 |
|
|
12,317 |
|
|
1,147 |
|
9.3 |
|
| |
|
Accumulated other comprehensive loss |
|
(1,028) |
|
|
(751) |
|
|
(277) |
|
36.9 |
|
| |
|
Noncontrolling interests |
|
34 |
|
|
88 |
|
|
(54) |
|
(61.4) |
|
| |
|
|
Total shareholders' equity |
|
27,340 |
|
|
24,377 |
|
|
2,963 |
|
12.2 |
|
| |
|
|
Total liabilities and shareholders' equity |
$ |
209,947 |
|
$ |
186,834 |
|
$ |
23,113 |
|
12.4 |
% |
| |
| BB&T Corporation |
|
|
|
|
| Consolidated Balance Sheets - Five Quarter Trend |
|
|
|
|
|
|
|
|
|
|
|
|
|
|
| (Dollars in millions) |
|
|
|
|
|
|
|
|
|
|
|
|
|
|
| |
|
|
|
|
|
|
|
|
|
|
|
|
|
|
|
|
|
| |
|
|
|
As of |
| |
|
|
|
Dec. 31 |
|
Sept. 30 |
|
June 30 |
|
March 31 |
|
Dec. 31 |
| |
|
|
|
2015 |
|
2015 |
|
2015 |
|
2015 |
|
2014 |
| Assets |
|
|
|
|
|
|
|
|
|
|
|
|
|
|
| |
Cash and due from banks |
$ |
2,123 |
|
$ |
1,538 |
|
$ |
1,607 |
|
$ |
1,452 |
|
$ |
1,639 |
| |
Interest-bearing deposits with banks |
|
1,435 |
|
|
1,115 |
|
|
824 |
|
|
325 |
|
|
529 |
| |
Federal funds sold and securities purchased under |
|
|
|
|
|
|
|
|
|
|
|
|
|
|
| |
|
resale agreements or similar arrangements |
|
153 |
|
|
127 |
|
|
190 |
|
|
222 |
|
|
157 |
| |
Restricted cash |
|
456 |
|
|
578 |
|
|
379 |
|
|
513 |
|
|
374 |
| |
Securities available for sale at fair value |
|
25,297 |
|
|
24,249 |
|
|
21,183 |
|
|
21,674 |
|
|
20,907 |
| |
Securities held to maturity at amortized cost |
|
18,530 |
|
|
19,245 |
|
|
19,437 |
|
|
20,415 |
|
|
20,240 |
| |
Loans and leases: |
|
|
|
|
|
|
|
|
|
|
|
|
|
|
| |
|
Commercial: |
|
|
|
|
|
|
|
|
|
|
|
|
|
|
| |
|
|
Commercial and industrial |
|
48,430 |
|
|
48,095 |
|
|
43,607 |
|
|
42,294 |
|
|
41,454 |
| |
|
|
Commercial real estate-income producing properties |
|
13,421 |
|
|
13,313 |
|
|
11,132 |
|
|
10,719 |
|
|
10,722 |
| |
|
|
Commercial real estate-construction and development |
|
3,732 |
|
|
3,807 |
|
|
2,874 |
|
|
2,655 |
|
|
2,735 |
| |
|
|
Dealer floor plan |
|
1,215 |
|
|
1,093 |
|
|
1,066 |
|
|
1,008 |
|
|
1,091 |
| |
|
Direct retail lending |
|
11,140 |
|
|
10,626 |
|
|
8,675 |
|
|
8,288 |
|
|
8,146 |
| |
|
Sales finance |
|
10,327 |
|
|
10,772 |
|
|
9,427 |
|
|
9,605 |
|
|
9,509 |
| |
|
Revolving credit |
|
2,510 |
|
|
2,429 |
|
|
2,407 |
|
|
2,390 |
|
|
2,460 |
| |
|
Residential mortgage |
|
30,533 |
|
|
31,070 |
|
|
30,054 |
|
|
30,533 |
|
|
31,090 |
| |
|
Other lending subsidiaries |
|
13,521 |
|
|
13,235 |
|
|
12,067 |
|
|
11,304 |
|
|
11,462 |
| |
|
Acquired from FDIC and PCI |
|
1,122 |
|
|
1,075 |
|
|
992 |
|
|
1,110 |
|
|
1,215 |
| |
|
|
Total loans and leases held for investment |
|
135,951 |
|
|
135,515 |
|
|
122,301 |
|
|
119,906 |
|
|
119,884 |
| |
|
Loans held for sale |
|
1,035 |
|
|
1,452 |
|
|
2,469 |
|
|
2,121 |
|
|
1,423 |
| |
|
|
Total loans and leases |
|
136,986 |
|
|
136,967 |
|
|
124,770 |
|
|
122,027 |
|
|
121,307 |
| |
Allowance for loan and lease losses |
|
(1,460) |
|
|
(1,458) |
|
|
(1,457) |
|
|
(1,464) |
|
|
(1,474) |
| |
Premises and equipment |
|
2,007 |
|
|
2,038 |
|
|
1,900 |
|
|
1,879 |
|
|
1,827 |
| |
Goodwill |
|
8,548 |
|
|
8,498 |
|
|
7,141 |
|
|
6,950 |
|
|
6,869 |
| |
Core deposit and other intangible assets |
|
686 |
|
|
700 |
|
|
514 |
|
|
530 |
|
|
505 |
| |
Residential mortgage servicing rights at fair value |
|
880 |
|
|
848 |
|
|
912 |
|
|
764 |
|
|
844 |
| |
Other assets |
|
14,306 |
|
|
14,364 |
|
|
13,617 |
|
|
13,941 |
|
|
13,110 |
| |
|
Total assets |
$ |
209,947 |
|
$ |
208,809 |
|
$ |
191,017 |
|
$ |
189,228 |
|
$ |
186,834 |
| Liabilities and Shareholders' Equity |
|
|
|
|
|
|
|
|
|
|
|
|
|
|
| |
Deposits: |
|
|
|
|
|
|
|
|
|
|
|
|
|
|
| |
|
Noninterest-bearing deposits |
$ |
45,695 |
|
$ |
44,700 |
|
$ |
42,234 |
|
$ |
41,414 |
|
$ |
38,786 |
| |
|
Interest checking |
|
25,410 |
|
|
23,574 |
|
|
20,843 |
|
|
21,070 |
|
|
20,262 |
| |
|
Money market and savings |
|
60,461 |
|
|
61,689 |
|
|
55,269 |
|
|
53,198 |
|
|
50,604 |
| |
|
Time deposits |
|
17,558 |
|
|
17,864 |
|
|
14,437 |
|
|
15,547 |
|
|
19,388 |
| |
|
|
Total deposits |
|
149,124 |
|
|
147,827 |
|
|
132,783 |
|
|
131,229 |
|
|
129,040 |
| |
Short-term borrowings |
|
3,593 |
|
|
2,581 |
|
|
3,883 |
|
|
3,130 |
|
|
3,717 |
| |
Long-term debt |
|
23,769 |
|
|
24,883 |
|
|
23,271 |
|
|
23,437 |
|
|
23,312 |
| |
Accounts payable and other liabilities |
|
6,121 |
|
|
6,254 |
|
|
5,948 |
|
|
6,694 |
|
|
6,388 |
| |
|
Total liabilities |
|
182,607 |
|
|
181,545 |
|
|
165,885 |
|
|
164,490 |
|
|
162,457 |
| |
Shareholders' equity: |
|
|
|
|
|
|
|
|
|
|
|
|
|
|
| |
|
Preferred stock |
|
2,603 |
|
|
2,603 |
|
|
2,603 |
|
|
2,603 |
|
|
2,603 |
| |
|
Common stock |
|
3,902 |
|
|
3,901 |
|
|
3,667 |
|
|
3,616 |
|
|
3,603 |
| |
|
Additional paid-in capital |
|
8,365 |
|
|
8,344 |
|
|
6,667 |
|
|
6,524 |
|
|
6,517 |
| |
|
Retained earnings |
|
13,464 |
|
|
13,172 |
|
|
12,891 |
|
|
12,632 |
|
|
12,317 |
| |
|
Accumulated other comprehensive loss |
|
(1,028) |
|
|
(796) |
|
|
(748) |
|
|
(733) |
|
|
(751) |
| |
|
Noncontrolling interests |
|
34 |
|
|
40 |
|
|
52 |
|
|
96 |
|
|
88 |
| |
|
|
Total shareholders' equity |
|
27,340 |
|
|
27,264 |
|
|
25,132 |
|
|
24,738 |
|
|
24,377 |
| |
|
|
Total liabilities and shareholders' equity |
$ |
209,947 |
|
$ |
208,809 |
|
$ |
191,017 |
|
$ |
189,228 |
|
$ |
186,834 |
| BB&T Corporation |
|
|
|
|
|
|
|
|
|
|
|
| Average Balance Sheets |
|
|
|
|
|
|
|
|
|
|
|
|
|
|
|
|
|
|
|
|
|
|
|
| (Dollars in millions) |
|
|
|
|
|
|
|
|
|
|
|
|
|
|
|
|
|
|
|
|
|
|
|
| |
|
|
|
|
|
|
|
|
|
|
|
|
|
|
|
|
|
|
|
|
|
|
|
|
|
|
|
| |
|
|
|
|
|
|
|
|
|
|
|
|
|
|
|
|
|
|
|
|
|
|
|
|
|
|
|
| |
|
|
|
|
|
|
|
|
|
|
|
|
|
|
|
|
|
|
|
|
|
|
|
|
|
|
|
| |
|
|
|
|
Quarter Ended |
|
|
|
|
|
|
|
Year-to-Date |
|
|
|
|
| |
|
|
|
|
December 31 |
|
Change |
|
December 31 |
|
Change |
| |
|
|
|
|
2015 |
|
2014 |
|
$ |
|
% |
|
2015 |
|
2014 |
|
$ |
|
% |
| Assets |
|
|
|
|
|
|
|
|
|
|
|
|
|
|
|
|
|
|
|
|
|
|
|
| |
Securities at amortized cost (1): |
|
|
|
|
|
|
|
|
|
|
|
|
|
|
|
|
|
|
|
|
|
|
|
| |
|
U.S. Treasury |
$ |
2,794 |
|
$ |
2,118 |
|
$ |
676 |
|
31.9 |
% |
|
$ |
2,650 |
|
$ |
1,969 |
|
$ |
681 |
|
34.6 |
% |
| |
|
U.S. government-sponsored entities (GSE) |
|
5,165 |
|
|
5,394 |
|
|
(229) |
|
(4.2) |
|
|
|
5,338 |
|
|
5,516 |
|
|
(178) |
|
(3.2) |
|
| |
|
Mortgage-backed securities issued by GSE |
|
32,442 |
|
|
29,706 |
|
|
2,736 |
|
9.2 |
|
|
|
30,683 |
|
|
29,504 |
|
|
1,179 |
|
4.0 |
|
| |
|
States and political subdivisions |
|
2,019 |
|
|
1,818 |
|
|
201 |
|
11.1 |
|
|
|
1,913 |
|
|
1,827 |
|
|
86 |
|
4.7 |
|
| |
|
Non-agency mortgage-backed |
|
201 |
|
|
235 |
|
|
(34) |
|
(14.5) |
|
|
|
215 |
|
|
246 |
|
|
(31) |
|
(12.6) |
|
| |
|
Other |
|
64 |
|
|
654 |
|
|
(590) |
|
(90.2) |
|
|
|
477 |
|
|
547 |
|
|
(70) |
|
(12.8) |
|
| |
|
Acquired from FDIC |
|
783 |
|
|
892 |
|
|
(109) |
|
(12.2) |
|
|
|
827 |
|
|
932 |
|
|
(105) |
|
(11.3) |
|
| |
|
|
Total securities |
|
43,468 |
|
|
40,817 |
|
|
2,651 |
|
6.5 |
|
|
|
42,103 |
|
|
40,541 |
|
|
1,562 |
|
3.9 |
|
| |
Other earning assets |
|
3,493 |
|
|
1,830 |
|
|
1,663 |
|
90.9 |
|
|
|
2,768 |
|
|
1,881 |
|
|
887 |
|
47.2 |
|
| |
Loans and leases: |
|
|
|
|
|
|
|
|
|
|
|
|
|
|
|
|
|
|
|
|
|
|
|
| |
|
Commercial: |
|
|
|
|
|
|
|
|
|
|
|
|
|
|
|
|
|
|
|
|
|
|
|
| |
|
|
Commercial and industrial |
|
48,047 |
|
|
40,383 |
|
|
7,664 |
|
19.0 |
|
|
|
44,648 |
|
|
39,537 |
|
|
5,111 |
|
12.9 |
|
| |
|
|
CRE-income producing properties |
|
13,264 |
|
|
10,681 |
|
|
2,583 |
|
24.2 |
|
|
|
11,806 |
|
|
10,489 |
|
|
1,317 |
|
12.6 |
|
| |
|
|
CRE-construction and development |
|
3,766 |
|
|
2,772 |
|
|
994 |
|
35.9 |
|
|
|
3,196 |
|
|
2,616 |
|
|
580 |
|
22.2 |
|
| |
|
|
Dealer floor plan |
|
1,164 |
|
|
1,053 |
|
|
111 |
|
10.5 |
|
|
|
1,068 |
|
|
985 |
|
|
83 |
|
8.4 |
|
| |
|
Direct retail lending (2) |
|
10,896 |
|
|
8,085 |
|
|
2,811 |
|
34.8 |
|
|
|
9,375 |
|
|
8,249 |
|
|
1,126 |
|
13.7 |
|
| |
|
Sales finance |
|
10,533 |
|
|
9,194 |
|
|
1,339 |
|
14.6 |
|
|
|
9,975 |
|
|
9,022 |
|
|
953 |
|
10.6 |
|
| |
|
Revolving credit |
|
2,458 |
|
|
2,427 |
|
|
31 |
|
1.3 |
|
|
|
2,406 |
|
|
2,385 |
|
|
21 |
|
0.9 |
|
| |
|
Residential mortgage (2) |
|
30,334 |
|
|
31,046 |
|
|
(712) |
|
(2.3) |
|
|
|
30,252 |
|
|
31,528 |
|
|
(1,276) |
|
(4.0) |
|
| |
|
Other lending subsidiaries |
|
13,281 |
|
|
11,351 |
|
|
1,930 |
|
17.0 |
|
|
|
12,291 |
|
|
10,848 |
|
|
1,443 |
|
13.3 |
|
| |
|
Acquired from FDIC and PCI |
|
1,070 |
|
|
1,309 |
|
|
(239) |
|
(18.3) |
|
|
|
1,083 |
|
|
1,613 |
|
|
(530) |
|
(32.9) |
|
| |
|
|
Total loans and leases held for investment |
|
134,813 |
|
|
118,301 |
|
|
16,512 |
|
14.0 |
|
|
|
126,100 |
|
|
117,272 |
|
|
8,828 |
|
7.5 |
|
| |
|
Loans held for sale |
|
1,377 |
|
|
1,611 |
|
|
(234) |
|
(14.5) |
|
|
|
1,702 |
|
|
1,558 |
|
|
144 |
|
9.2 |
|
| |
|
|
Total loans and leases |
|
136,190 |
|
|
119,912 |
|
|
16,278 |
|
13.6 |
|
|
|
127,802 |
|
|
118,830 |
|
|
8,972 |
|
7.6 |
|
| |
|
|
|
Total earning assets |
|
183,151 |
|
|
162,559 |
|
|
20,592 |
|
12.7 |
|
|
|
172,673 |
|
|
161,252 |
|
|
11,421 |
|
7.1 |
|
| |
Nonearning assets |
|
26,066 |
|
|
23,903 |
|
|
2,163 |
|
9.0 |
|
|
|
24,674 |
|
|
23,843 |
|
|
831 |
|
3.5 |
|
| |
Total assets |
$ |
209,217 |
|
$ |
186,462 |
|
$ |
22,755 |
|
12.2 |
% |
|
$ |
197,347 |
|
$ |
185,095 |
|
$ |
12,252 |
|
6.6 |
% |
| Liabilities and Shareholders' Equity |
|
|
|
|
|
|
|
|
|
|
|
|
|
|
|
|
|
|
|
|
|
|
|
| |
Deposits: |
|
|
|
|
|
|
|
|
|
|
|
|
|
|
|
|
|
|
|
|
|
|
|
| |
|
Noninterest-bearing deposits |
$ |
45,824 |
|
$ |
39,130 |
|
$ |
6,694 |
|
17.1 |
% |
|
$ |
42,816 |
|
$ |
37,327 |
|
$ |
5,489 |
|
14.7 |
% |
| |
|
Interest checking |
|
24,157 |
|
|
19,308 |
|
|
4,849 |
|
25.1 |
|
|
|
22,092 |
|
|
18,731 |
|
|
3,361 |
|
17.9 |
|
| |
|
Money market and savings |
|
61,431 |
|
|
51,176 |
|
|
10,255 |
|
20.0 |
|
|
|
56,592 |
|
|
49,728 |
|
|
6,864 |
|
13.8 |
|
| |
|
Time deposits |
|
16,981 |
|
|
20,041 |
|
|
(3,060) |
|
(15.3) |
|
|
|
16,405 |
|
|
22,569 |
|
|
(6,164) |
|
(27.3) |
|
| |
|
Foreign office deposits - interest-bearing |
|
98 |
|
|
660 |
|
|
(562) |
|
(85.2) |
|
|
|
593 |
|
|
722 |
|
|
(129) |
|
(17.9) |
|
| |
|
|
Total deposits |
|
148,491 |
|
|
130,315 |
|
|
18,176 |
|
13.9 |
|
|
|
138,498 |
|
|
129,077 |
|
|
9,421 |
|
7.3 |
|
| |
Short-term borrowings |
|
2,698 |
|
|
3,095 |
|
|
(397) |
|
(12.8) |
|
|
|
3,221 |
|
|
3,421 |
|
|
(200) |
|
(5.8) |
|
| |
Long-term debt |
|
24,306 |
|
|
22,139 |
|
|
2,167 |
|
9.8 |
|
|
|
23,343 |
|
|
22,210 |
|
|
1,133 |
|
5.1 |
|
| |
Accounts payable and other liabilities |
|
6,344 |
|
|
6,339 |
|
|
5 |
|
0.1 |
|
|
|
6,414 |
|
|
6,433 |
|
|
(19) |
|
(0.3) |
|
| |
|
Total liabilities |
|
181,839 |
|
|
161,888 |
|
|
19,951 |
|
12.3 |
|
|
|
171,476 |
|
|
161,141 |
|
|
10,335 |
|
6.4 |
|
| |
|
Shareholders' equity |
|
27,378 |
|
|
24,574 |
|
|
2,804 |
|
11.4 |
|
|
|
25,871 |
|
|
23,954 |
|
|
1,917 |
|
8.0 |
|
| |
Total liabilities and shareholders' equity |
$ |
209,217 |
|
$ |
186,462 |
|
$ |
22,755 |
|
12.2 |
% |
|
$ |
197,347 |
|
$ |
185,095 |
|
$ |
12,252 |
|
6.6 |
% |
| Average balances exclude basis adjustments for fair value hedges. |
| (1) |
Excludes trading securities. |
| (2) |
During the first quarter of 2014, $8.3 billion of loans were transferred from direct retail lending to residential mortgage. |
| |
| BB&T Corporation |
|
|
| Average Balance Sheets - Five Quarter Trend |
|
|
|
|
|
|
|
|
|
|
|
|
|
|
| (Dollars in millions) |
|
|
|
|
|
|
|
|
|
|
|
|
|
|
| |
|
|
|
|
|
|
|
|
|
|
|
|
|
|
|
|
|
|
| |
|
|
|
|
|
|
|
|
|
|
|
|
|
|
|
|
|
|
| |
|
|
|
|
|
|
|
|
|
|
|
|
|
|
|
|
|
|
| |
|
|
|
|
Quarter Ended |
| |
|
|
|
|
Dec. 31 |
|
Sept. 30 |
|
June 30 |
|
March 31 |
|
Dec. 31 |
| |
|
|
|
|
2015 |
|
2015 |
|
2015 |
|
2015 |
|
2014 |
| Assets |
|
|
|
|
|
|
|
|
|
|
|
|
|
|
| |
Securities at amortized cost (1): |
|
|
|
|
|
|
|
|
|
|
|
|
|
|
| |
|
U.S. Treasury |
$ |
2,794 |
|
$ |
2,745 |
|
$ |
2,561 |
|
$ |
2,497 |
|
$ |
2,118 |
| |
|
U.S. government-sponsored entities (GSE) |
|
5,165 |
|
|
5,395 |
|
|
5,400 |
|
|
5,394 |
|
|
5,394 |
| |
|
Mortgage-backed securities issued by GSE |
|
32,442 |
|
|
31,329 |
|
|
29,245 |
|
|
29,679 |
|
|
29,706 |
| |
|
States and political subdivisions |
|
2,019 |
|
|
1,975 |
|
|
1,834 |
|
|
1,823 |
|
|
1,818 |
| |
|
Non-agency mortgage-backed |
|
201 |
|
|
211 |
|
|
220 |
|
|
228 |
|
|
235 |
| |
|
Other |
|
64 |
|
|
579 |
|
|
623 |
|
|
643 |
|
|
654 |
| |
|
Acquired from FDIC |
|
783 |
|
|
814 |
|
|
844 |
|
|
869 |
|
|
892 |
| |
|
|
Total securities |
|
43,468 |
|
|
43,048 |
|
|
40,727 |
|
|
41,133 |
|
|
40,817 |
| |
Other earning assets |
|
3,493 |
|
|
2,917 |
|
|
2,645 |
|
|
1,999 |
|
|
1,830 |
| |
Loans and leases: |
|
|
|
|
|
|
|
|
|
|
|
|
|
|
| |
|
Commercial: |
|
|
|
|
|
|
|
|
|
|
|
|
|
|
| |
|
|
Commercial and industrial |
|
48,047 |
|
|
46,462 |
|
|
42,541 |
|
|
41,448 |
|
|
40,383 |
| |
|
|
Commercial real estate-income producing properties |
|
13,264 |
|
|
12,514 |
|
|
10,730 |
|
|
10,680 |
|
|
10,681 |
| |
|
|
Commercial real estate-construction and development |
|
3,766 |
|
|
3,502 |
|
|
2,767 |
|
|
2,734 |
|
|
2,772 |
| |
|
|
Dealer floor plan |
|
1,164 |
|
|
1,056 |
|
|
1,010 |
|
|
1,040 |
|
|
1,053 |
| |
|
Direct retail lending |
|
10,896 |
|
|
9,926 |
|
|
8,449 |
|
|
8,191 |
|
|
8,085 |
| |
|
Sales finance |
|
10,533 |
|
|
10,386 |
|
|
9,507 |
|
|
9,458 |
|
|
9,194 |
| |
|
Revolving credit |
|
2,458 |
|
|
2,421 |
|
|
2,365 |
|
|
2,385 |
|
|
2,427 |
| |
|
Residential mortgage |
|
30,334 |
|
|
30,384 |
|
|
29,862 |
|
|
30,427 |
|
|
31,046 |
| |
|
Other lending subsidiaries |
|
13,281 |
|
|
12,837 |
|
|
11,701 |
|
|
11,318 |
|
|
11,351 |
| |
|
Acquired from FDIC and PCI |
|
1,070 |
|
|
1,052 |
|
|
1,055 |
|
|
1,156 |
|
|
1,309 |
| |
|
|
Total loans and leases held for investment |
|
134,813 |
|
|
130,540 |
|
|
119,987 |
|
|
118,837 |
|
|
118,301 |
| |
|
Loans held for sale |
|
1,377 |
|
|
1,959 |
|
|
2,069 |
|
|
1,398 |
|
|
1,611 |
| |
|
|
Total loans and leases |
|
136,190 |
|
|
132,499 |
|
|
122,056 |
|
|
120,235 |
|
|
119,912 |
| |
|
|
|
Total earning assets |
|
183,151 |
|
|
178,464 |
|
|
165,428 |
|
|
163,367 |
|
|
162,559 |
| |
Nonearning assets |
|
26,066 |
|
|
25,067 |
|
|
23,605 |
|
|
23,930 |
|
|
23,903 |
| |
Total assets |
$ |
209,217 |
|
$ |
203,531 |
|
$ |
189,033 |
|
$ |
187,297 |
|
$ |
186,462 |
| Liabilities and Shareholders' Equity |
|
|
|
|
|
|
|
|
|
|
|
|
|
|
| |
Deposits: |
|
|
|
|
|
|
|
|
|
|
|
|
|
|
| |
|
Noninterest-bearing deposits |
$ |
45,824 |
|
$ |
44,153 |
|
$ |
41,502 |
|
$ |
39,701 |
|
$ |
39,130 |
| |
|
Interest checking |
|
24,157 |
|
|
22,593 |
|
|
20,950 |
|
|
20,623 |
|
|
19,308 |
| |
|
Money market and savings |
|
61,431 |
|
|
59,306 |
|
|
53,852 |
|
|
51,644 |
|
|
51,176 |
| |
|
Time deposits |
|
16,981 |
|
|
16,837 |
|
|
14,800 |
|
|
17,000 |
|
|
20,041 |
| |
|
Foreign office deposits - interest-bearing |
|
98 |
|
|
948 |
|
|
764 |
|
|
563 |
|
|
660 |
| |
|
|
Total deposits |
|
148,491 |
|
|
143,837 |
|
|
131,868 |
|
|
129,531 |
|
|
130,315 |
| |
Short-term borrowings |
|
2,698 |
|
|
3,572 |
|
|
3,080 |
|
|
3,539 |
|
|
3,095 |
| |
Long-term debt |
|
24,306 |
|
|
23,394 |
|
|
22,616 |
|
|
23,043 |
|
|
22,139 |
| |
Accounts payable and other liabilities |
|
6,344 |
|
|
6,116 |
|
|
6,581 |
|
|
6,618 |
|
|
6,339 |
| |
|
Total liabilities |
|
181,839 |
|
|
176,919 |
|
|
164,145 |
|
|
162,731 |
|
|
161,888 |
| |
Shareholders' equity |
|
27,378 |
|
|
26,612 |
|
|
24,888 |
|
|
24,566 |
|
|
24,574 |
| |
Total liabilities and shareholders' equity |
$ |
209,217 |
|
$ |
203,531 |
|
$ |
189,033 |
|
$ |
187,297 |
|
$ |
186,462 |
| Average balances exclude basis adjustments for fair value hedges. |
| (1) |
Excludes trading securities. |
| BB&T Corporation |
|
|
| Average Balances and Rates - Quarters |
|
|
|
|
|
|
|
|
|
|
|
|
|
|
|
| (Dollars in millions) |
|
|
|
|
|
|
|
|
|
|
|
|
|
|
|
| |
|
|
|
|
|
|
|
|
|
|
|
|
|
|
|
|
|
|
|
| |
|
|
|
|
Quarter Ended |
| |
|
|
|
|
December 31, 2015 |
|
September 30, 2015 |
| |
|
|
|
|
(1) |
|
Interest |
(2) |
|
(1) |
|
Interest |
(2) |
| |
|
|
|
|
Average |
|
Income/ |
Yields/ |
|
Average |
|
Income/ |
Yields/ |
| |
|
|
|
|
Balances |
|
Expense |
Rates |
|
Balances |
|
Expense |
Rates |
| Assets |
|
|
|
|
|
|
|
|
|
|
|
|
|
|
|
| |
Securities at amortized cost (3): |
|
|
|
|
|
|
|
|
|
|
|
|
|
|
|
| |
|
U.S. Treasury |
$ |
2,794 |
|
$ |
12 |
1.67 |
% |
|
$ |
2,745 |
|
$ |
11 |
1.60 |
% |
| |
|
U.S. government-sponsored entities (GSE) |
|
5,165 |
|
|
27 |
2.12 |
|
|
|
5,395 |
|
|
29 |
2.13 |
|
| |
|
Mortgage-backed securities issued by GSE |
|
32,442 |
|
|
156 |
1.94 |
|
|
|
31,329 |
|
|
147 |
1.89 |
|
| |
|
States and political subdivisions |
|
2,019 |
|
|
28 |
5.42 |
|
|
|
1,975 |
|
|
27 |
5.49 |
|
| |
|
Non-agency mortgage-backed |
|
201 |
|
|
5 |
8.53 |
|
|
|
211 |
|
|
4 |
8.45 |
|
| |
|
Other |
|
64 |
|
|
― |
1.25 |
|
|
|
579 |
|
|
3 |
1.42 |
|
| |
|
Acquired from FDIC |
|
783 |
|
|
22 |
11.34 |
|
|
|
814 |
|
|
24 |
11.57 |
|
| |
|
|
Total securities |
|
43,468 |
|
|
250 |
2.30 |
|
|
|
43,048 |
|
|
245 |
2.27 |
|
| |
Other earning assets |
|
3,493 |
|
|
8 |
0.90 |
|
|
|
2,917 |
|
|
7 |
0.97 |
|
| |
Loans and leases: |
|
|
|
|
|
|
|
|
|
|
|
|
|
|
|
| |
|
Commercial: |
|
|
|
|
|
|
|
|
|
|
|
|
|
|
|
| |
|
|
Commercial and industrial |
|
48,047 |
|
|
387 |
3.20 |
|
|
|
46,462 |
|
|
386 |
3.30 |
|
| |
|
|
Commercial real estate-income producing properties |
|
13,264 |
|
|
135 |
4.02 |
|
|
|
12,514 |
|
|
118 |
3.74 |
|
| |
|
|
Commercial real estate-construction and development |
|
3,766 |
|
|
36 |
3.80 |
|
|
|
3,502 |
|
|
33 |
3.73 |
|
| |
|
|
Dealer floor plan |
|
1,164 |
|
|
6 |
1.89 |
|
|
|
1,056 |
|
|
4 |
1.91 |
|
| |
|
Direct retail lending |
|
10,896 |
|
|
108 |
3.97 |
|
|
|
9,926 |
|
|
105 |
4.18 |
|
| |
|
Sales finance |
|
10,533 |
|
|
76 |
2.86 |
|
|
|
10,386 |
|
|
83 |
3.14 |
|
| |
|
Revolving credit |
|
2,458 |
|
|
55 |
8.81 |
|
|
|
2,421 |
|
|
53 |
8.70 |
|
| |
|
Residential mortgage |
|
30,334 |
|
|
316 |
4.17 |
|
|
|
30,384 |
|
|
319 |
4.18 |
|
| |
|
Other lending subsidiaries |
|
13,281 |
|
|
287 |
8.57 |
|
|
|
12,837 |
|
|
276 |
8.56 |
|
| |
|
Acquired from FDIC and PCI |
|
1,070 |
|
|
56 |
20.85 |
|
|
|
1,052 |
|
|
40 |
14.87 |
|
| |
|
|
Total loans and leases held for investment |
|
134,813 |
|
|
1,462 |
4.31 |
|
|
|
130,540 |
|
|
1,417 |
4.31 |
|
| |
|
Loans held for sale |
|
1,377 |
|
|
13 |
3.73 |
|
|
|
1,959 |
|
|
18 |
3.75 |
|
| |
|
|
Total loans and leases |
|
136,190 |
|
|
1,475 |
4.31 |
|
|
|
132,499 |
|
|
1,435 |
4.31 |
|
| |
|
|
|
Total earning assets |
|
183,151 |
|
|
1,733 |
3.77 |
|
|
|
178,464 |
|
|
1,687 |
3.76 |
|
| |
Nonearning assets |
|
26,066 |
|
|
|
|
|
|
|
25,067 |
|
|
|
|
|
| |
Total assets |
$ |
209,217 |
|
|
|
|
|
|
$ |
203,531 |
|
|
|
|
|
| |
|
|
|
|
|
|
|
|
|
|
|
|
|
|
|
|
|
|
|
| Liabilities and Shareholders' Equity |
|
|
|
|
|
|
|
|
|
|
|
|
|
|
|
| |
Interest-bearing deposits: |
|
|
|
|
|
|
|
|
|
|
|
|
|
|
|
| |
|
Interest checking |
$ |
24,157 |
|
|
6 |
0.09 |
|
|
$ |
22,593 |
|
|
4 |
0.08 |
|
| |
|
Money market and savings |
|
61,431 |
|
|
32 |
0.21 |
|
|
|
59,306 |
|
|
30 |
0.20 |
|
| |
|
Time deposits |
|
16,981 |
|
|
24 |
0.58 |
|
|
|
16,837 |
|
|
26 |
0.61 |
|
| |
|
Foreign office deposits - interest-bearing |
|
98 |
|
|
― |
0.34 |
|
|
|
948 |
|
|
1 |
0.13 |
|
| |
|
|
Total interest-bearing deposits |
|
102,667 |
|
|
62 |
0.24 |
|
|
|
99,684 |
|
|
61 |
0.24 |
|
| |
Short-term borrowings |
|
2,698 |
|
|
1 |
0.17 |
|
|
|
3,572 |
|
|
2 |
0.15 |
|
| |
Long-term debt |
|
24,306 |
|
|
128 |
2.11 |
|
|
|
23,394 |
|
|
123 |
2.12 |
|
| |
|
Total interest-bearing liabilities |
|
129,671 |
|
|
191 |
0.59 |
|
|
|
126,650 |
|
|
186 |
0.59 |
|
| |
Noninterest-bearing deposits |
|
45,824 |
|
|
|
|
|
|
|
44,153 |
|
|
|
|
|
| |
Accounts payable and other liabilities |
|
6,344 |
|
|
|
|
|
|
|
6,116 |
|
|
|
|
|
| |
Shareholders' equity |
|
27,378 |
|
|
|
|
|
|
|
26,612 |
|
|
|
|
|
| |
Total liabilities and shareholders' equity |
$ |
209,217 |
|
|
|
|
|
|
$ |
203,531 |
|
|
|
|
|
| |
|
|
|
|
|
|
|
|
|
|
|
|
|
|
|
|
|
|
|
| |
Average interest-rate spread |
|
|
|
|
|
3.18 |
|
|
|
|
|
|
|
3.17 |
|
| |
|
|
|
|
|
|
|
|
|
|
|
|
|
|
|
|
|
|
|
| |
Net interest income / net interest margin |
|
|
|
$ |
1,542 |
3.35 |
% |
|
|
|
|
$ |
1,501 |
3.35 |
% |
| |
|
|
|
|
|
|
|
|
|
|
|
|
|
|
|
|
|
|
|
| |
Taxable-equivalent adjustment |
|
|
|
$ |
38 |
|
|
|
|
|
|
$ |
37 |
|
|
| |
|
|
|
|
|
|
|
|
|
|
|
|
|
|
|
|
|
|
|
| Applicable ratios are annualized. |
| (1) |
Excludes basis adjustments for fair value hedges. |
| (2) |
Yields are on a fully taxable-equivalent basis. |
| (3) |
Excludes trading securities. |
| BB&T Corporation |
|
|
|
|
|
|
|
|
|
|
| Average Balances and Rates - Quarters |
|
|
|
|
|
|
|
|
|
|
|
|
|
|
|
|
|
|
|
|
|
|
|
| (Dollars in millions) |
|
|
|
|
|
|
|
|
|
|
|
|
|
|
|
|
|
|
|
|
|
|
|
| |
|
|
|
|
|
|
|
|
|
|
|
|
|
|
|
|
|
|
|
|
|
|
|
|
|
|
|
| |
|
|
|
|
Quarter Ended |
| |
|
|
|
|
June 30, 2015 |
|
March 31, 2015 |
|
December 31, 2014 |
| |
|
|
|
|
(1) |
|
Interest |
(2) |
|
(1) |
|
Interest |
(2) |
|
(1) |
|
Interest |
(2) |
| |
|
|
|
|
Average |
|
Income/ |
Yields/ |
|
Average |
|
Income/ |
Yields/ |
|
Average |
|
Income/ |
Yields/ |
| |
|
|
|
|
Balances |
|
Expense |
Rates |
|
Balances |
|
Expense |
Rates |
|
Balances |
|
Expense |
Rates |
| Assets |
|
|
|
|
|
|
|
|
|
|
|
|
|
|
|
|
|
|
|
|
|
|
|
| |
Securities at amortized cost (3): |
|
|
|
|
|
|
|
|
|
|
|
|
|
|
|
|
|
|
|
|
|
|
|
| |
|
U.S. Treasury |
$ |
2,561 |
|
$ |
10 |
1.56 |
% |
|
$ |
2,497 |
|
$ |
9 |
1.49 |
% |
|
$ |
2,118 |
|
$ |
9 |
1.54 |
% |
| |
|
U.S. government-sponsored entities (GSE) |
|
5,400 |
|
|
28 |
2.13 |
|
|
|
5,394 |
|
|
29 |
2.13 |
|
|
|
5,394 |
|
|
29 |
2.13 |
|
| |
|
Mortgage-backed securities issued by GSE |
|
29,245 |
|
|
149 |
2.05 |
|
|
|
29,679 |
|
|
153 |
2.04 |
|
|
|
29,706 |
|
|
148 |
2.01 |
|
| |
|
States and political subdivisions |
|
1,834 |
|
|
27 |
5.80 |
|
|
|
1,823 |
|
|
26 |
5.80 |
|
|
|
1,818 |
|
|
27 |
5.81 |
|
| |
|
Non-agency mortgage-backed |
|
220 |
|
|
5 |
7.88 |
|
|
|
228 |
|
|
4 |
7.87 |
|
|
|
235 |
|
|
5 |
7.81 |
|
| |
|
Other |
|
623 |
|
|
2 |
1.11 |
|
|
|
643 |
|
|
2 |
1.39 |
|
|
|
654 |
|
|
2 |
1.42 |
|
| |
|
Acquired from FDIC |
|
844 |
|
|
24 |
11.36 |
|
|
|
869 |
|
|
31 |
14.46 |
|
|
|
892 |
|
|
31 |
13.77 |
|
| |
|
|
Total securities |
|
40,727 |
|
|
245 |
2.41 |
|
|
|
41,133 |
|
|
254 |
2.47 |
|
|
|
40,817 |
|
|
251 |
2.45 |
|
| |
Other earning assets |
|
2,645 |
|
|
7 |
1.19 |
|
|
|
1,999 |
|
|
16 |
3.13 |
|
|
|
1,830 |
|
|
9 |
1.92 |
|
| |
Loans and leases: |
|
|
|
|
|
|
|
|
|
|
|
|
|
|
|
|
|
|
|
|
|
|
|
| |
|
Commercial: |
|
|
|
|
|
|
|
|
|
|
|
|
|
|
|
|
|
|
|
|
|
|
|
| |
|
|
Commercial and industrial |
|
42,541 |
|
|
335 |
3.15 |
|
|
|
41,448 |
|
|
326 |
3.19 |
|
|
|
40,383 |
|
|
332 |
3.27 |
|
| |
|
|
CRE-income producing properties |
|
10,730 |
|
|
90 |
3.37 |
|
|
|
10,680 |
|
|
89 |
3.39 |
|
|
|
10,681 |
|
|
93 |
3.43 |
|
| |
|
|
CRE-construction and development |
|
2,767 |
|
|
23 |
3.31 |
|
|
|
2,734 |
|
|
22 |
3.32 |
|
|
|
2,772 |
|
|
24 |
3.38 |
|
| |
|
|
Dealer floor plan |
|
1,010 |
|
|
5 |
1.81 |
|
|
|
1,040 |
|
|
5 |
1.80 |
|
|
|
1,053 |
|
|
5 |
1.83 |
|
| |
|
Direct retail lending |
|
8,449 |
|
|
86 |
4.04 |
|
|
|
8,191 |
|
|
82 |
4.08 |
|
|
|
8,085 |
|
|
78 |
3.89 |
|
| |
|
Sales finance |
|
9,507 |
|
|
64 |
2.70 |
|
|
|
9,458 |
|
|
63 |
2.72 |
|
|
|
9,194 |
|
|
64 |
2.77 |
|
| |
|
Revolving credit |
|
2,365 |
|
|
51 |
8.68 |
|
|
|
2,385 |
|
|
52 |
8.85 |
|
|
|
2,427 |
|
|
54 |
8.72 |
|
| |
|
Residential mortgage |
|
29,862 |
|
|
308 |
4.14 |
|
|
|
30,427 |
|
|
312 |
4.11 |
|
|
|
31,046 |
|
|
324 |
4.17 |
|
| |
|
Other lending subsidiaries |
|
11,701 |
|
|
255 |
8.72 |
|
|
|
11,318 |
|
|
249 |
8.92 |
|
|
|
11,351 |
|
|
252 |
8.81 |
|
| |
|
Acquired from FDIC and PCI |
|
1,055 |
|
|
38 |
14.66 |
|
|
|
1,156 |
|
|
45 |
15.85 |
|
|
|
1,309 |
|
|
52 |
15.93 |
|
| |
|
|
Total loans and leases held for investment |
|
119,987 |
|
|
1,255 |
4.19 |
|
|
|
118,837 |
|
|
1,245 |
4.24 |
|
|
|
118,301 |
|
|
1,278 |
4.30 |
|
| |
|
Loans held for sale |
|
2,069 |
|
|
18 |
3.48 |
|
|
|
1,398 |
|
|
13 |
3.61 |
|
|
|
1,611 |
|
|
16 |
3.91 |
|
| |
|
|
Total loans and leases |
|
122,056 |
|
|
1,273 |
4.18 |
|
|
|
120,235 |
|
|
1,258 |
4.23 |
|
|
|
119,912 |
|
|
1,294 |
4.29 |
|
| |
|
|
|
Total earning assets |
|
165,428 |
|
|
1,525 |
3.69 |
|
|
|
163,367 |
|
|
1,528 |
3.77 |
|
|
|
162,559 |
|
|
1,554 |
3.80 |
|
| |
Nonearning assets |
|
23,605 |
|
|
|
|
|
|
|
23,930 |
|
|
|
|
|
|
|
23,903 |
|
|
|
|
|
| |
Total assets |
$ |
189,033 |
|
|
|
|
|
|
$ |
187,297 |
|
|
|
|
|
|
$ |
186,462 |
|
|
|
|
|
| |
|
|
|
|
|
|
|
|
|
|
|
|
|
|
|
|
|
|
|
|
|
|
|
|
|
|
|
| Liabilities and Shareholders' Equity |
|
|
|
|
|
|
|
|
|
|
|
|
|
|
|
|
|
|
|
|
|
|
|
| |
Interest-bearing deposits: |
|
|
|
|
|
|
|
|
|
|
|
|
|
|
|
|
|
|
|
|
|
|
|
| |
|
Interest checking |
$ |
20,950 |
|
|
4 |
0.08 |
|
|
$ |
20,623 |
|
|
4 |
0.07 |
|
|
$ |
19,308 |
|
|
4 |
0.07 |
|
| |
|
Money market and savings |
|
53,852 |
|
|
23 |
0.18 |
|
|
|
51,644 |
|
|
22 |
0.17 |
|
|
|
51,176 |
|
|
21 |
0.17 |
|
| |
|
Time deposits |
|
14,800 |
|
|
28 |
0.72 |
|
|
|
17,000 |
|
|
29 |
0.71 |
|
|
|
20,041 |
|
|
32 |
0.66 |
|
| |
|
Foreign office deposits - interest-bearing |
|
764 |
|
|
― |
0.09 |
|
|
|
563 |
|
|
― |
0.08 |
|
|
|
660 |
|
|
1 |
0.08 |
|
| |
|
|
Total interest-bearing deposits |
|
90,366 |
|
|
55 |
0.24 |
|
|
|
89,830 |
|
|
55 |
0.25 |
|
|
|
91,185 |
|
|
58 |
0.25 |
|
| |
Short-term borrowings |
|
3,080 |
|
|
1 |
0.16 |
|
|
|
3,539 |
|
|
1 |
0.11 |
|
|
|
3,095 |
|
|
1 |
0.14 |
|
| |
Long-term debt |
|
22,616 |
|
|
121 |
2.14 |
|
|
|
23,043 |
|
|
125 |
2.18 |
|
|
|
22,139 |
|
|
124 |
2.22 |
|
| |
|
Total interest-bearing liabilities |
|
116,062 |
|
|
177 |
0.61 |
|
|
|
116,412 |
|
|
181 |
0.63 |
|
|
|
116,419 |
|
|
183 |
0.62 |
|
| |
Noninterest-bearing deposits |
|
41,502 |
|
|
|
|
|
|
|
39,701 |
|
|
|
|
|
|
|
39,130 |
|
|
|
|
|
| |
Accounts payable and other liabilities |
|
6,581 |
|
|
|
|
|
|
|
6,618 |
|
|
|
|
|
|
|
6,339 |
|
|
|
|
|
| |
Shareholders' equity |
|
24,888 |
|
|
|
|
|
|
|
24,566 |
|
|
|
|
|
|
|
24,574 |
|
|
|
|
|
| |
Total liabilities and shareholders' equity |
$ |
189,033 |
|
|
|
|
|
|
$ |
187,297 |
|
|
|
|
|
|
$ |
186,462 |
|
|
|
|
|
| |
|
|
|
|
|
|
|
|
|
|
|
|
|
|
|
|
|
|
|
|
|
|
|
|
|
|
|
| |
Average interest-rate spread |
|
|
|
|
|
3.08 |
|
|
|
|
|
|
|
3.14 |
|
|
|
|
|
|
|
3.18 |
|
| |
|
|
|
|
|
|
|
|
|
|
|
|
|
|
|
|
|
|
|
|
|
|
|
|
|
|
|
| |
Net interest income / net interest margin |
|
|
|
$ |
1,348 |
3.27 |
% |
|
|
|
|
$ |
1,347 |
3.33 |
% |
|
|
|
|
$ |
1,371 |
3.36 |
% |
| |
|
|
|
|
|
|
|
|
|
|
|
|
|
|
|
|
|
|
|
|
|
|
|
|
|
|
|
| |
Taxable-equivalent adjustment |
|
|
|
$ |
36 |
|
|
|
|
|
|
$ |
35 |
|
|
|
|
|
|
$ |
36 |
|
|
| |
|
|
|
|
|
|
|
|
|
|
|
|
|
|
|
|
|
|
|
|
|
|
|
|
|
|
|
| Applicable ratios are annualized. |
| (1) |
Excludes basis adjustments for fair value hedges. |
| (2) |
Yields are on a fully taxable-equivalent basis. |
| (3) |
Excludes trading securities. |
| BB&T Corporation |
|
|
| Average Balances and Rates - Year-To-Date |
|
|
|
|
|
|
|
|
|
|
|
|
|
|
|
| (Dollars in millions) |
|
|
|
|
|
|
|
|
|
|
|
|
|
|
|
| |
|
|
|
|
|
|
|
|
|
|
|
|
|
|
|
|
|
|
|
| |
|
|
|
|
Year-to-Date |
| |
|
|
|
|
December 31, 2015 |
|
December 31, 2014 |
| |
|
|
|
|
(1) |
|
Interest |
(2) |
|
(1) |
|
Interest |
(2) |
| |
|
|
|
|
Average |
|
Income/ |
Yields/ |
|
Average |
|
Income/ |
Yields/ |
| |
|
|
|
|
Balances |
|
Expense |
Rates |
|
Balances |
|
Expense |
Rates |
| Assets |
|
|
|
|
|
|
|
|
|
|
|
|
|
|
|
| |
Securities at amortized cost (3): |
|
|
|
|
|
|
|
|
|
|
|
|
|
|
|
| |
|
U.S. Treasury |
$ |
2,650 |
|
$ |
42 |
1.58 |
% |
|
$ |
1,969 |
|
$ |
30 |
1.51 |
% |
| |
|
U.S. government-sponsored entities (GSE) |
|
5,338 |
|
|
113 |
2.13 |
|
|
|
5,516 |
|
|
116 |
2.10 |
|
| |
|
Mortgage-backed securities issued by GSE |
|
30,683 |
|
|
605 |
1.98 |
|
|
|
29,504 |
|
|
589 |
2.00 |
|
| |
|
States and political subdivisions |
|
1,913 |
|
|
108 |
5.62 |
|
|
|
1,827 |
|
|
106 |
5.78 |
|
| |
|
Non-agency mortgage-backed |
|
215 |
|
|
18 |
8.17 |
|
|
|
246 |
|
|
19 |
7.55 |
|
| |
|
Other |
|
477 |
|
|
7 |
1.31 |
|
|
|
547 |
|
|
8 |
1.43 |
|
| |
|
Acquired from FDIC |
|
827 |
|
|
101 |
12.22 |
|
|
|
932 |
|
|
125 |
13.35 |
|
| |
|
|
Total securities |
|
42,103 |
|
|
994 |
2.36 |
|
|
|
40,541 |
|
|
993 |
2.45 |
|
| |
Other earning assets |
|
2,768 |
|
|
38 |
1.39 |
|
|
|
1,881 |
|
|
40 |
2.13 |
|
| |
Loans and leases: |
|
|
|
|
|
|
|
|
|
|
|
|
|
|
|
| |
|
Commercial: |
|
|
|
|
|
|
|
|
|
|
|
|
|
|
|
| |
|
|
Commercial and industrial |
|
44,648 |
|
|
1,434 |
3.21 |
|
|
|
39,537 |
|
|
1,325 |
3.35 |
|
| |
|
|
CRE-income producing properties |
|
11,806 |
|
|
432 |
3.66 |
|
|
|
10,489 |
|
|
366 |
3.49 |
|
| |
|
|
CRE-construction and development |
|
3,196 |
|
|
114 |
3.57 |
|
|
|
2,616 |
|
|
92 |
3.51 |
|
| |
|
|
Dealer floor plan |
|
1,068 |
|
|
20 |
1.85 |
|
|
|
985 |
|
|
18 |
1.87 |
|
| |
|
Direct retail lending (4) |
|
9,375 |
|
|
381 |
4.07 |
|
|
|
8,249 |
|
|
338 |
4.10 |
|
| |
|
Sales finance |
|
9,975 |
|
|
286 |
2.86 |
|
|
|
9,022 |
|
|
253 |
2.80 |
|
| |
|
Revolving credit |
|
2,406 |
|
|
211 |
8.76 |
|
|
|
2,385 |
|
|
208 |
8.70 |
|
| |
|
Residential mortgage (4) |
|
30,252 |
|
|
1,255 |
4.15 |
|
|
|
31,528 |
|
|
1,325 |
4.20 |
|
| |
|
Other lending subsidiaries |
|
12,291 |
|
|
1,067 |
8.68 |
|
|
|
10,848 |
|
|
985 |
9.08 |
|
| |
|
Acquired from FDIC and PCI |
|
1,083 |
|
|
179 |
16.57 |
|
|
|
1,613 |
|
|
278 |
17.22 |
|
| |
|
|
Total loans and leases held for investment |
|
126,100 |
|
|
5,379 |
4.27 |
|
|
|
117,272 |
|
|
5,188 |
4.42 |
|
| |
|
Loans held for sale |
|
1,702 |
|
|
62 |
3.63 |
|
|
|
1,558 |
|
|
65 |
4.19 |
|
| |
|
|
Total loans and leases |
|
127,802 |
|
|
5,441 |
4.26 |
|
|
|
118,830 |
|
|
5,253 |
4.42 |
|
| |
|
|
|
Total earning assets |
|
172,673 |
|
|
6,473 |
3.75 |
|
|
|
161,252 |
|
|
6,286 |
3.90 |
|
| |
Nonearning assets |
|
24,674 |
|
|
|
|
|
|
|
23,843 |
|
|
|
|
|
| |
Total assets |
$ |
197,347 |
|
|
|
|
|
|
$ |
185,095 |
|
|
|
|
|
| |
|
|
|
|
|
|
|
|
|
|
|
|
|
|
|
|
|
|
|
| Liabilities and Shareholders' Equity |
|
|
|
|
|
|
|
|
|
|
|
|
|
|
|
| |
Interest-bearing deposits: |
|
|
|
|
|
|
|
|
|
|
|
|
|
|
|
| |
|
Interest checking |
$ |
22,092 |
|
|
18 |
0.08 |
|
|
$ |
18,731 |
|
|
13 |
0.07 |
|
| |
|
Money market and savings |
|
56,592 |
|
|
107 |
0.19 |
|
|
|
49,728 |
|
|
74 |
0.15 |
|
| |
|
Time deposits |
|
16,405 |
|
|
107 |
0.66 |
|
|
|
22,569 |
|
|
151 |
0.67 |
|
| |
|
Foreign office deposits - interest-bearing |
|
593 |
|
|
1 |
0.12 |
|
|
|
722 |
|
|
1 |
0.07 |
|
| |
|
|
Total interest-bearing deposits |
|
95,682 |
|
|
233 |
0.24 |
|
|
|
91,750 |
|
|
239 |
0.26 |
|
| |
Short-term borrowings |
|
3,221 |
|
|
5 |
0.15 |
|
|
|
3,421 |
|
|
5 |
0.13 |
|
| |
Long-term debt |
|
23,343 |
|
|
497 |
2.13 |
|
|
|
22,210 |
|
|
525 |
2.36 |
|
| |
|
Total interest-bearing liabilities |
|
122,246 |
|
|
735 |
0.60 |
|
|
|
117,381 |
|
|
769 |
0.65 |
|
| |
Noninterest-bearing deposits |
|
42,816 |
|
|
|
|
|
|
|
37,327 |
|
|
|
|
|
| |
Accounts payable and other liabilities |
|
6,414 |
|
|
|
|
|
|
|
6,433 |
|
|
|
|
|
| |
Shareholders' equity |
|
25,871 |
|
|
|
|
|
|
|
23,954 |
|
|
|
|
|
| |
Total liabilities and shareholders' equity |
$ |
197,347 |
|
|
|
|
|
|
$ |
185,095 |
|
|
|
|
|
| |
|
|
|
|
|
|
|
|
|
|
|
|
|
|
|
|
|
|
|
| |
Average interest-rate spread |
|
|
|
|
|
3.15 |
|
|
|
|
|
|
|
3.25 |
|
| |
|
|
|
|
|
|
|
|
|
|
|
|
|
|
|
|
|
|
|
| |
Net interest income / net interest margin |
|
|
|
$ |
5,738 |
3.32 |
% |
|
|
|
|
$ |
5,517 |
3.42 |
% |
| |
|
|
|
|
|
|
|
|
|
|
|
|
|
|
|
|
|
|
|
| |
Taxable-equivalent adjustment |
|
|
|
$ |
146 |
|
|
|
|
|
|
$ |
143 |
|
|
| |
|
|
|
|
|
|
|
|
|
|
|
|
|
|
|
|
|
|
|
| Applicable ratios are annualized. |
| (1) |
Excludes basis adjustments for fair value hedges. |
| (2) |
Yields are on a fully taxable-equivalent basis. |
| (3) |
Excludes trading securities. |
| (4) |
During the first quarter of 2014, $8.3 billion of loans were transferred from direct retail lending to residential mortgage. |
| BB&T Corporation |
|
|
| Credit Quality |
|
|
|
|
|
|
|
|
|
|
|
|
|
|
| (Dollars in millions) |
|
|
|
|
|
|
|
|
|
|
|
|
|
|
| |
|
|
|
|
|
|
|
|
|
|
|
|
|
|
|
|
|
| |
|
|
|
As of |
| |
|
|
|
Dec. 31 |
|
Sept. 30 |
|
June 30 |
|
March 31 |
|
Dec. 31 |
| |
|
|
|
2015 |
|
2015 |
|
2015 |
|
2015 |
|
2014 |
| Nonperforming assets (1) |
|
|
|
|
|
|
|
|
|
|
|
|
|
|
| |
Nonaccrual loans and leases: |
|
|
|
|
|
|
|
|
|
|
|
|
|
|
| |
|
Commercial: |
|
|
|
|
|
|
|
|
|
|
|
|
|
|
| |
|
|
Commercial and industrial |
$ |
237 |
|
$ |
211 |
|
$ |
198 |
|
$ |
230 |
|
$ |
239 |
| |
|
|
Commercial real estate-income producing properties |
|
38 |
|
|
45 |
|
|
59 |
|
|
63 |
|
|
74 |
| |
|
|
Commercial real estate-construction and development |
|
13 |
|
|
24 |
|
|
16 |
|
|
18 |
|
|
26 |
| |
|
|
Dealer floor plan |
|
― |
|
|
7 |
|
|
7 |
|
|
― |
|
|
― |
| |
|
Direct retail lending |
|
43 |
|
|
39 |
|
|
41 |
|
|
47 |
|
|
48 |
| |
|
Sales finance |
|
7 |
|
|
6 |
|
|
6 |
|
|
7 |
|
|
5 |
| |
|
Residential mortgage (2) |
|
173 |
|
|
196 |
|
|
188 |
|
|
183 |
|
|
166 |
| |
|
Other lending subsidiaries |
|
65 |
|
|
57 |
|
|
57 |
|
|
51 |
|
|
58 |
| |
|
|
Total nonaccrual loans and leases held for investment (2) |
|
576 |
|
|
585 |
|
|
572 |
|
|
599 |
|
|
616 |
| |
Foreclosed real estate |
|
82 |
|
|
85 |
|
|
86 |
|
|
90 |
|
|
87 |
| |
Foreclosed real estate-acquired from FDIC and PCI |
|
26 |
|
|
45 |
|
|
47 |
|
|
53 |
|
|
56 |
| |
Other foreclosed property |
|
28 |
|
|
29 |
|
|
24 |
|
|
23 |
|
|
23 |
| |
|
|
Total nonperforming assets (1)(2) |
$ |
712 |
|
$ |
744 |
|
$ |
729 |
|
$ |
765 |
|
$ |
782 |
| Performing troubled debt restructurings (TDRs) (3) |
|
|
|
|
|
|
|
|
|
|
|
|
|
|
| |
|
Commercial: |
|
|
|
|
|
|
|
|
|
|
|
|
|
|
| |
|
|
Commercial and industrial |
$ |
49 |
|
$ |
54 |
|
$ |
75 |
|
$ |
54 |
|
$ |
64 |
| |
|
|
Commercial real estate-income producing properties |
|
13 |
|
|
12 |
|
|
21 |
|
|
15 |
|
|
27 |
| |
|
|
Commercial real estate-construction and development |
|
16 |
|
|
14 |
|
|
23 |
|
|
25 |
|
|
30 |
| |
|
Direct retail lending |
|
72 |
|
|
75 |
|
|
81 |
|
|
84 |
|
|
84 |
| |
|
Sales finance |
|
17 |
|
|
18 |
|
|
18 |
|
|
18 |
|
|
19 |
| |
|
Revolving credit |
|
33 |
|
|
34 |
|
|
36 |
|
|
38 |
|
|
41 |
| |
|
Residential mortgage-nonguaranteed |
|
288 |
|
|
275 |
|
|
273 |
|
|
269 |
|
|
261 |
| |
|
Residential mortgage-government guaranteed |
|
316 |
|
|
321 |
|
|
328 |
|
|
325 |
|
|
360 |
| |
|
Other lending subsidiaries |
|
178 |
|
|
173 |
|
|
172 |
|
|
168 |
|
|
164 |
| |
|
|
Total performing TDRs (3) |
$ |
982 |
|
$ |
976 |
|
$ |
1,027 |
|
$ |
996 |
|
$ |
1,050 |
| Loans 90 days or more past due and still accruing |
|
|
|
|
|
|
|
|
|
|
|
|
|
|
| |
|
Direct retail lending |
$ |
7 |
|
$ |
12 |
|
$ |
10 |
|
$ |
9 |
|
$ |
12 |
| |
|
Sales finance |
|
5 |
|
|
4 |
|
|
4 |
|
|
3 |
|
|
5 |
| |
|
Revolving credit |
|
10 |
|
|
9 |
|
|
9 |
|
|
10 |
|
|
9 |
| |
|
Residential mortgage-nonguaranteed |
|
55 |
|
|
61 |
|
|
60 |
|
|
59 |
|
|
83 |
| |
|
Residential mortgage-government guaranteed (4) |
|
121 |
|
|
128 |
|
|
154 |
|
|
157 |
|
|
238 |
| |
|
Acquired from FDIC and PCI (5) |
|
114 |
|
|
167 |
|
|
124 |
|
|
154 |
|
|
188 |
| |
|
|
Total loans 90 days past due and still accruing (4)(5) |
$ |
312 |
|
$ |
381 |
|
$ |
361 |
|
$ |
392 |
|
$ |
535 |
| Loans 30-89 days past due |
|
|
|
|
|
|
|
|
|
|
|
|
|
|
| |
|
Commercial: |
|
|
|
|
|
|
|
|
|
|
|
|
|
|
| |
|
|
Commercial and industrial |
$ |
36 |
|
$ |
26 |
|
$ |
16 |
|
$ |
20 |
|
$ |
23 |
| |
|
|
Commercial real estate-income producing properties |
|
13 |
|
|
6 |
|
|
4 |
|
|
7 |
|
|
4 |
| |
|
|
Commercial real estate-construction and development |
|
9 |
|
|
2 |
|
|
3 |
|
|
2 |
|
|
1 |
| |
|
Direct retail lending |
|
58 |
|
|
46 |
|
|
41 |
|
|
40 |
|
|
41 |
| |
|
Sales finance |
|
72 |
|
|
63 |
|
|
53 |
|
|
49 |
|
|
62 |
| |
|
Revolving credit |
|
22 |
|
|
20 |
|
|
19 |
|
|
19 |
|
|
23 |
| |
|
Residential mortgage-nonguaranteed |
|
397 |
|
|
368 |
|
|
362 |
|
|
356 |
|
|
392 |
| |
|
Residential mortgage-government guaranteed (6) |
|
75 |
|
|
73 |
|
|
74 |
|
|
68 |
|
|
80 |
| |
|
Other lending subsidiaries |
|
304 |
|
|
274 |
|
|
230 |
|
|
151 |
|
|
237 |
| |
|
Acquired from FDIC and PCI |
|
42 |
|
|
28 |
|
|
31 |
|
|
47 |
|
|
33 |
| |
|
|
Total loans 30-89 days past due (6) |
$ |
1,028 |
|
$ |
906 |
|
$ |
833 |
|
$ |
759 |
|
$ |
896 |
| Excludes loans held for sale. |
| (1) |
Loans acquired from the FDIC and PCI are accounted for using the accretion method. |
| (2) |
During the fourth quarter of 2015, approximately $50 million of nonaccrual residential mortgage loans were sold. |
| (3) |
Excludes TDRs that are nonperforming totaling $146 million, $154 million, $127 million, $127 million, and $126 million at December 31, 2015, September 30, 2015, June 30, 2015, March 31, 2015 and December 31, 2014, respectively. These amounts are included in total nonperforming assets. |
| (4) |
Excludes government guaranteed GNMA mortgage loans that BB&T has the right but not the obligation to repurchase that are past due 90 days or more totaling $365 million, $353 million, $338 million, $361 million and $410 million at December 31, 2015, September 30, 2015, June 30, 2015, March 31, 2015 and December 31, 2014, respectively. |
| (5) |
Approximately $93 million of PCI loans 90 days or more past due and still accruing as of September 30, 2015 have been reclassified to current based on a correction to the aging methodology for these loans. |
| (6) |
Excludes government guaranteed GNMA mortgage loans that BB&T has the right but not the obligation to repurchase that are past due 30-89 days totaling $2 million, $3 million, $3 million, $2 million and $2 million at December 31, 2015, September 30, 2015, June 30, 2015, March 31, 2015 and December 31, 2014, respectively. |
| BB&T Corporation |
|
|
| Credit Quality |
|
|
| (Dollars in millions) |
|
|
|
|
|
|
|
|
|
|
|
|
|
|
| |
|
|
|
|
|
|
|
|
|
|
|
|
|
|
|
|
|
| |
|
|
|
As of/For the Quarter Ended |
| |
|
|
|
Dec. 31 |
|
Sept. 30 |
|
June 30 |
|
March 31 |
|
Dec. 31 |
| |
|
|
|
2015 |
|
2015 |
|
2015 |
|
2015 |
|
2014 |
| Allowance for credit losses |
|
|
|
|
|
|
|
|
|
|
|
|
|
|
| |
Beginning balance |
$ |
1,551 |
|
$ |
1,535 |
|
$ |
1,532 |
|
$ |
1,534 |
|
$ |
1,567 |
| |
Provision for credit losses (excluding loans acquired from FDIC and PCI) |
|
128 |
|
|
100 |
|
|
97 |
|
|
105 |
|
|
84 |
| |
Provision (benefit) for loans acquired from FDIC and PCI |
|
1 |
|
|
3 |
|
|
― |
|
|
(6) |
|
|
(1) |
| |
Charge-offs: |
|
|
|
|
|
|
|
|
|
|
|
|
|
|
| |
|
Commercial: |
|
|
|
|
|
|
|
|
|
|
|
|
|
|
| |
|
|
Commercial and industrial |
|
(19) |
|
|
(16) |
|
|
(32) |
|
|
(14) |
|
|
(27) |
| |
|
|
Commercial real estate—income producing properties |
|
(3) |
|
|
(4) |
|
|
(4) |
|
|
(9) |
|
|
(4) |
| |
|
|
Commercial real estate—construction and development |
|
(1) |
|
|
(1) |
|
|
― |
|
|
(2) |
|
|
(2) |
| |
|
Direct retail lending |
|
(14) |
|
|
(15) |
|
|
(13) |
|
|
(12) |
|
|
(14) |
| |
|
Sales finance |
|
(10) |
|
|
(5) |
|
|
(5) |
|
|
(6) |
|
|
(7) |
| |
|
Revolving credit |
|
(16) |
|
|
(17) |
|
|
(19) |
|
|
(18) |
|
|
(18) |
| |
|
Residential mortgage-nonguaranteed |
|
(14) |
|
|
(7) |
|
|
(8) |
|
|
(11) |
|
|
(10) |
| |
|
Residential mortgage-government guaranteed |
|
(2) |
|
|
(3) |
|
|
(1) |
|
|
― |
|
|
― |
| |
|
Other lending subsidiaries |
|
(85) |
|
|
(77) |
|
|
(57) |
|
|
(67) |
|
|
(71) |
| |
|
Acquired from FDIC and PCI |
|
― |
|
|
― |
|
|
― |
|
|
(1) |
|
|
(14) |
| |
|
|
Total charge-offs |
|
(164) |
|
|
(145) |
|
|
(139) |
|
|
(140) |
|
|
(167) |
| |
Recoveries: |
|
|
|
|
|
|
|
|
|
|
|
|
|
|
| |
|
Commercial: |
|
|
|
|
|
|
|
|
|
|
|
|
|
|
| |
|
|
Commercial and industrial |
|
8 |
|
|
8 |
|
|
13 |
|
|
8 |
|
|
13 |
| |
|
|
Commercial real estate—income producing properties |
|
1 |
|
|
3 |
|
|
1 |
|
|
2 |
|
|
7 |
| |
|
|
Commercial real estate—construction and development |
|
2 |
|
|
3 |
|
|
2 |
|
|
4 |
|
|
4 |
| |
|
Direct retail lending |
|
6 |
|
|
8 |
|
|
7 |
|
|
8 |
|
|
7 |
| |
|
Sales finance |
|
2 |
|
|
2 |
|
|
2 |
|
|
3 |
|
|
2 |
| |
|
Revolving credit |
|
5 |
|
|
5 |
|
|
5 |
|
|
5 |
|
|
5 |
| |
|
Residential mortgage-nonguaranteed |
|
1 |
|
|
1 |
|
|
1 |
|
|
― |
|
|
5 |
| |
|
Other lending subsidiaries |
|
9 |
|
|
8 |
|
|
10 |
|
|
9 |
|
|
8 |
| |
|
|
Total recoveries |
|
34 |
|
|
38 |
|
|
41 |
|
|
39 |
|
|
51 |
| |
Net charge-offs |
|
(130) |
|
|
(107) |
|
|
(98) |
|
|
(101) |
|
|
(116) |
| |
Other |
|
― |
|
|
20 |
|
|
4 |
|
|
― |
|
|
― |
| |
Ending balance |
$ |
1,550 |
|
$ |
1,551 |
|
$ |
1,535 |
|
$ |
1,532 |
|
$ |
1,534 |
| Allowance for credit losses |
|
|
|
|
|
|
|
|
|
|
|
|
|
|
| |
Allowance for loan and lease losses (excluding loans acquired from the FDIC and PCI) |
$ |
1,399 |
|
$ |
1,398 |
|
$ |
1,400 |
|
$ |
1,407 |
|
$ |
1,410 |
| |
Allowance for loans acquired from the FDIC and PCI |
|
61 |
|
|
60 |
|
|
57 |
|
|
57 |
|
|
64 |
| |
Reserve for unfunded lending commitments |
|
90 |
|
|
93 |
|
|
78 |
|
|
68 |
|
|
60 |
| |
|
Total |
$ |
1,550 |
|
$ |
1,551 |
|
$ |
1,535 |
|
$ |
1,532 |
|
$ |
1,534 |
| |
|
| |
|
|
|
|
|
|
|
|
|
|
|
|
|
|
| |
|
|
|
|
|
|
|
|
|
|
|
|
|
As of/For the |
| |
|
|
|
|
|
|
|
|
|
|
|
|
|
Twelve Months Ended |
| |
|
|
|
|
|
|
|
|
|
|
|
|
|
December 31 |
| |
|
|
|
|
|
|
|
|
|
|
|
|
|
2015 |
|
|
2014 |
| Allowance for credit losses |
|
|
|
|
|
|
|
|
|
|
|
|
|
|
| |
Beginning balance |
|
|
|
|
|
|
|
|
|
$ |
1,534 |
|
$ |
1,821 |
| |
Provision for credit losses (excluding loans acquired from FDIC and PCI) |
|
|
|
|
|
|
|
|
|
|
430 |
|
|
280 |
| |
Provision (benefit) for loans acquired from FDIC and PCI |
|
|
|
|
|
|
|
|
|
|
(2) |
|
|
(29) |
| |
Charge-offs: |
|
|
|
|
|
|
|
|
|
|
|
|
|
|
| |
|
Commercial: |
|
|
|
|
|
|
|
|
|
|
|
|
|
|
| |
|
|
Commercial and industrial |
|
|
|
|
|
|
|
|
|
|
(81) |
|
|
(131) |
| |
|
|
Commercial real estate—income producing properties |
|
|
|
|
|
|
|
|
|
|
(20) |
|
|
(31) |
| |
|
|
Commercial real estate—construction and development |
|
|
|
|
|
|
|
|
|
|
(4) |
|
|
(11) |
| |
|
Direct retail lending (1) |
|
|
|
|
|
|
|
|
|
|
(54) |
|
|
(69) |
| |
|
Sales finance |
|
|
|
|
|
|
|
|
|
|
(26) |
|
|
(23) |
| |
|
Revolving credit |
|
|
|
|
|
|
|
|
|
|
(70) |
|
|
(71) |
| |
|
Residential mortgage-nonguaranteed (1) |
|
|
|
|
|
|
|
|
|
|
(40) |
|
|
(82) |
| |
|
Residential mortgage-government guaranteed |
|
|
|
|
|
|
|
|
|
|
(6) |
|
|
(2) |
| |
|
Other lending subsidiaries |
|
|
|
|
|
|
|
|
|
|
(286) |
|
|
(269) |
| |
|
Acquired from FDIC and PCI |
|
|
|
|
|
|
|
|
|
|
(1) |
|
|
(21) |
| |
|
|
Total charge-offs |
|
|
|
|
|
|
|
|
|
|
(588) |
|
|
(710) |
| |
Recoveries: |
|
|
|
|
|
|
|
|
|
|
|
|
|
|
| |
|
Commercial: |
|
|
|
|
|
|
|
|
|
|
|
|
|
|
| |
|
|
Commercial and industrial |
|
|
|
|
|
|
|
|
|
|
37 |
|
|
42 |
| |
|
|
Commercial real estate—income producing properties |
|
|
|
|
|
|
|
|
|
|
7 |
|
|
14 |
| |
|
|
Commercial real estate—construction and development |
|
|
|
|
|
|
|
|
|
|
11 |
|
|
19 |
| |
|
Direct retail lending (1) |
|
|
|
|
|
|
|
|
|
|
29 |
|
|
29 |
| |
|
Sales finance |
|
|
|
|
|
|
|
|
|
|
9 |
|
|
9 |
| |
|
Revolving credit |
|
|
|
|
|
|
|
|
|
|
20 |
|
|
19 |
| |
|
Residential mortgage-nonguaranteed (1) |
|
|
|
|
|
|
|
|
|
|
3 |
|
|
7 |
| |
|
Other lending subsidiaries |
|
|
|
|
|
|
|
|
|
|
36 |
|
|
33 |
| |
|
|
Total recoveries |
|
|
|
|
|
|
|
|
|
|
152 |
|
|
172 |
| |
Net charge-offs |
|
|
|
|
|
|
|
|
|
|
(436) |
|
|
(538) |
| |
Other |
|
|
|
|
|
|
|
|
|
|
24 |
|
|
― |
| |
Ending balance |
|
|
|
|
|
|
|
|
|
$ |
1,550 |
|
$ |
1,534 |
| (1) |
During the first quarter of 2014, $8.3 billion of loans were transferred from direct retail lending to residential mortgage. |
| BB&T Corporation |
|
|
| Credit Quality |
|
|
|
|
|
|
|
|
|
|
|
|
|
|
| |
|
|
|
|
|
|
|
|
|
|
|
|
|
|
|
|
| |
|
|
As of/For the Quarter Ended |
|
| |
|
|
Dec. 31 |
|
Sept. 30 |
|
June 30 |
|
March 31 |
|
Dec. 31 |
| |
|
|
2015 |
|
2015 |
|
2015 |
|
2015 |
|
2014 |
| Asset Quality Ratios (including acquired from FDIC and PCI) |
|
|
|
|
|
|
|
|
|
|
|
|
|
|
| |
Loans 30-89 days past due and still accruing as a |
|
|
|
|
|
|
|
|
|
|
|
|
|
|
| |
|
percentage of loans and leases (1) |
0.76 |
% |
|
0.67 |
% |
|
0.68 |
% |
|
0.63 |
% |
|
0.75 |
% |
| |
Loans 90 days or more past due and still accruing |
|
|
|
|
|
|
|
|
|
|
|
|
|
|
| |
|
as a percentage of loans and leases (1)(3) |
0.23 |
|
|
0.28 |
|
|
0.29 |
|
|
0.33 |
|
|
0.45 |
|
| |
Nonperforming loans and leases as a |
|
|
|
|
|
|
|
|
|
|
|
|
|
|
| |
|
percentage of loans and leases |
0.42 |
|
|
0.43 |
|
|
0.47 |
|
|
0.50 |
|
|
0.51 |
|
| |
Nonperforming assets as a percentage of: |
|
|
|
|
|
|
|
|
|
|
|
|
|
|
| |
|
Total assets |
0.34 |
|
|
0.36 |
|
|
0.38 |
|
|
0.40 |
|
|
0.42 |
|
| |
|
Loans and leases plus foreclosed property |
0.52 |
|
|
0.55 |
|
|
0.60 |
|
|
0.64 |
|
|
0.65 |
|
| |
Net charge-offs as a percentage of average loans and leases |
0.38 |
|
|
0.32 |
|
|
0.33 |
|
|
0.34 |
|
|
0.39 |
|
| |
Allowance for loan and lease losses as a percentage of |
|
|
|
|
|
|
|
|
|
|
|
|
|
|
| |
|
loans and leases |
1.07 |
|
|
1.08 |
|
|
1.19 |
|
|
1.22 |
|
|
1.23 |
|
| |
Ratio of allowance for loan and lease losses to: |
|
|
|
|
|
|
|
|
|
|
|
|
|
|
| |
|
Net charge-offs |
2.83 |
X |
|
3.44 |
X |
|
3.71 |
X |
|
3.60 |
X |
|
3.21 |
X |
| |
|
Nonperforming loans and leases |
2.53 |
|
|
2.49 |
|
|
2.55 |
|
|
2.45 |
|
|
2.39 |
|
| Asset Quality Ratios (excluding acquired from FDIC and PCI) (2) |
|
|
|
|
|
|
|
|
|
|
|
|
|
|
| |
Loans 90 days or more past due and still accruing |
|
|
|
|
|
|
|
|
|
|
|
|
|
|
| |
|
as a percentage of loans and leases (1) |
0.15 |
% |
|
0.16 |
% |
|
0.19 |
% |
|
0.20 |
% |
|
0.29 |
% |
| |
|
|
|
|
|
|
|
|
|
|
|
|
|
|
|
|
| |
|
|
|
|
|
|
|
|
|
|
|
As of/For the |
| |
|
|
|
|
|
|
|
|
|
|
|
Twelve Months Ended |
| |
|
|
|
|
|
|
|
|
|
|
|
December 31 |
| |
|
|
|
|
|
|
|
|
|
|
|
2015 |
|
2014 |
| Asset Quality Ratios |
|
|
|
|
|
|
|
|
|
|
|
|
|
|
| |
Including acquired from FDIC and PCI: |
|
|
|
|
|
|
|
|
|
|
|
|
|
|
| |
|
Net charge-offs as a percentage of average loans and leases |
|
|
|
|
|
|
|
|
|
0.35 |
% |
|
0.46 |
% |
| |
|
Ratio of allowance for loan and lease losses to net charge-offs |
|
|
|
|
|
|
|
|
|
3.36 |
X |
|
2.74 |
X |
| Applicable ratios are annualized. Loans and leases exclude loans held for sale. |
| (1) |
Excludes government guaranteed GNMA mortgage loans that BB&T has the right but not the obligation to repurchase. Refer to the footnotes in the Credit Quality section of this supplement for amounts related to these loans. The prior quarters have been revised to include government guaranteed mortgage loans consistent with the current presentation. |
| (2) |
These asset quality ratios have been adjusted to remove the impact of assets acquired from the FDIC and PCI. Appropriate adjustments to the numerator and denominator have been reflected in the calculation of these ratios. Management believes the inclusion of assets acquired from the FDIC and PCI in certain asset quality ratios results in distortion of these ratios and they may not be comparable to other periods presented or to other portfolios that were subject to different accounting requirements. |
| (3) |
Approximately $93 million of PCI loans 90 days or more past due and still accruing as of September 30, 2015 have been reclassified to current based on a revision to the aging methodology for these loans. |
| BB&T Corporation |
|
|
|
|
| Credit Quality - Supplemental Information |
|
|
|
|
|
|
|
|
|
|
|
|
|
|
|
|
|
| (Dollars in millions) |
|
|
|
|
|
|
|
|
|
|
|
|
|
|
|
|
|
| |
|
|
|
|
|
|
|
|
|
|
|
|
|
|
|
|
|
|
|
| |
|
|
As of December 31, 2015 |
| |
|
|
|
|
|
|
|
Past Due 30-89 |
|
Past Due 90+ |
|
|
|
| |
|
|
Current Status |
|
Days |
|
Days |
|
Total |
| Performing TDRs: (1) |
|
|
|
|
|
|
|
|
|
|
|
|
|
|
|
|
|
| |
Commercial: |
|
|
|
|
|
|
|
|
|
|
|
|
|
|
|
|
|
| |
|
Commercial and industrial |
$ |
45 |
91.8 |
% |
|
$ |
4 |
8.2 |
% |
|
$ |
― |
― |
% |
|
$ |
49 |
| |
|
Commercial real estate—income producing properties |
|
13 |
100.0 |
|
|
|
― |
― |
|
|
|
― |
― |
|
|
|
13 |
| |
|
Commercial real estate—construction and development |
|
16 |
100.0 |
|
|
|
― |
― |
|
|
|
― |
― |
|
|
|
16 |
| |
Direct retail lending |
|
70 |
97.2 |
|
|
|
2 |
2.8 |
|
|
|
― |
― |
|
|
|
72 |
| |
Sales finance |
|
16 |
94.1 |
|
|
|
1 |
5.9 |
|
|
|
― |
― |
|
|
|
17 |
| |
Revolving credit |
|
28 |
84.9 |
|
|
|
4 |
12.1 |
|
|
|
1 |
3.0 |
|
|
|
33 |
| |
Residential mortgage—nonguaranteed |
|
236 |
81.9 |
|
|
|
44 |
15.3 |
|
|
|
8 |
2.8 |
|
|
|
288 |
| |
Residential mortgage—government guaranteed |
|
174 |
55.1 |
|
|
|
64 |
20.2 |
|
|
|
78 |
24.7 |
|
|
|
316 |
| |
Other lending subsidiaries |
|
146 |
82.0 |
|
|
|
32 |
18.0 |
|
|
|
― |
― |
|
|
|
178 |
| |
|
Total performing TDRs |
|
744 |
75.8 |
|
|
|
151 |
15.4 |
|
|
|
87 |
8.8 |
|
|
|
982 |
| Nonperforming TDRs (2) |
|
61 |
41.8 |
|
|
|
23 |
15.7 |
|
|
|
62 |
42.5 |
|
|
|
146 |
| |
|
Total TDRs |
$ |
805 |
71.4 |
|
|
$ |
174 |
15.4 |
|
|
$ |
149 |
13.2 |
|
|
$ |
1,128 |
| |
|
|
|
|
|
|
|
|
|
|
|
|
|
| |
|
|
|
Quarter Ended |
| |
|
|
|
Dec. 31 |
Sept. 30 |
June 30 |
March 31 |
Dec. 31 |
| |
|
|
|
2015 |
2015 |
2015 |
2015 |
2014 |
| Net charge-offs as a percentage of average loans and leases: |
|
|
|
|
|
|
|
|
|
|
| |
Commercial: |
|
|
|
|
|
|
|
|
|
|
| |
|
Commercial and industrial |
0.09 |
% |
0.07 |
% |
0.18 |
% |
0.06 |
% |
0.13 |
% |
| |
|
Commercial real estate—income producing properties |
0.05 |
|
0.03 |
|
0.11 |
|
0.28 |
|
(0.13) |
|
| |
|
Commercial real estate—construction and development |
(0.10) |
|
(0.25) |
|
(0.20) |
|
(0.36) |
|
(0.18) |
|
| |
Direct retail lending |
0.30 |
|
0.29 |
|
0.29 |
|
0.18 |
|
0.36 |
|
| |
Sales finance |
0.28 |
|
0.12 |
|
0.11 |
|
0.14 |
|
0.21 |
|
| |
Revolving credit |
1.85 |
|
1.88 |
|
2.24 |
|
2.32 |
|
2.27 |
|
| |
Residential mortgage |
0.19 |
|
0.11 |
|
0.12 |
|
0.15 |
|
0.06 |
|
| |
Other lending subsidiaries |
2.30 |
|
2.12 |
|
1.60 |
|
2.07 |
|
2.20 |
|
| |
Acquired from FDIC and PCI |
0.14 |
|
0.19 |
|
― |
|
0.10 |
|
4.19 |
|
| |
|
Total loans and leases |
0.38 |
|
0.32 |
|
0.33 |
|
0.34 |
|
0.39 |
|
| |
|
|
|
|
|
|
|
|
|
|
|
|
|
| |
|
|
|
|
|
|
|
|
|
|
|
|
|
| |
|
|
|
|
|
|
|
|
|
Year-to-date |
| |
|
|
|
|
|
|
|
|
|
Dec. 31 |
Dec. 31 |
| |
|
|
|
|
|
|
|
|
|
2015 |
2014 |
| Net charge-offs as a percentage of average loans and leases: |
|
|
|
|
|
|
|
|
|
|
| |
Commercial: |
|
|
|
|
|
|
|
|
|
|
| |
|
Commercial and industrial |
|
|
|
|
|
|
0.10 |
% |
0.22 |
% |
| |
|
Commercial real estate—income producing properties |
|
|
|
|
|
|
0.11 |
|
0.16 |
|
| |
|
Commercial real estate—construction and development |
|
|
|
|
|
|
(0.22) |
|
(0.28) |
|
| |
Direct retail lending |
|
|
|
|
|
|
0.27 |
|
0.49 |
|
| |
Sales finance |
|
|
|
|
|
|
0.16 |
|
0.16 |
|
| |
Revolving credit |
|
|
|
|
|
|
2.07 |
|
2.20 |
|
| |
Residential mortgage |
|
|
|
|
|
|
0.14 |
|
0.24 |
|
| |
Other lending subsidiaries |
|
|
|
|
|
|
2.03 |
|
2.18 |
|
| |
Acquired from FDIC and PCI |
|
|
|
|
|
|
0.10 |
|
1.33 |
|
| |
|
Total loans and leases |
|
|
|
|
|
|
0.35 |
|
0.46 |
|
| Applicable ratios are annualized. |
|
|
|
|
|
|
|
|
|
|
| (1) |
Past due performing TDRs are included in past due disclosures. |
| (2) |
Nonperforming TDRs are included in nonaccrual loan disclosures. |
| |
|
| |
|
|
|
|
|
|
|
|
|
|
|
|
|
|
|
|
|
|
|
|
|
|
|
|
|
|
|
|
|
|
| BB&T Corporation |
|
|
|
| Preliminary Capital Information - Five Quarter Trend |
|
|
|
|
|
| (Dollars in millions, except per share data, shares in thousands) |
|
|
|
|
|
| |
|
|
|
|
|
|
|
|
|
|
|
|
|
|
|
|
|
|
|
|
|
| |
|
|
|
|
|
|
|
|
|
|
|
|
|
|
|
|
|
|
|
|
|
| |
|
|
|
|
|
|
|
|
|
|
|
|
|
|
|
|
|
|
|
|
|
| |
|
|
|
As of / Quarter Ended |
|
| |
|
|
Dec. 31 |
|
Sept. 30 |
|
June 30 |
|
March 31 |
|
Dec. 31 |
| |
|
|
2015 |
|
2015 |
|
2015 |
|
2015 |
|
2014 |
| Selected Capital Information |
|
|
|
|
|
|
|
|
|
|
|
|
|
|
|
|
|
|
|
| |
Risk-based capital: |
Basel III |
|
Basel I |
| |
|
Common equity tier 1 |
$ |
17,081 |
|
|
$ |
16,822 |
|
|
$ |
16,031 |
|
|
$ |
15,755 |
|
|
|
N/A |
|
| |
|
Tier 1 |
|
19,682 |
|
|
|
19,422 |
|
|
|
18,633 |
|
|
|
18,320 |
|
|
$ |
17,840 |
|
| |
|
Total |
|
23,755 |
|
|
|
23,612 |
|
|
|
21,896 |
|
|
|
21,654 |
|
|
|
21,381 |
|
| |
Risk-weighted assets (1) |
|
166,784 |
|
|
|
165,990 |
|
|
|
154,493 |
|
|
|
150,092 |
|
|
|
143,675 |
|
| |
Average quarterly tangible assets |
|
209,131 |
|
|
|
195,623 |
|
|
|
182,444 |
|
|
|
180,790 |
|
|
|
179,785 |
|
| |
Risk-based capital ratios: |
|
|
|
|
|
|
|
|
|
|
|
|
|
|
|
|
|
|
|
| |
|
Common equity tier 1 |
|
10.2 |
% |
|
|
10.1 |
% |
|
|
10.4 |
% |
|
|
10.5 |
% |
|
|
N/A |
|
| |
|
Tier 1 |
|
11.8 |
|
|
|
11.7 |
|
|
|
12.1 |
|
|
|
12.2 |
|
|
|
12.4 |
% |
| |
|
Total |
|
14.2 |
|
|
|
14.2 |
|
|
|
14.2 |
|
|
|
14.4 |
|
|
|
14.9 |
|
| |
Leverage capital ratio |
|
9.8 |
|
|
|
9.9 |
|
|
|
10.2 |
|
|
|
10.1 |
|
|
|
9.9 |
|
| |
Equity as a percentage of total assets |
|
13.0 |
|
|
|
13.1 |
|
|
|
13.2 |
|
|
|
13.1 |
|
|
|
13.0 |
|
| |
Common equity per common share |
$ |
31.66 |
|
|
$ |
31.56 |
|
|
$ |
30.64 |
|
|
$ |
30.48 |
|
|
$ |
30.09 |
|
| |
|
|
|
|
|
|
|
|
|
|
|
|
|
|
|
|
|
|
|
|
|
| Selected non-GAAP Capital Information (2) |
|
|
|
|
|
|
|
|
|
|
|
|
|
|
|
|
|
|
|
| |
Tangible common equity as a percentage of tangible assets |
|
7.7 |
% |
|
|
7.7 |
% |
|
|
8.1 |
% |
|
|
8.0 |
% |
|
|
8.0 |
% |
| |
|
|
|
|
|
|
|
|
|
|
|
|
|
|
|
|
|
|
|
|
|
| |
Tangible common equity per common share |
$ |
19.82 |
|
|
$ |
19.77 |
|
|
$ |
20.21 |
|
|
$ |
20.13 |
|
|
$ |
19.86 |
|
| |
|
|
|
|
|
|
|
|
|
|
|
|
|
|
|
|
|
|
|
|
|
| |
|
|
|
|
|
|
|
|
|
|
|
|
|
|
|
|
|
|
|
|
|
| Calculations of tangible common equity, tangible assets and related measures: (2) |
| |
|
|
|
|
|
|
|
|
|
|
|
|
|
|
|
|
|
|
|
|
|
| Total shareholders' equity |
$ |
27,340 |
|
|
$ |
27,264 |
|
|
$ |
25,132 |
|
|
$ |
24,738 |
|
|
$ |
24,377 |
|
| Less: |
|
|
|
|
|
|
|
|
|
|
|
|
|
|
|
|
|
|
|
| |
Preferred stock |
|
2,603 |
|
|
|
2,603 |
|
|
|
2,603 |
|
|
|
2,603 |
|
|
|
2,603 |
|
| |
Noncontrolling interests |
|
34 |
|
|
|
40 |
|
|
|
52 |
|
|
|
96 |
|
|
|
88 |
|
| |
Intangible assets |
|
9,234 |
|
|
|
9,198 |
|
|
|
7,655 |
|
|
|
7,480 |
|
|
|
7,374 |
|
| Tangible common equity |
$ |
15,469 |
|
|
$ |
15,423 |
|
|
$ |
14,822 |
|
|
$ |
14,559 |
|
|
$ |
14,312 |
|
| |
|
|
|
|
|
|
|
|
|
|
|
|
|
|
|
|
|
|
|
|
| Total assets |
$ |
209,947 |
|
|
$ |
208,809 |
|
|
$ |
191,017 |
|
|
$ |
189,228 |
|
|
$ |
186,834 |
|
| Less: |
|
|
|
|
|
|
|
|
|
|
|
|
|
|
|
|
|
|
|
| |
Intangible assets |
|
9,234 |
|
|
|
9,198 |
|
|
|
7,655 |
|
|
|
7,480 |
|
|
|
7,374 |
|
| Tangible assets |
$ |
200,713 |
|
|
$ |
199,611 |
|
|
$ |
183,362 |
|
|
$ |
181,748 |
|
|
$ |
179,460 |
|
| |
|
|
|
|
|
|
|
|
|
|
|
|
|
|
|
|
|
|
|
|
|
| Tangible common equity as a percentage of tangible assets |
|
7.7 |
% |
|
|
7.7 |
% |
|
|
8.1 |
% |
|
|
8.0 |
% |
|
|
8.0 |
% |
| |
|
|
|
|
|
|
|
|
|
|
|
|
|
|
|
|
|
|
|
|
|
| Tangible common equity |
$ |
15,469 |
|
|
$ |
15,423 |
|
|
$ |
14,822 |
|
|
$ |
14,559 |
|
|
$ |
14,312 |
|
| |
|
|
|
|
|
|
|
|
|
|
|
|
|
|
|
|
|
|
|
|
|
| Outstanding shares at end of period (in thousands) |
|
780,337 |
|
|
|
780,150 |
|
|
|
733,481 |
|
|
|
723,159 |
|
|
|
720,698 |
|
| |
|
|
|
|
|
|
|
|
|
|
|
|
|
|
|
|
|
|
|
|
|
| Tangible common equity per common share |
$ |
19.82 |
|
|
$ |
19.77 |
|
|
$ |
20.21 |
|
|
$ |
20.13 |
|
|
$ |
19.86 |
|
| (1) |
Risk-based capital, risk-weighted assets, leverage capital and related ratios for the first quarter of 2015 and later are determined in accordance with the Basel III Standardized Transitional Approach, which became effective January 1, 2015. Amounts and ratios for earlier periods were determined in accordance with Basel I. |
| (2) |
Tangible common equity and related ratios are non-GAAP measures. BB&T's management uses these measures to assess the quality of capital and believes that investors may find them useful in their analysis of the Corporation. These capital measures are not necessarily comparable to similar capital measures that may be presented by other companies. |
| BB&T Corporation |
|
|
|
|
|
|
| Selected Items & Additional Information |
|
|
|
|
|
|
|
|
|
|
|
|
|
|
|
|
|
|
|
| (Dollars in millions, except per share data) |
|
|
|
|
|
|
|
|
|
|
|
|
|
|
|
|
|
|
|
| |
|
|
|
|
|
|
|
|
|
|
|
|
|
|
|
|
|
|
|
|
|
|
| |
|
|
|
|
|
|
|
|
|
|
|
|
|
|
|
Favorable (Unfavorable) |
| Selected Items |
|
|
|
|
|
|
|
|
|
|
|
|
Pre-Tax |
|
|
After-Tax |
|
| |
|
|
|
|
|
|
|
|
|
|
|
|
|
|
|
|
|
|
|
|
|
|
| Fourth Quarter 2015 |
|
|
|
|
|
|
|
|
|
|
|
|
|
|
|
|
|
|
|
| |
None |
|
|
|
|
|
|
|
|
|
| |
|
|
|
|
|
|
|
|
|
|
| Third Quarter 2015 |
|
|
|
|
|
|
|
|
|
| |
None |
|
|
|
|
|
|
|
|
|
|
|
|
|
|
|
|
|
|
|
| |
|
|
|
|
|
|
|
|
|
|
|
|
|
|
|
|
|
|
|
|
|
|
| Second Quarter 2015 |
|
|
|
|
|
|
|
|
|
| |
Gain on sale of American Coastal, excluding goodwill |
|
|
$ |
23 |
|
|
$ |
15 |
|
| |
Allocation of non-deductible goodwill to American Coastal |
|
|
|
(49) |
|
|
|
(49) |
|
| |
|
Net loss on sale of American Coastal |
Other income |
|
|
(26) |
|
|
|
(34) |
|
| |
|
|
|
|
|
|
|
|
|
|
|
|
|
|
|
|
|
|
|
|
|
|
| |
Loss on early extinguishment of debt |
Debt extinguishment charges |
|
|
(172) |
|
|
|
(107) |
|
| |
Income tax adjustment |
Provision for income taxes |
|
|
N/A |
|
|
|
107 |
|
| |
|
|
|
|
|
|
|
|
|
|
|
|
|
|
|
|
|
|
|
|
|
|
| First Quarter 2015 |
|
|
|
|
|
|
|
|
|
|
|
|
|
|
|
|
|
|
|
| |
None |
|
|
|
|
|
|
|
|
|
| |
|
|
|
|
|
|
|
|
|
|
|
|
|
|
|
|
|
|
|
|
|
|
| Fourth Quarter 2014 |
|
|
|
|
|
|
|
|
|
| |
Mortgage reserve adjustments |
Loan-related expense |
|
|
(27) |
|
|
|
(17) |
|
| |
Franchise tax adjustment |
Other expense |
|
|
15 |
|
|
|
9 |
|
| |
Allowance release related to loan sale |
Provision for credit losses |
|
|
24 |
|
|
|
15 |
|
| |
|
|
|
|
|
|
|
|
|
|
|
|
| Third Quarter 2014 |
|
|
|
|
|
|
|
|
|
| |
Loss on early extinguishment of debt |
Debt extinguishment charges |
|
|
(122) |
|
|
|
(76) |
|
| |
Allowance release related to loan sale |
Provision for credit losses |
|
|
42 |
|
|
|
26 |
|
| |
Income tax adjustment |
Provision for income taxes |
|
|
N/A |
|
|
|
50 |
|
| |
|
|
|
|
|
|
|
|
|
|
| Second Quarter 2014 |
|
|
|
|
|
|
|
|
|
| |
FHA-insured mortgage loan reserve adjustment |
Other expense |
|
|
(85) |
|
|
|
(53) |
|
| |
Mortgage loan indemnification reserve adjustment |
Loan-related expense |
|
|
(33) |
|
|
|
(21) |
|
| |
Income tax adjustment |
Provision for income taxes |
|
|
N/A |
|
|
|
(14) |
|
| |
|
|
|
|
|
|
|
|
|
|
|
|
| First Quarter 2014 |
|
|
|
|
|
|
|
|
|
| |
Reallocation of partnership profit rights |
Noncontrolling interests |
|
|
N/A |
|
|
|
(16) |
|
| |
|
|
|
|
|
|
|
|
|
|
|
|
|
|
|
|
|
|
|
|
|
|
| |
|
|
|
|
|
|
|
|
|
|
|
|
|
|
|
|
|
|
|
|
|
|
| |
|
|
|
As of / Quarter Ended |
| |
|
|
|
Dec. 31 |
|
Sept. 30 |
|
June 30 |
|
March 31 |
|
Dec. 31 |
| |
|
|
|
2015 |
|
2015 |
|
2015 |
|
2015 |
|
2014 |
| |
|
|
|
|
|
|
|
|
|
|
|
|
|
|
|
|
|
|
|
|
|
|
| Selected Mortgage Banking Information |
|
|
|
|
|
|
|
|
|
|
|
|
|
|
|
|
|
|
|
| |
Income statement impact of mortgage servicing rights valuation: |
|
|
|
|
|
|
|
|
|
|
|
|
|
|
|
|
|
|
|
| |
|
MSRs fair value increase (decrease) |
$ |
31 |
|
|
$ |
(89) |
|
|
$ |
142 |
|
|
$ |
(71) |
|
|
$ |
(105) |
|
| |
|
MSRs hedge gains (losses) |
|
(24) |
|
|
|
94 |
|
|
|
(119) |
|
|
|
81 |
|
|
|
123 |
|
| |
|
|
Net |
$ |
7 |
|
|
$ |
5 |
|
|
$ |
23 |
|
|
$ |
10 |
|
|
$ |
18 |
|
| |
|
|
|
|
|
|
|
|
|
|
|
|
|
|
|
|
|
|
|
|
|
|
| |
Residential mortgage loan originations |
$ |
3,535 |
|
|
$ |
5,039 |
|
|
$ |
5,498 |
|
|
$ |
4,035 |
|
|
$ |
3,888 |
|
| |
|
|
|
|
|
|
|
|
|
|
|
|
|
|
|
|
|
|
|
|
|
|
| |
Residential mortgage servicing portfolio (1): |
|
|
|
|
|
|
|
|
|
|
|
|
|
|
|
|
|
|
|
| |
|
Loans serviced for others |
|
91,132 |
|
|
|
90,446 |
|
|
|
89,235 |
|
|
|
89,192 |
|
|
|
90,230 |
|
| |
|
Bank-owned loans serviced |
|
31,037 |
|
|
|
32,134 |
|
|
|
31,927 |
|
|
|
31,887 |
|
|
|
32,027 |
|
| |
|
|
Total servicing portfolio |
|
122,169 |
|
|
|
122,580 |
|
|
|
121,162 |
|
|
|
121,079 |
|
|
|
122,257 |
|
| |
|
|
|
|
|
|
|
|
|
|
|
|
|
|
|
|
|
|
|
|
|
|
| |
Weighted-average coupon rate |
|
4.12 |
% |
|
|
4.13 |
% |
|
|
4.15 |
% |
|
|
4.18 |
% |
|
|
4.20 |
% |
| |
Weighted-average servicing fee |
|
0.286 |
|
|
|
0.287 |
|
|
|
0.289 |
|
|
|
0.291 |
|
|
|
0.292 |
|
| |
|
|
|
|
|
|
|
|
|
|
|
|
|
|
|
|
|
|
|
|
|
|
| Selected Miscellaneous Information |
|
|
|
|
|
|
|
|
|
|
|
|
|
|
|
|
|
|
|
| |
Derivatives notional amount |
$ |
67,525 |
|
|
$ |
72,978 |
|
|
$ |
76,205 |
|
|
$ |
77,592 |
|
|
$ |
72,321 |
|
| |
Fair value of derivatives, net |
|
178 |
|
|
|
286 |
|
|
|
177 |
|
|
|
185 |
|
|
|
109 |
|
| |
Accumulated other comprehensive income related to securities, |
|
|
|
|
|
|
|
|
|
|
|
|
|
|
|
|
|
|
|
| |
|
net of tax (2) |
|
(330) |
|
|
|
(51) |
|
|
|
(148) |
|
|
|
8 |
|
|
|
(99) |
|
| |
|
|
|
|
|
|
|
|
|
|
|
|
|
|
|
|
|
|
|
|
| |
Common stock prices: |
|
|
|
|
|
|
|
|
|
|
|
|
|
|
|
|
|
|
|
| |
|
High |
|
39.47 |
|
|
|
41.90 |
|
|
|
41.70 |
|
|
|
40.17 |
|
|
|
39.69 |
|
| |
|
Low |
|
34.24 |
|
|
|
34.73 |
|
|
|
37.33 |
|
|
|
34.95 |
|
|
|
34.50 |
|
| |
|
End of period |
|
37.81 |
|
|
|
35.60 |
|
|
|
40.31 |
|
|
|
38.99 |
|
|
|
38.89 |
|
| |
|
|
|
|
|
|
|
|
|
|
|
|
|
|
|
|
|
|
|
|
|
|
| |
Banking offices |
|
2,139 |
|
|
|
2,150 |
|
|
|
1,903 |
|
|
|
1,875 |
|
|
|
1,839 |
|
| |
ATMs |
|
3,181 |
|
|
|
3,361 |
|
|
|
3,077 |
|
|
|
3,026 |
|
|
|
2,977 |
|
| |
FTEs (3) |
|
36,059 |
|
|
|
35,002 |
|
|
|
32,598 |
|
|
|
32,109 |
|
|
|
32,265 |
|
| |
|
| |
|
|
|
|
|
|
|
|
|
|
|
|
|
|
|
Quarter Ended |
|
YTD Ended |
| |
|
|
|
|
|
|
|
|
|
|
|
|
|
Dec. 31, 2014 |
|
Dec. 31, 2014 |
| Impact of Retrospective Adoption of New Accounting Guidance for Affordable Housing Investments |
|
| |
Increase to other income |
|
|
|
|
|
|
|
|
|
|
|
|
$ |
35 |
|
|
$ |
141 |
|
| |
Increase to provision for income taxes |
|
|
|
|
|
|
|
|
|
|
|
|
|
41 |
|
|
|
161 |
|
| |
|
Increase (decrease) to net income |
|
|
|
|
|
|
|
|
|
|
|
|
|
(6) |
|
|
|
(20) |
|
| |
|
|
|
|
|
|
|
|
|
|
|
|
|
|
|
|
|
|
|
|
|
|
| |
Cumulative impact to retained earnings at end of period |
|
|
|
|
|
|
|
|
|
|
|
|
|
(49) |
|
|
|
(49) |
|
| |
|
|
|
|
|
|
|
|
|
|
|
|
|
|
|
|
|
|
|
|
|
|
| (1) |
Amounts reported are unpaid principal balance. |
| (2) |
Includes the impact of the FDIC loss sharing agreements on the acquired securities. |
| (3) |
Represents a quarterly average. |
| BB&T Corporation |
|
|
|
|
|
|
| Non-GAAP Reconciliations |
|
|
|
|
|
|
|
|
|
|
|
|
|
|
|
|
|
|
|
|
| (Dollars in millions, except per share data, shares in thousands) |
|
|
|
|
|
|
|
|
|
|
|
|
|
|
|
|
|
|
|
|
| |
|
|
|
|
|
|
|
|
|
|
|
|
|
|
|
|
|
|
|
|
|
| |
|
|
Quarter Ended |
|
|
| |
|
|
Dec. 31 |
|
|
Sept. 30 |
|
|
June 30 |
|
|
March 31 |
|
|
Dec. 31 |
|
| Efficiency and Fee Income Ratios (1) |
|
2015 |
|
|
2015 |
|
|
2015 |
|
|
2015 |
|
|
2014 |
|
| Efficiency ratio - GAAP |
|
62.4 |
% |
|
|
64.1 |
% |
|
|
69.8 |
% |
|
|
60.7 |
% |
|
|
58.3 |
% |
|
| |
Effect of merger-related and restructuring charges, net |
|
(1.9) |
|
|
|
(3.1) |
|
|
|
(1.1) |
|
|
|
(0.5) |
|
|
|
(0.7) |
|
|
| |
Effect of loss on sale of American Coastal |
|
― |
|
|
|
― |
|
|
|
(0.8) |
|
|
|
― |
|
|
|
― |
|
|
| |
Effect of mortgage reserve adjustments |
|
― |
|
|
|
― |
|
|
|
― |
|
|
|
― |
|
|
|
(1.1) |
|
|
| |
Effect of loss on early extinguishment of debt |
|
― |
|
|
|
― |
|
|
|
(7.1) |
|
|
|
― |
|
|
|
― |
|
|
| |
Effect of franchise tax adjustment |
|
― |
|
|
|
― |
|
|
|
― |
|
|
|
― |
|
|
|
0.6 |
|
|
| |
Effect of FDIC loss share accounting |
|
― |
|
|
|
― |
|
|
|
(0.1) |
|
|
|
(0.1) |
|
|
|
(0.1) |
|
|
| |
Effect of foreclosed property expense |
|
(0.4) |
|
|
|
(0.6) |
|
|
|
(0.6) |
|
|
|
(0.6) |
|
|
|
(0.4) |
|
|
| |
Effect of amortization of intangibles |
|
(1.3) |
|
|
|
(1.2) |
|
|
|
(0.9) |
|
|
|
(1.0) |
|
|
|
(1.0) |
|
|
| Efficiency ratio - reported |
|
58.8 |
|
|
|
59.2 |
|
|
|
59.2 |
|
|
|
58.5 |
|
|
|
55.6 |
|
|
| Fee income ratio - GAAP |
|
39.7 |
% |
|
|
39.7 |
% |
|
|
43.0 |
% |
|
|
42.5 |
% |
|
|
42.7 |
% |
|
| |
Effect of loss on sale of American Coastal |
|
― |
|
|
|
― |
|
|
|
0.6 |
|
|
|
― |
|
|
|
― |
|
|
| |
Effect of FDIC loss share accounting |
|
2.1 |
|
|
|
2.4 |
|
|
|
2.7 |
|
|
|
3.3 |
|
|
|
3.5 |
|
|
| Fee income ratio - reported |
|
41.8 |
|
|
|
42.1 |
|
|
|
46.3 |
|
|
|
45.8 |
|
|
|
46.2 |
|
|
| |
|
|
|
|
|
|
|
|
|
|
|
|
|
|
|
|
|
|
|
|
|
| |
|
|
|
|
|
|
|
|
|
|
|
|
|
|
Year-to-Date Dec. 31 |
|
| |
|
|
|
|
|
|
|
|
|
|
|
|
|
2015 |
|
|
2014 |
|
| Efficiency ratio - GAAP |
|
|
|
|
|
|
|
|
|
|
|
|
|
64.2 |
% |
|
|
62.4 |
% |
|
| |
Effect of merger-related and restructuring charges, net |
|
|
|
|
|
|
|
|
|
|
|
|
|
(1.7) |
|
|
|
(0.5) |
|
|
| |
Effect of mortgage loan indemnification reserves |
|
|
|
|
|
|
|
|
|
|
|
|
|
― |
|
|
|
(0.4) |
|
|
| |
Effect of loss on sale of American Coastal |
|
|
|
|
|
|
|
|
|
|
|
|
|
(0.2) |
|
|
|
― |
|
|
| |
Effect of mortgage reserve adjustments |
|
|
|
|
|
|
|
|
|
|
|
|
|
― |
|
|
|
(0.3) |
|
|
| |
Effect of loss on early extinguishment of debt |
|
|
|
|
|
|
|
|
|
|
|
|
|
(1.8) |
|
|
|
(1.3) |
|
|
| |
Effect of franchise tax adjustment |
|
|
|
|
|
|
|
|
|
|
|
|
|
― |
|
|
|
0.2 |
|
|
| |
Effect of FDIC loss share accounting |
|
|
|
|
|
|
|
|
|
|
|
|
|
― |
|
|
|
(0.2) |
|
|
| |
Effect of foreclosed property expense |
|
|
|
|
|
|
|
|
|
|
|
|
|
(0.5) |
|
|
|
(0.4) |
|
|
| |
Effect of FHA-insured mortgage loan reserve adjustment |
|
|
|
|
|
|
|
|
|
|
|
|
|
― |
|
|
|
(0.9) |
|
|
| |
Effect of amortization of intangibles |
|
|
|
|
|
|
|
|
|
|
|
|
|
(1.1) |
|
|
|
(0.9) |
|
|
| Efficiency ratio - reported |
|
|
|
|
|
|
|
|
|
|
|
|
|
58.9 |
|
|
|
57.7 |
|
|
| Fee income ratio - GAAP |
|
|
|
|
|
|
|
|
|
|
|
|
|
41.2 |
% |
|
|
41.1 |
% |
|
| |
Effect of loss on sale of American Coastal |
|
|
|
|
|
|
|
|
|
|
|
|
|
0.2 |
|
|
|
― |
|
|
| |
Effect of FDIC loss share accounting |
|
|
|
|
|
|
|
|
|
|
|
|
|
2.5 |
|
|
|
3.6 |
|
|
| Fee income ratio - reported |
|
|
|
|
|
|
|
|
|
|
|
|
|
43.9 |
|
|
|
44.7 |
|
|
| |
|
|
|
|
|
|
|
|
|
| |
|
|
|
|
|
|
|
Quarter Ended |
|
| |
|
|
|
|
|
|
Dec. 31 |
|
Sept. 30 |
|
June 30 |
|
March 31 |
|
Dec. 31 |
| Return on Average Tangible Common Shareholders' Equity (2) |
|
2015 |
|
2015 |
|
2015 |
|
2015 |
|
2014 |
| Net income available to common shareholders |
|
|
|
|
$ |
502 |
|
|
$ |
492 |
|
|
$ |
454 |
|
|
$ |
488 |
|
|
$ |
551 |
|
| Plus: Amortization of intangibles, net of tax |
|
|
|
|
|
21 |
|
|
|
18 |
|
|
|
14 |
|
|
|
13 |
|
|
|
14 |
|
| Tangible net income available to common shareholders |
|
|
|
|
$ |
523 |
|
|
$ |
510 |
|
|
$ |
468 |
|
|
$ |
501 |
|
|
$ |
565 |
|
| |
|
|
|
|
|
|
|
|
|
|
|
|
|
|
|
|
|
|
|
|
|
|
|
|
|
| Average common shareholders' equity |
|
|
|
|
$ |
24,736 |
|
|
$ |
23,957 |
|
|
$ |
22,210 |
|
|
$ |
21,883 |
|
|
$ |
21,895 |
|
| Less: Average intangible assets |
|
|
|
|
|
9,224 |
|
|
|
8,666 |
|
|
|
7,496 |
|
|
|
7,366 |
|
|
|
7,385 |
|
| Average tangible common shareholders' equity |
|
|
|
|
$ |
15,512 |
|
|
$ |
15,291 |
|
|
$ |
14,714 |
|
|
$ |
14,517 |
|
|
$ |
14,510 |
|
| Return on average tangible common shareholders' equity |
|
|
|
|
|
13.37 |
% |
|
|
13.23 |
% |
|
|
12.76 |
% |
|
|
14.00 |
% |
|
|
15.45 |
% |
| |
|
|
|
|
|
|
|
|
|
|
|
|
|
|
|
|
|
|
|
|
|
|
|
|
|
| |
|
|
|
|
|
|
|
|
|
|
|
|
Year-to-Date Dec. 31, |
| |
|
|
|
|
|
|
|
|
|
|
|
|
2015 |
|
2014 |
| Net income available to common shareholders |
|
|
|
|
|
|
|
|
|
|
|
|
|
|
|
|
$ |
1,936 |
|
|
$ |
1,983 |
|
| Plus: |
|
|
|
|
|
|
|
|
|
|
|
|
|
|
|
|
|
|
|
|
|
|
|
| |
Amortization of intangibles, net of tax |
|
|
|
|
|
|
|
|
|
|
|
|
|
|
|
|
|
66 |
|
|
|
57 |
|
| Tangible net income available to common shareholders |
|
|
|
|
|
|
|
|
|
|
|
|
|
|
|
|
$ |
2,002 |
|
|
$ |
2,040 |
|
| Average common shareholders' equity |
|
|
|
|
|
|
|
|
|
|
|
|
|
|
|
|
$ |
23,206 |
|
|
$ |
21,280 |
|
| Less: |
|
|
|
|
|
|
|
|
|
|
|
|
|
|
|
|
|
|
|
|
|
|
|
| |
Average intangible assets |
|
|
|
|
|
|
|
|
|
|
|
|
|
|
|
|
|
8,194 |
|
|
|
7,388 |
|
| Average tangible common shareholders' equity |
|
|
|
|
|
|
|
|
|
|
|
|
|
|
|
|
$ |
15,012 |
|
|
$ |
13,892 |
|
| |
|
|
|
|
|
|
|
|
|
|
|
|
|
|
|
|
|
|
|
|
|
|
|
|
|
| Return on average tangible common shareholders' equity |
|
|
|
|
|
|
|
|
|
|
|
|
|
|
|
|
|
13.34 |
% |
|
|
14.68 |
% |
| (1) |
BB&T's management uses these measures in their analysis of the Corporation's performance and believes these measures provide a greater understanding of ongoing operations and enhance comparability of results with prior periods, as well as demonstrating the effects of significant gains and charges. |
| (2) |
BB&T's management believes investors use this measure to evaluate the return on average common shareholders' equity without the impact of intangible assets and their related amortization. |
| |
|
|
|
|
|
|
|
|
|
|
|
|
|
|
|
|
|
|
|
|
|
|
|
|
|
|
|
|
|
|
|
|
|
20
Exhibit 99.3


Forward - Looking Information This presentation contains “forward - looking statements” within the meaning of the Private Securities Litigation Reform Act of 19 95, regarding the financial condition, results of operations, business plans and the future performance of BB&T that are based on the beliefs and assumptions of the management of BB&T and the information available to management at the time th at these disclosures were prepared. Words such as “anticipates,” “believes,” “estimates,” “expects,” “forecasts,” “intends,” “plans,” “projects,” “may,” “will,” “should,” “could,” and other similar expressions are intended to identify thes e f orward - looking statements. Such statements are subject to factors that could cause actual results to differ materially from anticipated results. Such factors include, but are not limited to, the following: general economic or business conditions, either nationally or regionally, may be less favorable than expected, resulting in, amo ng other things, a deterioration in credit quality and/or a reduced demand for credit, insurance or other services; disruptions to the credit and financial markets, either nationally or globally, including the impact of a downgrade of U.S. g ove rnment obligations by one of the credit ratings agencies and the adverse effects of recessionary conditions in Europe; changes in the interest rate environment and cash flow reassessments may reduce NIM and/or the volumes and values of loans ma de or held as well as the value of other financial assets held; competitive pressures among depository and other financial institutions may increase significantly; legislative, regulatory or accounting changes, including changes resulting from the adoption and implementation of the Dodd - Fran k Act may adversely affect the businesses in which BB&T is engaged; local, state or federal taxing authorities may take tax positions that are adverse to BB&T; a reduction may occur in BB&T’s credit ratings; adverse changes may occur in the securities markets; competitors of BB&T may have greater financial resources and develop products that enable them to compete more successfully t han BB&T and may be subject to different regulatory standards than BB&T; natural or other disasters could have an adverse effect on BB&T in that such events could materially disrupt BB&T’s operation s o r the ability or willingness of BB&T’s customers to access the financial services BB&T offers; costs or difficulties related to the integration of the businesses of BB&T and its merger partners may be greater than expect ed; expected cost savings or revenue growth associated with completed mergers and acquisitions may not be fully realized or reali zed within the expected time frames; significant litigation could have a material adverse effect on BB&T; deposit attrition, customer loss and/or revenue loss following completed mergers and acquisitions may be greater than expecte d ; cyber - security risks, including “denial of service,” “hacking” and “identity theft,” could adversely affect our business and fin ancial performance, or our reputation; h igher than expected costs related to information technology infrastructure or a failure to successfully implement future syst em enhancements could adversely impact BB&T’s financial condition and results of operations and could result in significant additional costs to BB&T; f ailure to execute on the Company’s strategic or operational plans, including the ability to successfully complete and/or inte gra te mergers and acquisitions, could adversely impact BB&T’s financial condition and results of operations; and widespread system outages, caused by the failure of critical internal systems or critical services provided by third parties, co uld adversely impact BB&T’s financial conditions and results of operations. Readers are cautioned not to place undue reliance on these forward - looking statements, which speak only as of the date of this r eport. Actual results may differ materially from those expressed in or implied by any forward - looking statement. Except to the extent required by applicable law or regulation, BB&T undertakes no obligation to revise or update publicly any forwar d - l ooking statements for any reason. Non - GAAP Information This presentation contains financial information and performance measures determined by methods other than in accordance with ac counting principles generally accepted in the United States of America (“GAAP”). BB&T’s management uses these “non - GAAP” measures in their analysis of the Corporation’s performance and the efficiency of its operations. Management believes that these non - GAAP measures provide a greater understanding of ongoing operations and enhance comparability of results with prior periods as well as demonstrating the effects of significant gains and charges in the current period. The c omp any believes that a meaningful analysis of its financial performance requires an understanding of the factors underlying that performance. BB&T’s management believes that investors may use these non - GAAP financial measures to analyze financial performanc e without the impact of unusual items that may obscure trends in the company’s underlying performance. These disclosures should not be viewed as a substitute for financial measures determined in accordance with GAAP, nor are they nece ssa rily comparable to non - GAAP performance measures that may be presented by other companies. Below is a listing of the types of non - GAAP measures used in this presentation: Tangible common equity and related ratios are non - GAAP measures. The return on average risk - weighted assets is a non - GAAP measure . BB&T's management uses these measures to assess the quality of capital and believes that investors may find them useful in their analysis of the Corporation. The ratio of loans greater than 90 days and still accruing interest as a percentage of loans held for investment has been adjusted to remove the impact of loans that are or were covered by FDIC loss sharing agreements. Management believes that their inclusion may result in distortion of these ratios such that they might not be comparable to other periods presented or to other portfolios that were not impacted by purchase accounting . Adjusted fee income and efficiency ratios are non - GAAP in that they exclude securities gains (losses), foreclosed property expen se, amortization of intangible assets, merger - related and restructuring charges, the impact of FDIC loss share accounting and other selected items. BB&T’s management uses these measures in their analysis of the Corporation’s per formance. BB&T’s management believes these measures provide a greater understanding of ongoing operations and enhance comparability of results with prior periods, as well as demonstrating the effects of significa nt gains and charges. Return on average tangible common shareholders’ equity is a non - GAAP measure that calculates the return on average common shareholders’ equity without the impact of intangible assets and their related amortization . This measure is useful for evaluating the performance of a business consistently, whether acquired or developed internally. Core net interest margin is a non - GAAP measure that adjusts net interest margin to exclude the impact of interest income and fun ding costs associated with loans and securities acquired in the Colonial acquisition and purchased credit impaired (“PCI”) loans acquired from Susquehanna. Core net interest margin is also adjusted to remove the purchase acc oun ting marks and related amortization for non - PCI loans and deposits acquired from Susquehanna. BB&T’s management believes that the adjustments to the calculation of net interest margin for certain assets and deposits acq uir ed provide investors with useful information related to the performance of BB&T’s earning assets. A reconciliation of these non - GAAP measures to the most directly comparable GAAP measure is included in BB&T’s Fourth Quarter 2015 Quarterly Performance Summary, which is available on BB&T’s website at www.bbt.com.
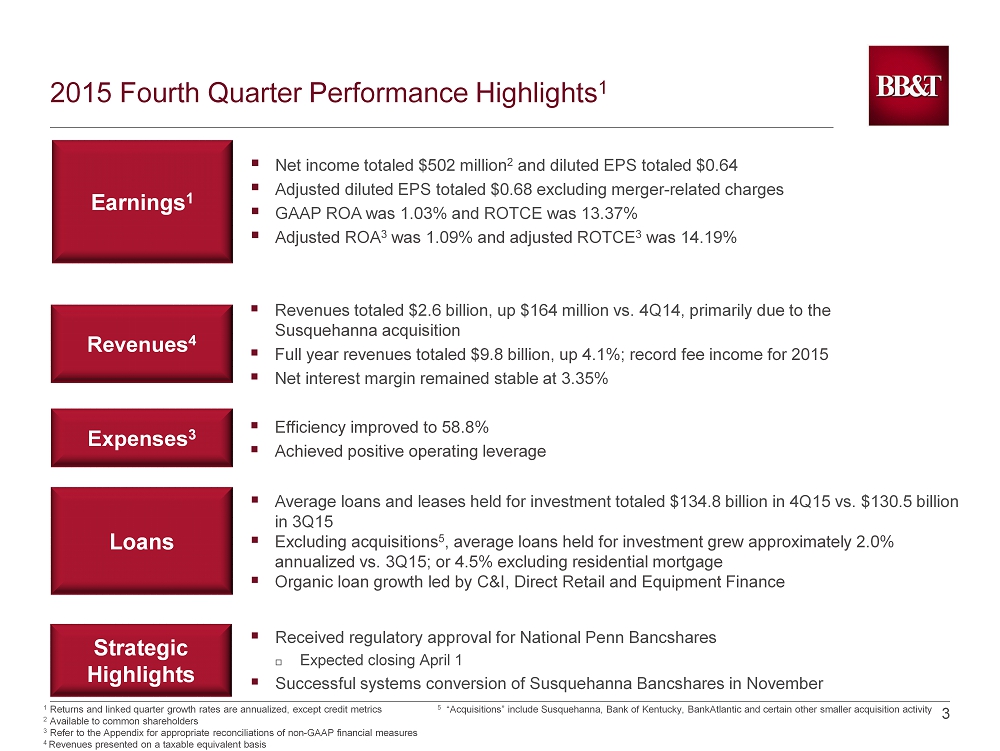
3 3 2015 Fourth Quarter Performance Highlights 1 ▪ Net income totaled $502 million 2 and diluted EPS totaled $0.64 ▪ Adjusted diluted EPS totaled $0.68 excluding merger - related charges ▪ GAAP ROA was 1.03 % and ROTCE was 13.37 % ▪ Adjusted ROA 3 was 1.09% and adjusted ROTCE 3 was 14.19% Earnings 1 Loans ▪ Average loans and leases held for investment totaled $134.8 billion in 4Q15 vs. $130.5 billion in 3Q15 ▪ Excluding acquisitions 5 , average loans held for investment grew approximately 2.0% annualized vs. 3Q15 ; or 4.5% excluding residential mortgage ▪ Organic loan growth led by C&I, Direct R etail and Equipment Finance Strategic Highlights 1 Returns and linked quarter growth rates are annualized, except credit metrics 2 Available to common shareholders 3 Refer to the Appendix for appropriate reconciliations of non - GAAP financial measures 4 Revenues presented on a taxable equivalent basis ▪ Received regulatory approval for National Penn Bancshares Expected closing April 1 ▪ Successful systems conversion of Susquehanna Bancshares in November Revenues 4 ▪ Revenues totaled $ 2.6 billion, up $164 million vs. 4Q14, primarily due to the Susquehanna acquisition ▪ Full year revenues totaled $9.8 billion, up 4.1%; record fee income for 2015 ▪ Net interest margin remained stable at 3.35% Expenses 3 ▪ Efficiency improved to 58.8% ▪ Achieved positive operating leverage 5 “Acquisitions” include Susquehanna, Bank of Kentucky, BankAtlantic and certain other smaller acquisition activity

4 4 Pre - Tax After Tax Diluted EPS Impact Merger - related and restructuring charges $ 50 $ 33 $ (0.04) Selected Items Affecting Earnings ($ in millions, except per share impact)

5 5 Record Loans Following Successful Acquisitions 1 ▪ Average loan growth, excluding acquisitions 3 , was 2.0% annualized and 4.5% annualized excluding residential mortgage, vs. 3Q15 ▪ Experienced strong loan growth vs. 3Q15 in several categories (excludes acquisitions): C&I, up 7.8% annualized 3 Direct Retail, up 11.2% annualized 3 BB&T Equipment Finance, up 13.5 % annualized ▪ Loan growth, excluding acquisitions, continues to reflect runoff in residential mortgage ($432 million lower) and sales finance ($406 million decline) 1 Excludes loans held for sale 2 Other lending subsidiaries consist of AFCO/CAFO/Prime Rate, BB&T Equipment Finance, Grandbridge Real Estate Capital, Sheffield Financial, Regional Acceptance, among others 3 Excludes the impact of acquisitions. See non - GAAP reconciliations included in the Appendix. $118.3 $118.8 $120.0 $130.5 $ 134.8 $100.0 $108.0 $116.0 $124.0 $132.0 $140.0 4Q14 1Q15 2Q15 3Q15 4Q15 Average Loans Held for Investment ($ in billions) C&I $ 48,047 13.5% CRE – IPP 13,264 23.8 CRE – C&D 3,766 29.9 Dealer floor plan 1,164 40.6 Direct retail lending 10,896 38.8 Sales finance 10,533 5.6 Revolving credit 2,458 6.1 Residential mortgage 30,334 (0.7) Other lending subsidiaries 2 13,281 13.7 Acquired from FDIC and PCI 1,070 6.8 Total $ 134,813 13.0% 4 Q15 Average Balance 4 Q15 v. 3Q15 Annualized Increase (Decrease) Average Loans Held for Investment ($ in millions) ▪ Oil and gas portfolio totals $1.4 billion, or 1% of total loans No delinquencies, nonaccruals or losses this quarter ▪ Management expects loan growth of approximately 1% in 1Q16, slowed by seasonal portfolios

6 6 Improved Deposit Mix and Cost $130.3 $129.5 $131.9 $143.8 $ 148.5 0.25% 0.25% 0.24% 0.24% 0.24% 0.20% 0.25% 0.30% 0.35% 0.40% $105.0 $115.0 $125.0 $135.0 $145.0 $155.0 4Q14 1Q15 2Q15 3Q15 4Q15 Total Interest-Bearing Deposit Cost ▪ Average total deposits grew $4.7 billion, or 12.8% annualized ▪ Excluding acquisitions 1 , average noninterest - bearing deposits increased approximately $800 million; or 7.5% annualized ▪ Excluding acquisitions, average noninterest - bearing deposit mix was 32.3% in 4Q15 vs. 31.7% in 3Q15 1 ▪ Time deposits continue to decline ($650 million lower excluding acquired balances) 1 Average Total Deposits ($ in billions) $39.1 $39.7 $41.5 $44.2 $ 45.8 $30.0 $34.0 $38.0 $42.0 $46.0 4Q14 1Q15 2Q15 3Q15 4Q15 Average Noninterest - Bearing Deposits ($ in billions) Noninterest - bearing deposits $ 45,824 15.0% Interest checking 24,157 27.5 Money market & savings 61,431 14.2 Subtotal $ 131,412 16.9% Time deposits 16,981 3.4 Foreign office deposits – Interest - bearing 98 NM Total deposits $ 148,491 12.8% 4Q15 Average Balance 4Q15 v. 3Q15 Annualized Increase (Decrease) Average Deposits ($ in millions) 1 See non - GAAP reconciliations included in the Appendix

7 7 Credit Quality Remains Excellent 1,2 ▪ Loans 90 days or more past due and still accruing decreased $69 million vs. 3Q15 ▪ Loans 30 - 89 days increased 13.5% vs. 3Q15 Reflects conversion of Susquehanna mortgage portfolio to MBA methodology ▪ Management expects 1Q16 net charge - offs to be in the range of 35 to 45 bps, reflecting normal retail seasonality ▪ NPAs decreased 4.3% vs. 3Q15 Decline driven by mortgage loan sale (no gain or loss), offset by a methodology change for mortgage and HELOCs ▪ Management expects NPA levels to remain in a similar range in 1Q16 0.42% 0.40% 0.38% 0.36% 0.34% 0.00% 0.20% 0.40% 0.60% 4Q14 1Q15 2Q15 3Q15 4Q15 Total Nonperforming Assets as a Percentage of Total Assets Annualized Net Charge - offs / Average Loans 1 Includes acquired from FDIC and PCI; excludes loans held for sale 2 See non - GAAP reconciliations included in the Appendix 0.39% 0.34% 0.33% 0.32% 0.38% 0.00% 0.20% 0.40% 0.60% 4Q14 1Q15 2Q15 3Q15 4Q15

8 8 Allowance Coverage Ratios Remain Strong 3.21x 3.60x 3.71x 3.44x 2.83x 2.39x 2.45x 2.55x 2.49x 2.53x 1.00 2.00 3.00 4.00 4Q14 1Q15 2Q15 3Q15 4Q15 ALLL to Net Charge-offs ALLL to NPLs HFI ▪ Coverage ratios remain healthy at 2.83x and 2.53x for the allowance to net charge - offs and NPLs, respectively ▪ The ALLL to loans ratio was 1.07%, compared to 1.08% last quarter Loan portfolios have a remaining mark of approximately $750 million Total ACL is $1.55 billion ▪ Oil and gas - related loans reflect an allowance for credit losses of approximately 5%. ALLL Coverage Ratios
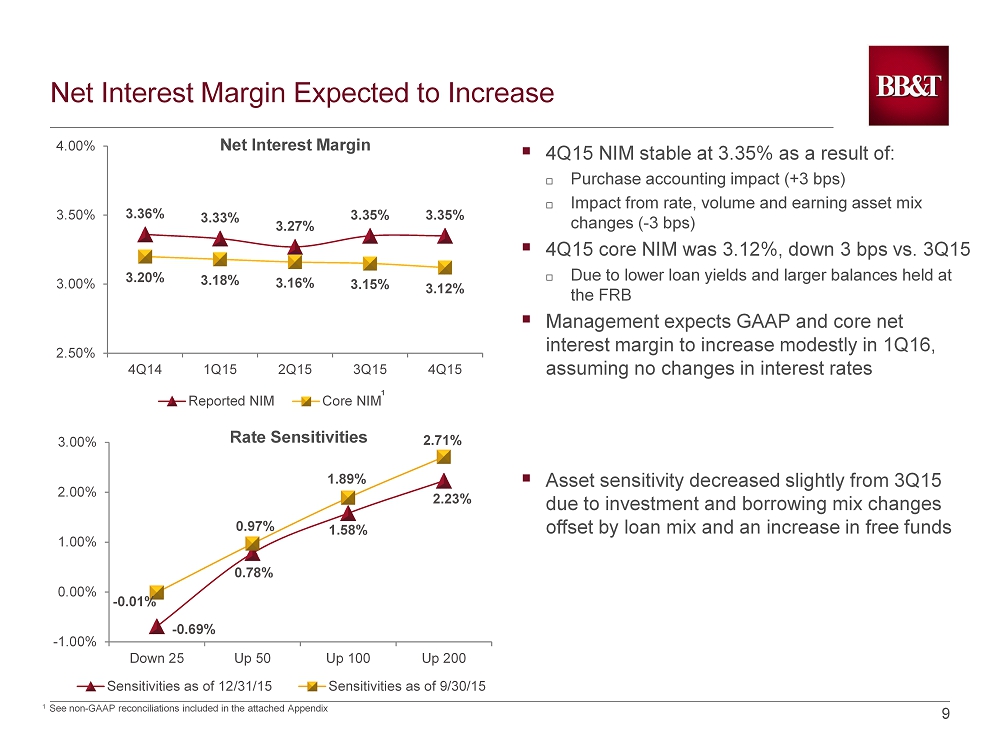
9 9 Net Interest Margin Expected to Increase 3.36% 3.33% 3.27% 3.35% 3.35% 3.20% 3.18% 3.16% 3.15% 3.12% 2.50% 3.00% 3.50% 4.00% 4Q14 1Q15 2Q15 3Q15 4Q15 Reported NIM Core NIM ▪ 4Q15 NIM stable at 3.35% as a result of: Purchase accounting impact (+3 bps) Impact from rate, volume and earning asset mix changes ( - 3 bps) ▪ 4Q15 core NIM was 3.12%, down 3 bps vs. 3Q15 Due to lower loan yields and larger balances held at the FRB ▪ Management expects GAAP and core net interest margin to increase modestly in 1Q16, assuming no changes in interest rates ▪ Asset sensitivity decreased slightly from 3Q15 due to investment and borrowing mix changes offset by loan mix and an increase in free funds Net Interest Margin 1 - 0.69% 0.78% 1.58% 2.23% - 0.01% 0.97% 1.89% 2.71% -1.00% 0.00% 1.00% 2.00% 3.00% Down 25 Up 50 Up 100 Up 200 Sensitivities as of 12/31/15 Sensitivities as of 9/30/15 Rate Sensitivities 1 See non - GAAP reconciliations included in the attached Appendix

10 10 Fee Income Increases 10.8% ▪ Insurance income increased $26 million vs. 3Q15 primarily due to seasonality Decline vs. 4Q14 results from American Coastal sale ▪ Investment banking and brokerage fees and commissions decreased $14 million due to higher capital markets activity in the prior quarter ▪ Other income was up $15 million primarily due to: $25 million increase in income related to assets for certain post - employment benefits, which is offset in personnel expense $12 million improvement in client derivative income Offset by: A decrease of $20 million in partnership and other investment income 46.2% 45.8% 46.3% 42.1% 41.8% 35.0% 40.0% 45.0% 50.0% 4Q14 1Q15 2Q15 3Q15 4Q15 Fee Income Ratio 1,3 4Q15 4Q15 v. 3Q15 2 Increase (Decrease) 4Q15 v. 4Q14 Increase (Decrease) Insurance income $ 380 29.1 % (7.1) % Service charges on deposits 165 (4.8) 3.1 Mortgage banking income 104 (25.0) (18.8) Investment banking and brokerage fees and commissions 91 (52.9) (18.8) Trust and investment advisory revenues 64 6.3 14.3 Bankcard fees and merchant discounts 56 (7.0) 7.7 Checkcard fees 47 17.6 14.6 Operating lease income 33 12.4 13.8 Income from bank - owned life insurance 27 (27.4) (10.0) FDIC loss share income, net (52) (41.0) (38.1) Securities gains (losses), net - NM NM Other income 3 100 70.0 12.4 Total noninterest income $ 1,015 10.8 % (0.7) % Noninterest Income ($ in millions) 1 Excludes securities gains (losses), the impact of FDIC loss share accounting and other selected items. See non - GAAP reconciliations incl uded in the attached Appendix 2 Linked quarter percentages are annualized 3 Effective 1/1/15, BB&T retrospectively adopted new accounting guidance for Qualified Affordable Housing investments. Prior period infor mat ion has been revised to conform to the current presentation ▪ Management expects modest growth in fee income in 1Q16 led by insurance and investment banking, offset by lower mortgage and service charges on deposits

11 11 Noninterest Expense Reflects Acquisitions 4Q15 4Q15 v. 3Q15 2 Increase (Decrease) 4Q15 v. 4Q14 Increase (Decrease) Personnel expense $ 893 4.9 % 12.5 % Occupancy and equipment expense 192 19.5 14.3 Software expense 52 15.9 15.6 Loan - related expense 37 (10.4) (47.9) Outside IT services 41 68 .0 51.9 Professional services 29 (122.8) (23.7) Amortization of intangibles 32 41.0 45.5 Regulatory charges 28 47.6 16.7 Foreclosed property expense 11 (105.8) 10.0 Merger - related and restructuring charges, net 50 (139.1) (177.8) Other expense 232 25.5 31.1 Total noninterest expense $ 1,597 0.7 % 14.6 % Noninterest Expense ($ in millions) 1 Excludes certain items as detailed in non - GAAP reconciliation section 2 Linked quarter percentages are annualized 3 Effective 1/1/15, BB&T retrospectively adopted new accounting guidance for Qualified Affordable Housing investments. Prior period infor mat ion has been revised to conform to the current presentation 55.6% 58.5% 59.2% 59.2% 58.8% 50.0% 55.0% 60.0% 65.0% 4Q14 1Q15 2Q15 3Q15 4Q15 Efficiency Ratio 1,3 ▪ Personnel expense increased $11 million vs. 3Q15 primarily due to: Higher salary expenses from increased headcount from acquisitions and I ncrease in post - employment benefits Offset by: Improved expenses related to medical insurance benefits and A reduction in equity - based compensation due to timing of expense recognition for retirement eligible employees ▪ Other expense increased $14 million primarily due to operating charge - off adjustments, charitable contributions and travel ▪ Average FTEs increased 1,057 primarily due to the Susquehanna acquisition ▪ 4Q15 effective tax rate was 31.7%. Management expects the effective tax rate for 1Q16 to be similar to this quarter. ▪ Management expects 1Q16 expenses to be flat vs. 4Q15 due to higher FICA / employee benefits expenses offset by lower merger - related costs

12 12 Capital and Liquidity Strength 10.6% 10.5% 10.4% 10.1% 10.2% 9.0% 9.5% 10.0% 10.5% 11.0% 4Q14 1Q15 2Q15 3Q15 4Q15 ▪ The common equity tier 1 ratio was 10.0% on a fully phased in basis. ▪ BB&T’s 4Q15 LCR was 130% driven by strong deposit growth and the acquisitions ▪ BB&T’s 4Q15 liquid asset buffer was 13.5% (high quality liquid assets as a percentage of total assets) 1 C urrent quarter regulatory capital information is preliminary. Risk - weighted assets are determined based on regulatory capital requirements in effect for the period presented. The ratio for periods prior to 2015 is the Tier 1 common equity ratio, which was based on the definition used for the SCAP assessment. This ratio was a non - GA AP measure. BB&T's management used this measure to assess the quality of capital and believes that investors found the measure useful in their analysis of the Corporation. This capital measure was not necessarily comparable to similar capital measures that may be presented by other companies. Management believes this measure was fairly comparable to Common Equity Tier 1 capital, which is required under Basel III . 2 Under Transitional Approach Common Equity Tier 1 1 Basel I Basel III 2

13 13 ($ in millions) Inc/(Dec) vs 3Q15 Inc/(Dec) vs 4Q14 4 Q15 Comments 3 Net Interest Income Noninterest Income 1 Provision for Credit Losses Noninterest Expense 2 Income Tax Expense Segment Net Income Highlighted Metrics $ 855 331 39 718 157 $ 272 $ 83 (8) 35 26 5 $ 9 $ 125 2 19 73 13 $ 22 ($ in billions) 4Q15 Like Total Commercial Loans Direct Retail Lending Money Market and Savings Noninterest Bearing Deposits 14.1% 27.3% 16.7% 15.9% Link 3 40.9% 66.4% 31.0% 25.3% Change Community Banking Segment ▪ Commercial production increased $617 million, or 16.7%, compared to 4Q14 ▪ Direct Retail Lending production increased $325 million, or 44.7%, compared to 4Q14 ▪ Approximately $47 million of the Net Interest Income increase on a linked quarter basis was attributable to the Susquehanna acquisition ▪ Noninterest Expense increase on a linked quarter basis was primarily due to the Susquehanna acquisition ▪ BB&T has received regulatory approval for its merger with National Penn, which is expected to close April 1, 2016 and systems conversion in the 3 rd quarter Serves individual and business clients by offering a variety of loan and deposit products and other financial services 4 $43.8 $10.1 $44.5 $40.3 1 Noninterest Income includes intersegment net referral fees 2 Noninterest Expense includes amortization of intangibles and allocated corporate expense 3 Linked quarter growth rates annualized except for production 4 Community Bank’s financial results include the impact of the Susquehanna Bank branch performance from the system conversion date of No vem ber 9 th . Prior to conversion the banking performance was included in Other, Treasury & Corporate Segment

14 14 Retains and services mortgage loans originated by the Residential Mortgage Lending Division and through its referral relation shi p with the Community Bank and referral partners as well as those purchased from various correspondent originators ($ in millions) Inc /(Dec) vs 3Q15 Inc/(Dec) vs 4Q14 4Q15 Comments 4 Net Interest Income Noninterest Income 1 Provision for Credit Losses Noninterest Expense 2 Income Tax Expense Segment Net Income Highlighted Metrics $ 111 79 8 102 31 $ 49 $ (9) (22) 46 (25) (19) $ (33) ($ in billions) 1 Noninterest Income includes intersegment net referral fees 2 Noninterest Expense includes amortization of intangibles and allocated corporate expense 3 Credit quality metrics are based on Loans Held for Investment Change Residential Mortgage Banking Segment $ (5) (14) (2) (3) (4) $ (10) 4 Linked quarter growth rates annualized except for production and sales 4Q15 Link 4 Like Retail Originations $ 1.5 (17.3%) (14.8%) Correspondent Purchases $ 2.0 (37.5%) (3.8%) Total Production $ 3.5 (29.9%) (9.1%) Loan Sales $ 3.1 (36.8%) (16.9%) Loans Serviced for others (EOP) $ 91.1 3.0% 1.0% ▪ The production mix was 58% purchase / 42% refinance in 4Q15 vs . 67% / 33% in 3Q15 ▪ Noninterest income decreased vs. 3Q15 due to lower production ▪ Decrease in net interest income vs. 4Q14 driven by lower HFI balances due to current strategy of selling substantially all conforming originations ▪ Decrease in noninterest expense vs. 4Q14 primarily reflects a charge related to a review of mortgage lending processes in the earlier quarter ▪ Credit quality 3 : 30+ days and still accruing delinquency of 2.70% Nonaccruals of 0.57% Net charge - offs of 0.19%
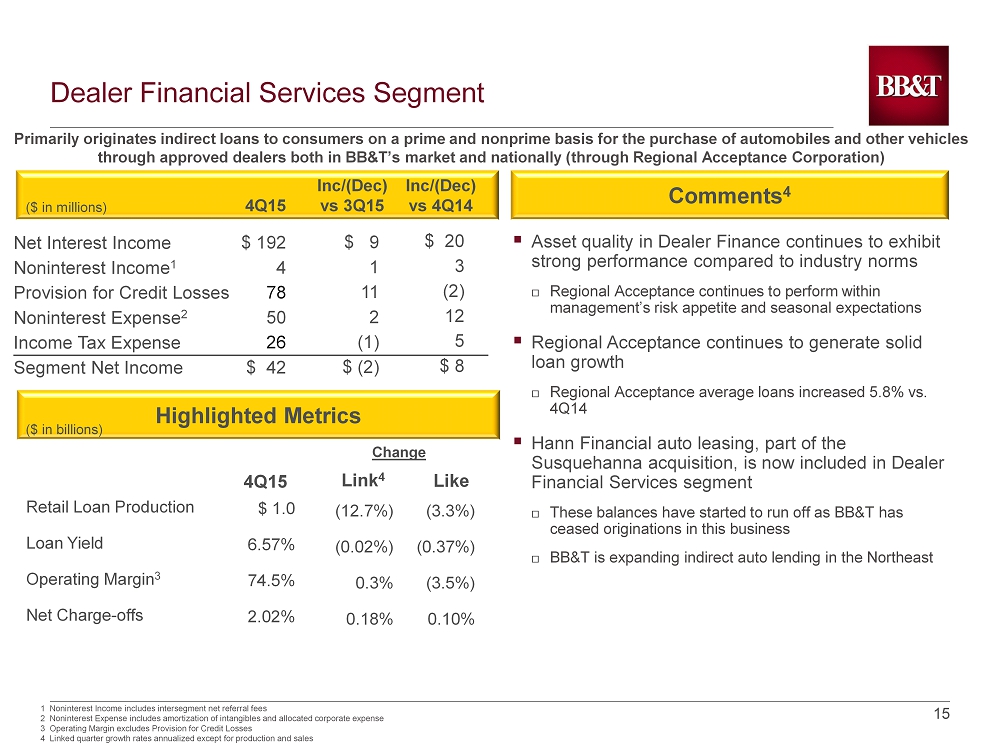
15 15 Primarily originates indirect loans to consumers on a prime and nonprime basis for the purchase of automobiles and other vehi cle s through approved dealers both in BB&T’s market and nationally (through Regional Acceptance Corporation) Comments 4 ($ in millions) Inc /(Dec) vs 3Q15 Inc /(Dec) vs 4Q14 4Q15 Net Interest Income Noninterest Income 1 Provision for Credit Losses Noninterest Expense 2 Income Tax Expense Segment Net Income Highlighted Metrics 4Q15 Like $ 192 4 78 50 26 $ 42 $ 9 1 11 2 (1) $ (2) $ 20 3 (2) 12 5 $ 8 Retail Loan Production Loan Yield Operating Margin 3 Net Charge - offs $ 1.0 6.57% 74.5% 2.02% (3.3%) (0.37%) (3.5%) 0.10% 1 Noninterest Income includes intersegment net referral fees 2 Noninterest Expense includes amortization of intangibles and allocated corporate expense 3 Operating Margin excludes Provision for Credit Losses 4 Linked quarter growth rates annualized except for production and sales ($ in billions) Link 4 (12.7%) (0.02%) 0.3% 0.18% Change Dealer Financial Services Segment ▪ Asset quality in Dealer Finance continues to exhibit strong performance compared to industry norms Regional Acceptance continues to perform within management’s risk appetite and seasonal expectations ▪ Regional Acceptance continues to generate solid loan growth Regional Acceptance average loans increased 5.8% vs. 4Q14 ▪ Hann Financial auto leasing, part of the Susquehanna acquisition, is now included in Dealer Financial Services segment These balances have started to run off as BB&T has ceased originations in this business BB&T is expanding indirect auto lending in the Northeast

16 16 Provides specialty lending including: commercial finance, mortgage warehouse lending, tax - exempt governmental finance, equipment leasing, commercial mortgage banking, insurance premium finance, dealer - based equipment financing, and direct consumer finance Comments 4 ($ in millions) Inc/(Dec) vs 3Q15 Inc /(Dec) vs 4Q14 4Q15 Net Interest Income Noninterest Income 1 Provision for Credit Losses Noninterest Expense 2 Income Tax Expense Segment Net Income Highlighted Metrics 4Q15 Like $ 126 73 12 90 26 $ 71 $ 3 13 2 10 2 $ 2 $ 18 4 (1) 14 3 $ 6 ($ in billions) Loan Originations Loan Yield Operating Margin 3 Net Charge - offs $ 5.0 4.53% 54.8% 0.25% 11.5% 0.12% (2.3%) 0.04% 1 Noninterest Income includes intersegment net referral fees 2 Noninterest Expense includes amortization of intangibles and allocated corporate expense 3 Operating Margin excludes Provision for Credit Losses 4 Linked quarter growth rates annualized except for production and sales 4.7% 0.12% (1.5%) (0.01%) Link 4 Change Specialized Lending Segment ▪ Sheffield Financial’s loan growth continues to be solid: Average loans increased 14.0% vs. 4Q14 4Q15 production increased 6.9% compared to 4Q14 ▪ Grandbridge continued strong commercial mortgage banking production 4Q15 mortgage banking fees increased $7.7 million compared to 3Q15 ▪ Equipment Finance experienced strong new business volume 4Q15 production increased 7.3% compared to 4Q14

17 17 Comments 4 ($ in millions) Inc/(Dec) vs 3Q15 Inc/(Dec) 4Q14 4Q15 Net Interest Income Noninterest Income 1 Provision for Credit Losses Noninterest Expense 2 Income Tax Expense Segment Net Income Highlighted Metrics Noninterest Income Number of Stores 3 EBITDA Margin 5 4 Q15 Like Provides property and casualty, life, and health insurance to business and individual clients. It also provides workers comp ens ation and professional liability, as well as surety coverage and title insurance $ 2 388 - 331 23 $ 36 $ (1) 35 - 10 9 $ 15 $ (1) (33) - 8 (13) $ (29) $ 388 197 19.2% (7.8%) (1) (3.6%) Change 39.3% 1 5.3% Link 4 ($ in millions ) Insurance Services Segment 5 Excludes American Coastal and merger related and restructuring charges 6 Excludes American Coastal ▪ BB&T Insurance generated insurance commission revenue 6 growth vs 4Q14: (0.9%) for Retail / 4.4% for Wholesale 1.6% for Total Insurance ▪ Higher noninterest income vs 3Q15 was primarily due to seasonality in property and casualty commissions ▪ Lower noninterest income vs. 4Q14 quarter was primarily due to the sale of American Coastal ▪ Insurance produced P&C and EB YTD new business growth vs 2014 : 1.8% for Retail / 4.1% for Wholesale 3.3% for Total Insurance ▪ YTD same store sales growth 6 of 1.4% vs 2014 1 Noninterest Income includes intersegment net referral fees 2 Noninterest Expense includes amortization of intangibles, allocated corporate expense, and $2.6 million of one - time merger related charges 3 U.S . Locations, count includes shared locations 4 Linked quarter growth rates annualized except for production and sales

18 18 Provides trust services, wealth management, investment counseling, asset management, estate planning, employee benefits, corporate banking, and capital market services to individuals, corporations, governments, and other organizations Comments 4 ($ in millions) Inc/(Dec) vs 3Q15 Inc/(Dec) vs 4Q14 4Q15 Net Interest Income Noninterest Income 1 Provision for Credit Losses Noninterest Expense 2 Income Tax Expense Segment Net Income Highlighted Metrics Average Loan Balances Average Deposits Total Invested Assets Invested Assets Noninterest Income ($ in millions ) Operating Margin 3 4 Q15 Like $ 144 220 (3) 202 62 $ 103 $ 10 (10) (24) (9) 12 $ 21 $ 24 (6) (20) - 14 $ 24 $ 14.6 $ 29.9 $ 130.6 $ 131.1 44.5% 1 Noninterest Income includes intersegment net referral fees 2 Noninterest Expense includes amortization of intangibles and allocated corporate expense 3 Operating Margin excludes Provision for Credit Losses 4 Linked quarter growth rates annualized except for production and sales ($ in billions) Link 4 27.5% 6.0% 26.8% 10.2% 2.5% Change 28.6% 9.2% 5 9.8% 5.9% 2.9% Financial Services Segment ▪ Average loan and deposit growth was driven by : Corporate Banking, which generated - 29.2% loan growth vs . 3 Q15 - 29.2% loan growth vs . 4Q14 BB&T Wealth, which generated - 15.6% loan growth and 20.7% transaction deposit growth vs. 3Q15 - 26.9% loan growth and 17.9% 5 transaction deposit growth vs. 4Q14 ▪ Decrease in noninterest income vs. 3Q15 was driven by lower SBIC partnership income and Investment Banking revenues ▪ BB&T Retirement and Institutional Services received the #1 distinction for client satisfaction for the 2nd year in a row and received 42 Best in Class Awards in the annual PlanSponsor survey ▪ Susquehanna acquisition provided $4.9 billion in invested assets and was the primary driver of the 4Q15 increase 5 Adjusted to exclude the 2015 inclusion of BB&T Wealth trust and other personal deposits residing in commercial products

19

20

Capital Measures 1 (Dollars in millions, except per share data) 1 2 Current quarter regulatory capital is preliminary Risk - weighted assets are determined based on regulatory capital requirements in effect for the period presented 3 4 Tangible common equity and related ratios are non - GAAP measures. BB&T's management uses these measures to assess the quality of capital and believes that investors may find them useful in their analysis of the Corporation. These capital measures are not necessarily comparable to similar capital measures that may be presented by othe r c ompanies . Under transitional approach 21 As of / Quarter Ended Dec. 31 Sept. 30 June 30 March 31 Dec. 31 2015 2015 2015 2015 2014 Selected Capital Information Risk - based capital: Basel III 4 Basel I Common equity tier 1 $ 17,081 $ 16,822 $ 16,031 $ 15,755 N/A Tier 1 19,682 19,422 18,633 18,320 $ 17,840 Total 23,755 23,612 21,896 21,654 21,381 Risk - weighted assets 2 166,784 165,990 154,493 150,092 143,675 Average quarterly tangible assets 209,131 195,623 182,444 180,790 179,785 Risk - based capital ratios: Common equity tier 1 10.2% 10.1% 10.4% 10.5% N/A Tier 1 11.8 11.7 12.1 12.2 12.4% Total 14.2 14.2 14.2 14.4 14.9 Leverage capital ratio 9.8 9.9 10.2 10.1 9.9 Equity as a percentage of total assets 13.0 13.1 13.2 13.1 13.0 Common equity per common share $ 31.66 $ 31.56 $ 30.64 $ 30.48 $ 30.09 Selected non - GAAP Capital Information 3 Tangible common equity as a percentage of tangible assets 7.7% 7.7% 8.1% 8.0% 8.0% Tangible common equity per common share $ 19.82 $ 19.77 $ 20.21 $ 20.13 $ 19.86

Non - GAAP Reconciliations 1 22 (Dollars in millions, except per share data) 1 2 Current quarter regulatory capital is preliminary Tangible common equity and related ratios are non - GAAP measures. BB&T's management uses these measures to assess the quality of capital and believes that investors may find them useful in their analysis of the Corporation. These capital measures are not necessarily comparable to similar capital measures that may be presented by oth er companies. Calculations of tangible common equity, tangible assets and related measures 2 : Total shareholders' equity $ 27,340 $ 27,264 $ 25,132 $ 24,738 $ 24,377 Less: Preferred stock 2,603 2,603 2,603 2,603 2,603 Noncontrolling interests 34 40 52 96 88 Intangible assets 9,234 9,198 7,655 7,480 7,374 Tangible common equity $ 15,469 $ 15,423 $ 14,822 $ 14,559 $ 14,312 Total assets $ 209,947 $ 208,809 $ 191,017 $ 189,228 $ 186,834 Less: Intangible assets 9,234 9,198 7,655 7,480 7,374 Tangible assets $ 200,713 $ 199,611 $ 183,362 $ 181,748 $ 179,460 Tangible common equity as a percentage of tangible assets 7.7% 7.7% 8.1% 8.0% 8.0% Tangible common equity $ 15,469 $ 15,423 $ 14,822 $ 14,559 $ 14,312 Outstanding shares at end of period (in thousands) 780,337 780,150 733,481 723,159 720,698 Tangible common equity per common share $ 19.82 $ 19.77 $ 20.21 $ 20.13 $ 19.86 As of / Quarter Ended Dec. 31 Sept. 30 June 30 March 31 Dec. 31 2015 2015 2015 2015 2014

Non - GAAP Reconciliations 1 23 1 BB&T’s management uses these measures in their analysis of the Corporation’s performance and believes these measures pro vide a greater understanding of ongoing operations and enhance comparability of results with prior periods, as well as demonstrating the effects of significant gains and charges. Quarter Ended Dec. 31 Sept. 30 June 30 March 31 Dec. 31 Efficiency and Fee Income Ratios 2015 2015 2015 2015 2014 Efficiency ratio - GAAP 62.4% 64.1% 69.8% 60.7% 58.3% Effect of merger - related and restructuring charges, net (1.9) (3.1) (1.1) (0.5) ( 0.7) Effect of loss on sale of American Coastal - - (0.8) - - Effect of mortgage reserve adjustments - - - - ( 1.1) Effect of loss on early extinguishment of debt - - (7.1) - - Effect of franchise tax adjustment - - - - 0.6 Effect of FDIC loss share accounting - - (0.1) (0.1) ( 0.1) Effect of foreclosed property expense (0.4) (0.6) (0.6) (0.6) ( 0.4) Effect of amortization of intangibles (1.3) (1.2) (0.9) ( 1.0) ( 1.0) Efficiency ratio - reported 58.8% 59.2% 59.2% 58.5% 55.6% Fee Income ratio - GAAP 39.7% 39.7% 43.0% 42.5% 42.7% Effect of loss on sale of American Coastal - - 0.6 - - Effect of FDIC loss share accounting 2.1 2.4 2.7 3.3 3.5 Fee Income ratio - reported 41.8% 42.1% 46.3% 45.8% 46.2% Note: Effective 1/1/15, BB&T retrospectively adopted new accounting guidance for Qualified Affordable Housing investments. Pr io r period information has been revised to conform to the current presentation

24 1 BB&T’s management believes investors use this measure to evaluate the return on average common shareholders’ equity withou t t he impact of intangible assets and their related amortization. Non - GAAP Reconciliations 1 (Dollars in millions) Quarter Ended Dec. 31 Sept. 30 June 30 March 31 2015 Dec. 31 2014 Return on Average Tangible Common Shareholders' Equity 2015 2015 2015 Net income available to common shareholders $ 502 $ 492 $ 454 $ 488 $ 551 Plus: Amortization of intangibles, net of tax 21 18 14 13 14 Tangible net income available to common shareholders $ 523 $ 510 $ 468 $ 501 $ 565 Average common shareholders' equity $ 24,736 $ 23,957 $ 22,210 $ 21,883 $ 21,895 Less: Average intangible assets 9,224 8,666 7,496 7,366 7,385 Average tangible common shareholders' equity $ 15,512 $ 15,291 $ 14,714 $ 14,517 $ 14,510 Return on Average Tangible Common Shareholders ' Equity 13.37% 13.23% 12.76% 14.00% 15.45% Note: Effective 1/1/15, BB&T retrospectively adopted new accounting guidance for Qualified Affordable Housing investments. Pr io r period information has been revised to conform to the current presentation

Non - GAAP Reconciliations 1 Quarter Ended Reported net interest margin vs. core net interest margin Dec. 31 2015 Sept. 30 2015 June 30 2015 March 31 2015 Dec. 31 2014 Reported net interest margin - GAAP 3.35% 3.35% 3.27% 3.33% 3.36% Adjustments to interest income for assets acquired: Effect of securities acquired from FDIC (0.03) (0.04) (0.04) (0.06) (0.06) Effect of loans acquired from FDIC and PCI (0.11) (0.07) (0.08) (0.10) (0.11) Effect of purchase accounting marks on non - PCI loans acquired from Susquehanna (0.07) (0.08) - - - Adjustments to interest expense: Effect of purchase accounting marks on time deposits assumed from Susquehanna (0.02) (0.01) - - - Effect of interest expense related to acquired assets - - 0.01 0.01 0.01 Core net interest margin 3.12% 3.15% 3.16% 3.18% 3.20% 25 1 Core net interest margin is a non - GAAP measure that adjusts net interest margin to exclude the impact of interest income and funding costs associated with loans and securities acquired in the Colonial acquisition and purchased credit impaired (“PCI”) loans acquired from Susquehanna. Core net interest margin is also adjusted to remove th e p urchase accounting marks and related amortization for non - PCI loans and deposits acquired from Susquehanna. BB&T’s management believes that the adjustments to the calculation of net interest margin for cert ain assets and deposits acquired provide investors with useful information related to the performance of BB&T’s earning assets

Non - GAAP Reconciliations 1 26 1 BB&T’s management uses these measures in their analysis of the Corporation’s performance and believes these measures provide a g reater understanding of ongoing operations and enhance comparability of results with prior periods, as well as demonstrating the effects of significant gains and charges. (Dollars in millions) For the Quarter Ended Adjusted return on average assets Dec. 31, 2015 Net income $542 Plus: merger - related and restructuring charges, net of tax 33 Adjusted net income $575 Average assets $209,217 Plus: impact of merger - related and restructuring charges, net of tax 17 Adjusted average assets $209,234 Return on average assets (excluding merger - related and restructuring charges), as adjusted 1.09%

Non - GAAP Reconciliations 1 27 (Dollars in millions) 1 BB&T’s management uses these measures in their analysis of the Corporation’s performance and believes these measures provide a g reater understanding of ongoing operations and enhance comparability of results with prior periods, as well as demonstrating the effects of significant gains and charges. Adjusted return on average tangible common shareholders’ equity For the quarter ended December 31, 2015 Net Income Available to Common Shareholders $502 Plus: Amortization of intangibles, net of tax 21 Merger - related and restructuring charges, net of tax 33 Adjusted tangible net income available to common shareholders $556 Average common shareholders' equity $24,736 LESS: Average intangible assets 9,224 PLUS: Average merger - related and restructuring charges, net of tax 17 Adjusted average tangible shareholders' equity $15,529 Adjusted return on average tangible common shareholders' equity 14.19%

Non - GAAP Reconciliations 1 28 1 BB&T’s management uses these measures in their analysis of the Corporation’s performance and believes these measures provide a greater understanding of ongoing operations and enhance comparability of results with prior periods, as well as demonstrating the effects of significant gains and charges. (Dollars in millions) Loans December 31, 2015 Link Qtr Reported Acquired Adjusted Adj Growth Ann. Commercial and industrial $ 48,047 $ (4,070) $ 43,977 $ 848 7.8 % CRE - income producing properties 13,264 (2,381) 10,883 67 2.5 CRE - construction and development 3,766 (863) 2,903 12 1.6 Dealer floor plan 1,164 - 1,164 108 40.6 Direct retail lending 10,896 (2,255) 8,641 237 11.2 Sales finance 10,533 (1,710) 8,823 (406) (17.5) Revolving credit 2,458 (7) 2,451 37 6.1 Residential mortgage 30,334 (1,828) 28,506 (432) (5.9) Specialized lending subsidiaries 13,281 (744) 12,537 227 7.3 Subtotal 133,743 (13,858) 119,885 698 2.3 Purchased credit - impaired loans (PCI) 1,070 (229) 841 (98) (41.4) Total average loans and leases HFI $ 134,813 (14,087) $ 120,726 $ 600 2.0 % September 30 , 2015 Reported Acquired Adjusted Commercial and industrial $ 46,462 $ (3,333) $ 43,129 CRE - income producing properties 12,514 (1,698) 10,816 CRE - construction and development 3,502 (611) 2,891 Dealer floor plan 1,056 - 1,056 Direct retail lending 9,926 (1,522) 8,404 Sales finance 10,386 (1,157) 9,229 Revolving credit 2,421 (7) 2,414 Residential mortgage 30,384 (1,446) 28,938 Specialized lending subsidiaries 12,837 (527) 12,310 Subtotal 129,488 (10,301) 119,187 Purchased credit - impaired loans (PCI) 1,052 (113) 939 Total average loans and leases HFI $ 130,540 (10,414) $ 120,126 Link Quarter Average Balance Growth Adjusted for Acquisitions

Non - GAAP Reconciliations 1 29 1 BB&T’s management uses these measures in their analysis of the Corporation’s performance and believes these measures provide a greater understanding of ongoing operations and enhance comparability of results with prior periods, as well as demonstrating the effects of significant gains and charges. (Dollars in millions) September 30 , 2015 Reported Acquired Adjusted Noninterest - bearing deposits $ 44,153 (1,988) $ 42,165 Interest checking 22,593 (2,624) 19,969 Money market and savings 59,306 (3,397) 55,909 Subtotal 126,052 (8,009) 118,043 Time deposits 16,837 (2,949) 13,888 Foreign office deposits - interest - bearing 948 - 948 Total deposits $ 143,837 (10,958) $ 132,879 Deposits December 31, 2015 Link Qtr Reported Acquired Adjusted Adj Growth Ann. Noninterest - bearing deposits $ 45,824 $ (2,860) $ 42,964 799 7.5 % Interest checking 24,157 (3,966) 20,191 222 4.4 Money market and savings 61,431 (4,986) 56,445 536 3.8 Subtotal 131,412 (11,812) 119,600 1,557 5.2 Time deposits 16,981 (3,742) 13,239 (649) (18.5) Foreign office deposits - interest - bearing 98 - 98 (850) NM Total deposits $ 148,491 (15,554) $ 132,937 58 0.2 % Link Quarter Average Balance Growth Adjusted for Acquisitions
BB and T (NYSE:BBT)
Historical Stock Chart
From Mar 2024 to Apr 2024

BB and T (NYSE:BBT)
Historical Stock Chart
From Apr 2023 to Apr 2024
