UNITED STATES
SECURITIES AND EXCHANGE COMMISSION
Washington, D.C. 20549
______________
Form 8-K
Current Report
______________
Pursuant to Section 13 or 15(d)
of the Securities Exchange Act of
1934
November 5, 2015
Date of Report (Date of earliest
event reported)
BB&T Corporation
(Exact name of registrant as specified
in its charter)
Commission file number: 1-10853
______________
| North Carolina |
56-0939887 |
| (State of incorporation) |
(I.R.S. Employer Identification No.) |
| 200 West Second Street |
|
| Winston-Salem, North Carolina |
27101 |
| (Address of principal executive offices) |
(Zip Code) |
(336) 733-2000
(Registrant's telephone number, including
area code)
______________
Check the appropriate box below
if the Form 8-K filing is intended to simultaneously satisfy the filing obligation of the registrant under any of the following
provisions:
[ ] Written communications pursuant to Rule 425 under the
Securities Act (17 CFR 230.425)
[ ] Soliciting material pursuant to Rule 14a-12 under the
Exchange Act (17 CFR 240.14a-12)
[ ] Pre-commencement communications pursuant to Rule 14d-2(b)
under the Exchange Act (17 CFR 240.14d-2(b))
[ ] Pre-commencement communications pursuant to Rule 13e-4(c)
under the Exchange Act (17 CFR 240.13e-4(c))
| Item 7.01 |
Regulation FD Disclosure |
BB&T Corporation’s Chief Financial
Officer, Daryl N. Bible, will present at the BancAnalysts Association of Boston Conference on Thursday, November 5, 2015 at
7:25 am, E.T. A webcast of Mr. Bible's presentation will be available at www.BBT.com and will be archived for 30 days.
| ITEM 9.01 |
Financial Statements and Exhibits |
| Exhibit No. |
Description of Exhibit |
| 99.1 |
Copy of press release announcing Daryl N. Bible’s presentation at the BancAnalysts Association of Boston Conference. |
| 99.2 |
Copy of
Daryl N. Bible’s slide presentation. |
| |
|
S I G N A T U R E
Pursuant to the
requirements of the Securities Exchange Act of 1934, the registrant has duly caused this report to be signed on its behalf by the
undersigned hereunto duly authorized.
| |
BB&T CORPORATION |
| |
(Registrant) |
| |
|
| |
By: /s/ Cynthia B. Powell |
| |
|
| |
Cynthia B. Powell |
| |
Executive Vice President and Corporate Controller |
| |
(Principal Accounting Officer) |
Date: November 5, 2015
Exhibit 99.1
Oct. 29, 2015
FOR IMMEDIATE RELEASE
| Contacts: | |
| |
|
| Alan Greer | |
Tamera Gjesdal | |
Cynthia A. Williams |
| Executive Vice President | |
Senior Vice President | |
Senior Executive Vice President |
| Investor Relations | |
Investor Relations | |
Corporate Communications |
| (336) 733-3021 | |
(336) 733-3058 | |
(336) 733-1470 |
| AGreer@BBandT.com | |
TGjesdal@BBandT.com | |
Cynthia.Williams@BBandT.com |
BB&T Corporation CFO to speak at BancAnalysts
Association of Boston Conference
WINSTON-SALEM, N.C. – BB&T
Corporation (NYSE: BBT) today announced Chief Financial Officer Daryl N. Bible
will present at the BancAnalysts Association of Boston Conference, Thursday, Nov. 5, at 7:25 a.m., ET.
A webcast of Bible’s presentation will
be available at BBT.com and will be archived for 30 days.
About BB&T
BB&T is one of the largest financial services holding companies in the U.S. with approximately $208.8 billion in assets and
market capitalization of approximately $27.8 billion, as of Sept. 30, 2015. Based in Winston-Salem, N.C., the company operates
2,150 financial centers in 15 states and Washington, D.C., and offers a full range of consumer and commercial banking, securities
brokerage, asset management, mortgage and insurance products and services. A Fortune 500 company, BB&T is consistently recognized
for outstanding client satisfaction by the U.S. Small Business Administration, Greenwich Associates and others. BB&T has also
been named one of the World’s Strongest Banks by Bloomberg Markets Magazine, one of the top three in the U.S. and in the
top 15 globally. More information about BB&T and its full line of products and services is available at BBT.com.
.
###
Exhibit 99.2


Forward - Looking Information This presentation contains “forward - looking statements” within the meaning of the Private Securities Litigation Reform Act of 19 95, regarding the financial condition, results of operations, business plans and the future performance of BB&T that are based on the beliefs and assumptions of the management of BB&T and the information available to management at the time th at these disclosures were prepared. Words such as “anticipates,” “believes,” “estimates,” “expects,” “forecasts,” “intends,” “plans,” “projects,” “may,” “will,” “should,” “could,” and other similar expressions are intended to identify thes e f orward - looking statements. Such statements are subject to factors that could cause actual results to differ materially from anticipated results. Such factors include, but are not limited to, the following: general economic or business conditions, either nationally or regionally, may be less favorable than expected, resulting in, amo ng other things, a deterioration in credit quality and/or a reduced demand for credit, insurance or other services; disruptions to the credit and financial markets, either nationally or globally, including the impact of a downgrade of U.S. g ove rnment obligations by one of the credit ratings agencies and the adverse effects of recessionary conditions in Europe; changes in the interest rate environment and cash flow reassessments may reduce NIM and/or the volumes and values of loans ma de or held as well as the value of other financial assets held; competitive pressures among depository and other financial institutions may increase significantly; legislative, regulatory or accounting changes, including changes resulting from the adoption and implementation of the Dodd - Fran k Act may adversely affect the businesses in which BB&T is engaged; local, state or federal taxing authorities may take tax positions that are adverse to BB&T; a reduction may occur in BB&T’s credit ratings; adverse changes may occur in the securities markets; competitors of BB&T may have greater financial resources and develop products that enable them to compete more successfully t han BB&T and may be subject to different regulatory standards than BB&T; natural or other disasters could have an adverse effect on BB&T in that such events could materially disrupt BB&T’s operation s o r the ability or willingness of BB&T’s customers to access the financial services BB&T offers; costs or difficulties related to the integration of the businesses of BB&T and its merger partners may be greater than expect ed; expected cost savings or revenue growth associated with completed mergers and acquisitions may not be fully realized or reali zed within the expected time frames; significant litigation could have a material adverse effect on BB&T; deposit attrition, customer loss and/or revenue loss following completed mergers and acquisitions may be greater than expecte d ; cyber - security risks, including “denial of service,” “hacking” and “identity theft,” could adversely affect our business and fin ancial performance, or our reputation; and, failure to implement part or all of the Company’s new ERP system could result in impairment charges that adversely impact BB& T’s financial condition and results of operations and could result in significant additional costs to BB&T f ailure to execute on the Company’s strategic or operational plans, including the ability to successfully complete and/or inte gra te mergers and acquisitions, could adversely impact BB&T’s financial condition and results of operations. Readers are cautioned not to place undue reliance on these forward - looking statements, which speak only as of the date of this r eport. Actual results may differ materially from those expressed in or implied by any forward - looking statement. Except to the extent required by applicable law or regulation, BB&T undertakes no obligation to revise or update publicly any forwar d - l ooking statements for any reason. Non - GAAP Information This presentation contains financial information and performance measures determined by methods other than in accordance with ac counting principles generally accepted in the United States of America (“GAAP”). BB&T’s management uses these “non - GAAP” measures in their analysis of the Corporation’s performance and the efficiency of its operations. Management believes that these non - GAAP measures provide a greater understanding of ongoing operations and enhance comparability of results with prior periods as well as demonstrating the effects of significant gains and charges in the current period. The c omp any believes that a meaningful analysis of its financial performance requires an understanding of the factors underlying that performance. BB&T’s management believes that investors may use these non - GAAP financial measures to analyze financial performanc e without the impact of unusual items that may obscure trends in the company’s underlying performance. These disclosures should not be viewed as a substitute for financial measures determined in accordance with GAAP, nor are they nece ssa rily comparable to non - GAAP performance measures that may be presented by other companies. Below is a listing of the types of non - GAAP measures used in this presentation: Tangible common equity and related ratios are non - GAAP measures. The return on average risk - weighted assets is a non - GAAP measure . BB&T's management uses these measures to assess the quality of capital and believes that investors may find them useful in their analysis of the Corporation . Certain credit metrics have been adjusted to remove the impact of loans that are or were covered by FDIC loss sharing agreeme nts and has been adjusted to exclude the impact of the Susquehanna acquisition. Management believes this presentation improves comparability to prior periods and portfolios presented and provides BB&T’s core asset qu ali ty performance to clearly demonstrate the impact of the acquisition. Fee income and efficiency ratios are non - GAAP in that they exclude securities gains (losses), foreclosed property expense, amortizat ion of intangible assets, merger - related and restructuring charges, the impact of FDIC loss share accounting and other selected items. BB&T’s management uses these measures in their analysis of the Corporation’s perfo rma nce. BB&T’s management believes these measures provide a greater understanding of ongoing operations and enhance comparability of results with prior periods, as well as demonstrating the effects of significa nt gains and charges. Return on average tangible common shareholders’ equity is a non - GAAP measure that calculates the return on average common shareholders’ equity without the impact of intangible assets and their related amortization . This measure is useful for evaluating the performance of a business consistently, whether acquired or developed internally. Core net interest margin is a non - GAAP measure that adjusts net interest margin to exclude the impact of interest income and fun ding costs associated with loans and securities acquired in the Colonial acquisition and purchased credit impaired (“PCI”) loans acquired from Susquehanna. Core net interest margin is also adjusted to remove the purchase acc oun ting marks and related amortization for non - PCI loans and deposits acquired from Susquehanna. BB&T’s management believes that the adjustments to the calculation of net interest margin for certain assets and deposits acq uir ed provide investors with useful information related to the performance of BB&T’s earning assets. The adjusted ratio of net charge - offs to average loans is a non - GAAP measure that adjusts net charge - offs to exclude the impact of net charge - offs associated with certain loan sales during the quarter ended September 30, 2014. BB&T’s management believes this adjustment increases comparability of period - to - period results and believes that investors may f ind it useful in their analysis of the Corporation. Ratio of the allowance for loan and lease losses as a percentage of loans held for investment excluding Susquehanna is a non - GAA P measure that removes the Susquehanna loans from the calculation of the ratio. BB&T’s management believes that adjustments to the calculation provide investors with useful information because these loans were re cor ded at fair value and no allowance was recognized. A reconciliation of these non - GAAP measures to the most directly comparable GAAP measure is included in BB&T’s Third Quarter 2015 Quarterly Performance Summary, which is available on BB&T’s website at www.bbt.com.

3 3 BB&T is… ▪ A values - driven highly profitable growth organization. While we have had a very successful merger history, our primary focus is on organic growth; nonetheless, we are well positioned for strategic opportunities. ▪ Our fundamental strategy is to deliver the best value proposition in our markets. Recognizing value is a function of quality to price, our focus is on delivering high quality client service resulting in the Perfect Client Experience. ▪ Our over - arching purpose is to achieve our vision and mission, consistent with our values, with the ultimate goal of maximizing shareholder returns.

4 4 1 Excludes home office deposits 2 Number of branches per state as of August 18, 2015 3 Deposit Market Share data as of September 14, 2015 State # of Branches 2 Deposits 3,4 State Rank 4 North Carolina 1 356 $ 25.7 bn Virginia 359 $ 21.5 bn Florida 326 $ 15.8 bn Pennsylvania 4,5 294 $ 15.7 bn Georgia 161 $ 11.4 bn Maryland 4 169 $ 9.6 bn South Carolina 112 $ 7.3 bn Texas 121 $ 6.2 bn Kentucky 4 113 $ 5.7 bn West Virginia 4 79 $ 5.1 bn Alabama 88 $ 3.4 bn Tennessee 50 $ 2.5 bn District of Columbia 13 $ 2.0 bn New Jersey 4 35 $ 1.6 bn Indiana 2 NM Ohio 4 1 NM Total # of Branches 2,279 BB&T Corporation: A Growing Franchise 9 th Largest U.S. Financial Institution 3,4 BB&T 7 7 NM 4 2 6 4 13 2 3 5 1 5 NM 5 17 National Penn 4 Includes Citi, Bank of Kentucky, Susquehanna, and pending National Penn branches . 5 Pennsylvania state rank includes all institutions Source: FactSet , FDIC, SNL DataSource

5 5 Seasonally Stronger Loan Growth 1 ▪ Average loan growth, excluding Susquehanna and The Bank of Kentucky, was 3.2% annualized and 6.7% excluding residential mortgage, vs. 2Q15 ▪ Experienced strong loan growth vs. 2Q15 in several categories (excludes acquisitions): Grandbridge, up 83.4% annualized Sheffield, up 28.5% annualized AFCO / CAFO, up 14.1% annualized Direct Retail , up 11.9% annualized Regional Acceptance, up 6.5% annualized ▪ $1.1 billion oil and gas portfolio 90% upstream 10% midstream 1 Excludes loans held for sale 2 Other lending subsidiaries consist of AFCO/CAFO/Prime Rate, BB&T Equipment Finance, Grandbridge Real Estate Capital, Sheffield Fina nci al and Regional Acceptance 3 Susquehanna and The Bank of Kentucky contributed $8.5 billion and $1.2 billion, respectively, in average loan growth 4 Excludes the impact of acquisitions. See non - GAAP reconciliations included in the Appendix. $118.6 $118.3 $118.8 $120.0 $ 130.5 3 $100.0 $108.0 $116.0 $124.0 $132.0 3Q14 4Q14 1Q15 2Q15 3Q15 Average Loans Held for Investment ($ in billions) C&I $ 46,462 36.6% 6.7% CRE – IPP 12,514 66.0 4.7 CRE – C&D 3,502 105.4 18.4 Dealer floor plan 1,056 18.1 14.1 Direct retail lending 9,926 69.4 11.9 Sales finance 10,386 36.7 (11.6) Revolving credit 2,421 9.4 8.4 Residential mortgage 30,384 6.9 (7.3) Other lending subsidiaries 2 12,837 38.5 20.6 Subtotal $ 129,488 35.2% 3.6% Acquired from FDIC and PCI 1,052 (1.1) (43.6) Total $ 130,540 34.9% 3.2% 3Q15 Average Balance 3 Q15 v. 2Q15 Annualized Increase (Decrease) 3Q15 v. 2Q15 Adjusted 4 Annualized Increase (Decrease) Average Loans Held for Investment ($ in millions) ▪ Management expects loan growth, excluding Susquehanna, to be relatively flat on a linked quarter basis in 4Q15 (up slightly excluding residential mortgage), largely due to seasonality

6 6 Credit Portfolio Strategies ▪ Portfolio strategy and limits process in place for several years designed to: Maximize through the cycle earnings - per - share and returns L imit earnings variability P rovide earnings resiliency E nsure revenue and earnings diversification ▪ Fastest loan growth occurring in risk/return advantaged segments, e.g. Sheffield, Grandbridge, credit card ▪ Published FRB stress test model results for CCAR banks show legacy BB&T stress loss rates among lowest in the peer group ▪ Maintaining conservative hold limits on large loans relative to capital and peers to maintain more granular portfolios ▪ Very limited appetite for leverage loans ▪ Retail prime and nonprime auto avoiding extended terms and excessive LTVs Nonprime platform is recession tested and has not changed business model ▪ Positioned more cautiously on multi - family CRE in certain geographies ▪ Low spread residential mortgage being sold
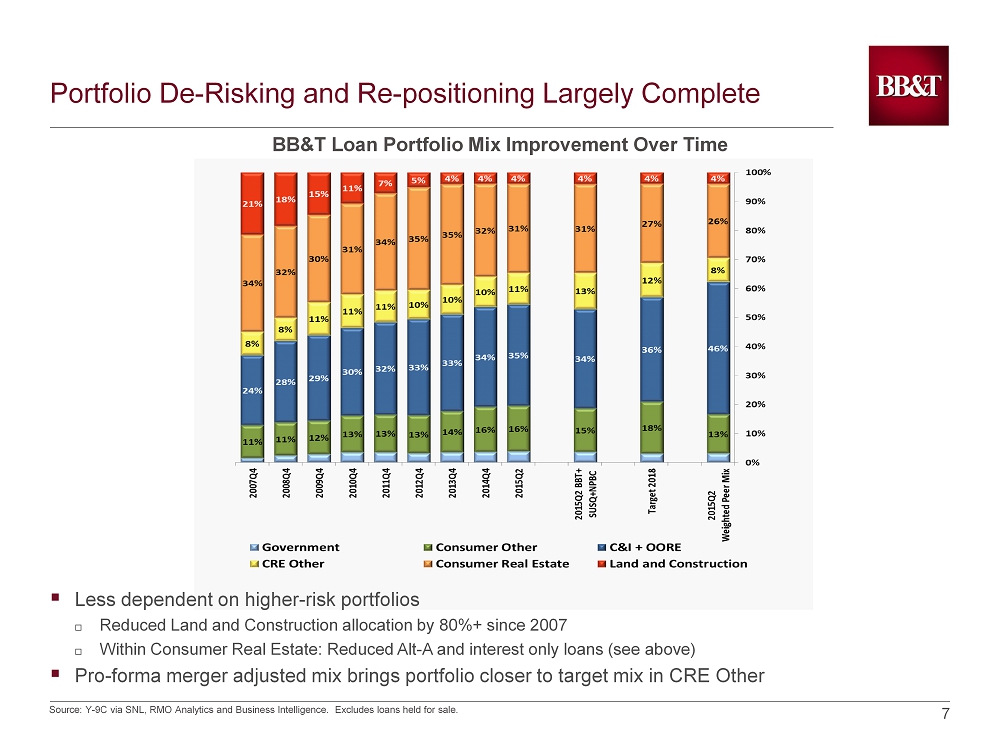
7 7 Portfolio De - Risking and Re - positioning Largely Complete Source: Y - 9C via SNL, RMO Analytics and Business Intelligence. Excludes loans held for sale. BB&T Loan Portfolio Mix Improvement Over Time ▪ Less dependent on higher - risk portfolios Reduced Land and Construction allocation by 80%+ since 2007 Within Consumer Real Estate: Reduced Alt - A and interest only loans (see above) ▪ Pro - forma merger adjusted mix brings portfolio closer to target mix in CRE Other

8 8 Accelerating Growth in Risk / Return Advantaged Lending Platforms While Improving Diversification 1 Excludes sold portion of Lendmark and reflects QM transfer of loans from DRL to MLA 2 Excludes the impact of Susquehanna. See non - GAAP reconciliations included in the appendix All figures exclude FDIC acquired, loans acquired via Susquehanna, and loans held for sale Portfolio Q3 ’15 EOP Balance 2 Q4 ’12 EOP Balance 1 CAGR Commercial Other $6.8 $5.0 12% Consumer Other $18.2 $14.4 9% Direct Retail Lending $8.9 $7.8 5% Commercial & Industrial $44.2 $38.3 5% CRE – IPP $11.2 $9.8 5% CRE – Const. and Dev. $3.0 $3.0 0% Residential Mortgage $29.6 $32.3 - 3% ▪ Commercial Other : Bankcard – Commercial, Dealer Finance - Wholesale, Equipment Finance, Grandbridge , and Premium Finance ▪ Consumer Other: Bankcard - Retail, Dealer Finance - Retail, Home Improvement Dealer Services, Regional Acceptance, and Sheffield More Risk / Return Advantaged Less Risk / Return Advantaged

9 9 Improved Deposit Mix and Cost $130.6 $130.3 $129.5 $131.9 $ 143.8 1 0.26% 0.25% 0.25% 0.24% 0.24% 0.20% 0.25% 0.30% 0.35% 0.40% $100.0 $110.0 $120.0 $130.0 $140.0 $150.0 3Q14 4Q14 1Q15 2Q15 3Q15 Total Interest-Bearing Deposit Cost ▪ Average deposits grew $1.2 billion, or 3.6% annualized, excluding the acquisitions of Susquehanna and The Bank of Kentucky ▪ Excluding acquisitions, average noninterest - bearing deposits increased $721 million; or 6.9% annualized ▪ Excluding acquisitions, average noninterest - bearing deposit mix was 31.7% in 3Q15 vs. 31.5% in 2Q15 Average Total Deposits ($ in billions) $38.1 $39.1 $39.7 $41.5 $ 44.2 3 $30.0 $34.0 $38.0 $42.0 $46.0 3Q14 4Q14 1Q15 2Q15 3Q15 Average Noninterest - Bearing Deposits ($ in billions) Noninterest - bearing deposits $ 44,153 25.3% 6.9% Interest checking 22,593 31.1 (17.5) Money market & savings 59,306 40.2 15.5 Subtotal $ 126,052 33.3% 6.5% Time deposits 16,837 54.6 (23.6) Foreign office deposits – Interest - bearing 948 95.5 95.5 Total deposits $ 143,837 36.0% 3.6% 3Q15 Average Balance 3 Q15 v. 2Q15 Annualized Increase (Decrease) 3 Q15 v. 2Q15 Adjusted 2 Annualized % Increase (Decrease) Average Deposits ($ in millions) 1 Susquehanna and The Bank of Kentucky contributed $9.4 billion and $ 1.6 billion, respectively, in average deposit growth 2 Excludes the impact of acquisitions. See non - GAAP reconciliations included in the Appendix. 3 Susquehanna and The Bank of Kentucky contributed $1.5 billion and $0.5 billion, respectively, in average noninterest - bearing deposit growth

10 10 Credit Quality Remains Excellent 1 ▪ Loans 90 days or more past due and still accruing increased 42.9% vs. 2Q15 Excluding Susquehanna, loans 90 days or more past due decreased 10.5% 3 ▪ Loans 30 - 89 days increased 8.6% vs. 2Q15 Excluding Susquehanna, loans 30 - 89 days past due increased 5.0% 3 due to normal nonprime auto seasonality ▪ Including acquisitions, management expects 4Q15 net charge - offs to be in the range of 35 - 45 bps, reflecting normal retail seasonality ▪ NPAs increased 2.1% vs. 2Q15; excluding Susquehanna, NPAs increased 0.7% 3 ▪ Management expects NPA levels to remain in a similar range to 3Q15 0.50% 0.42% 0.40% 0.38% 0.36% 0.00% 0.20% 0.40% 0.60% 3Q14 4Q14 1Q15 2Q15 3Q15 Total Nonperforming Assets as a Percentage of Total Assets Annualized Net Charge - offs / Average Loans 1 Includes acquired from FDIC and PCI; excludes loans held for sale 2 Excludes $15 million of net charge - offs related to sale of loans consisting primarily of TDRs 3 Excludes the impact of Susquehanna. See non - GAAP reconciliations included in the attached Appendix 0.39% 0.34% 0.48% 0.43% 2 0.32% 0.33% 0.00% 0.20% 0.40% 0.60% 3Q14 4Q14 1Q15 2Q15 3Q15 Core Charge-offs Other Charge-offs

11 11 Allowance Coverage Ratios Remain Strong 2.67x 3.21x 3.60x 3.71x 3.44x 1.92x 2.39x 2.45x 2.55x 2.49x 0.00 1.00 2.00 3.00 4.00 5.00 3Q14 4Q14 1Q15 2Q15 3Q15 ALLL to Net Charge-offs ALLL to NPLs HFI ▪ Coverage ratios remain strong at 3.44x and 2.49x for the allowance to net charge - offs and NPLs, respectively ▪ The ALLL to loans ratio was 1.08%. This includes $12.8 billion of acquired loans marked to fair value with no related allowance Excluding Susquehanna, ALLL to loans was 1.19% 1 , unchanged from last quarter The loans acquired from Susquehanna reflected a 4.45% credit mark ALLL Coverage Ratios 1 Excludes the impact of Susquehanna. See non - GAAP reconciliations included in the attached Appendix

12 12 Net Interest Margin Increases Due to Purchase Accounting 3.38% 3.36% 3.33% 3.27% 3.35% 3.20% 3.20% 3.18% 3.16% 3.15% 3.07% 3.02% 2.99% 2.98% 2.95% 2.75% 3.25% 3.75% 3Q14 4Q14 1Q15 2Q15 3Q15 Reported NIM Core NIM Peers ▪ 3 Q15 NIM increased 8 bps vs. 2Q15 as a result of: Purchase accounting impact (+9 bps) Lower yields on new loans and other earning assets, partially offset by lower liability costs ( - 1 bp ) ▪ 3Q15 core NIM was 3.15%, down 1 bp vs. 2Q15 ▪ Management expects GAAP and core net interest margin to remain relatively stable in 4Q15, assuming no changes in interest rates Net Interest Margin 1 1 See non - GAAP reconciliations included in the attached Appendix 2 Peers include CMA, FITB, HBAN, KEY, MTB, PNC, RF, STI, USB, and ZION 2

13 13 Improving Rate Sensitivity 0.97% 1.89% 2.71% 0.00% 0.50% 1.00% 1.50% 2.00% 2.50% 3.00% 4Q13 1Q14 2Q14 3Q14 4Q14 1Q15 2Q15 3Q15 Up 50 bps Up 100 bps Up 200 bps Sensitivity of Net Interest Income ▪ Sensitivities based on parallel shift and conservative beta assumptions (60% average beta)
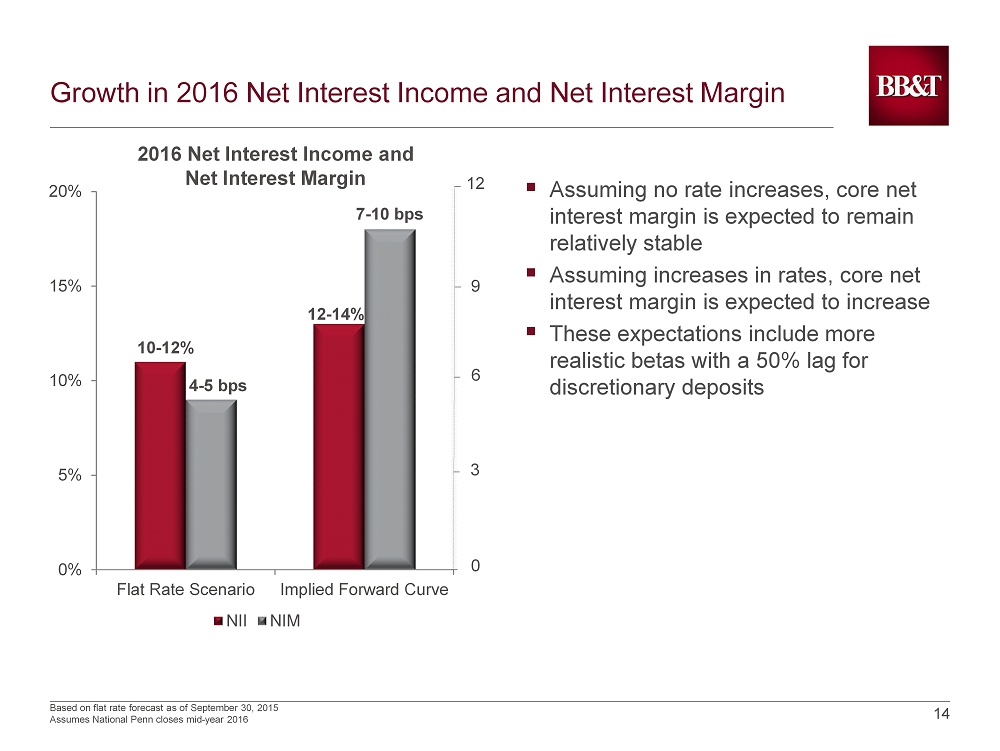
14 14 Growth in 2016 Net Interest Income and Net Interest Margin ▪ Assuming no rate increases, core net interest margin is expected to remain relatively stable ▪ Assuming increases in rates, core net interest margin is expected to increase ▪ These expectations include more realistic betas with a 50% lag for discretionary deposits Based on flat rate forecast as of September 30, 2015 Assumes National Penn closes mid - year 2016 10 - 12% 12 - 14% 4 - 5 bps 7 - 10 bps 0% 5% 10% 15% 20% Flat Rate Scenario Implied Forward Curve NII NIM _ _ _ _ _ 12 9 6 3 0 2016 Net Interest Income and Net Interest Margin

15 15 Betas Are Conservative 50% 50% 55% ~55% - 65% 60% 70% 0% 20% 40% 60% 80% Peer 1 Peer 2 Peer 3 Peer 4 BBT Peer 5 Company Deposit Beta (Rate Pass - Through) Assumptions More aggressive More conservative Source: Goldman Sachs Equity Research Peers include FITB , HBAN, KEY, MTB, and RF ▪ Must also consider stability of deposits and pre - payment assumptions

16 16 Fixed vs. Variable Loan Trends 35.0% 40.0% 45.0% 50.0% 55.0% 60.0% Q1 2010 Q2 2010 Q3 2010 Q4 2010 Q1 2011 Q2 2011 Q3 2011 Q4 2011 Q1 2012 Q3 2012 Q4 2012 Q1 2013 Q2 2013 Q3 2013 Q4 2013 Q1 2014 Q2 2014 Q3 2014 Q4 2014 Q1 2015 Q2 2015 Q3 2015 Fixed Variable

17 17 Leading Improvement in Deposit Mix Since 3Q12 39.7% 16.8% 15.3% 14.3% 14.3% 13.4% 9.3% 6.6% 4.7% 1.7% - 2.9% -5.0% 10.0% 25.0% 40.0% BBT Peer 1 Peer 2 Peer 3 Peer 4 Peer 5 Peer 6 Peer 7 Peer 8 Peer 9 Peer 10 Non - Interest Bearing Mix Improvement 3Q12 YTD vs 3Q15 YTD Peers include CMA, FITB, HBAN, KEY, MTB, PNC, RF, STI, USB, and ZION

18 18 Fee Income Outlook ▪ Insurance income will be seasonally stronger in 4Q15 2016 affected by: - New business growth - Industry leading retention levels - Softer insurance market - Sale of American Coastal in 2Q15 ▪ Residential mortgage banking income is expected to be seasonally softer in 4Q15 ▪ Service charges on deposits should be seasonally stronger due to increased activity in 4Q15 ▪ Investment banking and brokerage trends will depend on the timing of deal flow 44.3% 46.2% 45.8% 46.3% 42.1% 37.3% 37.9% 38.0% 39.4% 38.5% 35.0% 40.0% 45.0% 50.0% 3Q14 4Q14 1Q15 2Q15 3Q15 Fee Income Ratio 1,2 BBT Peers 1 Excludes securities gains (losses), the impact of FDIC loss share accounting and other selected items. See non - GAAP reconciliations incl uded in the attached Appendix 2 Effective 1/1/15, BB&T retrospectively adopted new accounting guidance for Qualified Affordable Housing investments. Prior period infor mat ion has been revised to conform to the current presentation 3 Peers include CMA, FITB, HBAN, KEY, MTB, PNC, RF, STI, USB, and ZION 3

19 19 Noninterest Expense Reflects Acquisitions 1 Excludes certain items as detailed in non - GAAP reconciliation section 2 Effective 1/1/15, BB&T retrospectively adopted new accounting guidance for Qualified Affordable Housing investments. Prior period infor mat ion has been revised to conform to the current presentation 3 Peers include CMA, FITB, HBAN, KEY, MTB, PNC, RF, STI, USB, and ZION 58.7% 55.6% 58.5% 59.2% 59.2% 62.8% 63.3% 64.4% 62.6% 62.7% 50.0% 55.0% 60.0% 65.0% 70.0% 3Q14 4Q14 1Q15 2Q15 3Q15 Efficiency Ratio 1,2 BBT Peers ▪ Excluding the loss on early extinguishment of debt, merger - related charges and the impact of Susquehanna, noninterest expenses decreased modestly ▪ FTEs increased 2,404 vs. 2Q15; excluding Susquehanna and The Bank of Kentucky, FTEs were up slightly in 3Q15 ▪ FTEs are expected to trend lower in 4Q15 and early in 2016 ▪ Merger - related and restructuring charges are expected to total $60 million - $80 million for 4Q15 3

20 20 Committed to Achieving Cost Savings Goals 2015 2016 core expense growth SUSQ savings NPBC savings 4Q16 assuming flat rate scenario 56% - 57% ex. rates $160 million 58% - 60% Efficiency $65 million * Efficiency reflects “cash” efficiency consistent with SNL’s definition. flat - to - up 2% 56% - 57% Efficiency

21 21 Capital and Liquidity Strength 10.5% 10.6% 10.5% 10.4% 10.1% 9.0% 10.0% 11.0% 3Q14 4Q14 1Q15 2Q15 3Q15 ▪ Committed to a peer - group leading dividend ▪ The Susquehanna transaction used approximately 0.6% in Common Equity Tier 1 capital ▪ The fully phased - in Common Equity Tier 1 ratio was 9.8% ▪ BB&T’s 3Q15 LCR was 136% driven by strong deposit growth and the acquisitions ▪ BB&T’s 3Q15 liquid asset buffer was 13.3 % 1 C urrent quarter regulatory capital information is preliminary. Risk - weighted assets are determined based on regulatory capital requirements in effect for the period presented. The ratio for periods prior to 2015 is the Tier 1 common equity ratio, which was based on the definition used for the SCAP assessment. This ratio was a non - GA AP measure. BB&T's management used this measure to assess the quality of capital and believes that investors found the measure useful in their analysis of the Corporation. This capital measure was not necessarily comparable to similar capital measures that may be presented by other companies. Management believes this measure was fairly comparable to Common Equity Tier 1 capital, which is required under Basel III . 2 Under Transitional Approach Common Equity Tier 1 1 Basel I Basel III 2

22 22 Introducing: U by BB&T ▪ Personalize the platform user interface ▪ Schedule appointments online ▪ Turn off/on check card ▪ Capture paper and electronic receipts and store them for up to 2 years ▪ Person - to - Person payments ▪ Aggregate account balances and transaction details from other banks ▪ Easily set up budgets and monitor spending ▪ View account balances without logging in ▪ View call center wait times ▪ Request callback instead of dialing and waiting on hold ▪ Skip the IVR when calling our primary call center Best in Class Features

23 23 Impressive Growth in Mobile and Digital Products ▪ Total U enrollments Over 100,000 new U enrollments since August 16 th Adding 10,000+ enrollments per week Localized advertising began in September - Triad and Greater Washington enrollments are up 4.5% YoY (largely due to lobby campaign and media advertising) ▪ Mobile transactions (check deposit, bill pay, and transfers) 26.7% YoY increase in monthly mobile transactions 51.3% YoY increase in clients using mobile check deposit - 43.2% YoY increase in number of checks deposited 72.4% YoY increase in $ volume of checks deposited

24 24 Acquisitions Fully On Track ▪ Strategically compelling ▪ Financially attractive ▪ Significant expansion of attractive Mid - Atlantic footprint ▪ BB&T well prepared to successfully execute on acquisitions ▪ Compatible cultures with BB&T ▪ Susquehanna conversion scheduled for upcoming weekend

25 25 York Williamsport Washington D.C. Hagerstown Baltimore Philadelphia Reading Harrisburg Camden Lancaster Ocean City Allentown Top 15 Banks in Pennsylvania Deposit Deposits Market Rank Institution Branches ($MM) Share 1. PNC 446 $35,394 14.4% 2. Wells Fargo 280 24,339 9.9 3. Citizens Financial 359 21,673 8.8 BB&T Pro Forma 294 15,715 6.4 4. Toronto-Dominion 97 12,042 4.9 5. M&T Bank 258 11,518 4.7 6. F.N.B. Corporation 196 10,689 4.3 7. BB&T 178 9,106 3.7 8. Fulton Financial 127 7,747 3.1 9. National Penn 116 6,609 2.7 10. Banco Santander 157 6,198 2.5 11. First Niagara 124 5,743 2.3 12. Northwest Bancshares 136 5,003 2.0 13. S&T Bancorp 63 4,617 1.9 14. First Commonwealth 107 4,476 1.8 15. Dollar Bank 37 3,656 1.5 Deposits ($MM) Market Rank Market Share National Penn's Top 10 Counties National Penn BB&T Combined National Penn BB&T Combined National Penn BB&T Combined Berks, PA $1,337 $380 $1,717 2 8 1 18.7% 5.3% 24.0% Northampton, PA 1,042 85 1,126 2 13 2 18.4 1.5 19.9 Chester, PA 831 780 1,612 5 6 2 7.3 6.9 14.2 Lehigh, PA 701 161 862 2 13 2 10.9 2.5 13.4 Bucks, PA 618 173 792 8 19 6 3.9 1.1 5.0 Montgomery, PA 519 994 1,513 12 8 5 2.1 4.0 6.1 Philadelphia, PA 348 122 470 15 22 13 1.7 0.6 2.3 Luzerne, PA 329 152 481 6 11 4 5.6 2.6 8.3 Lancaster, PA 312 2,669 2,981 7 1 1 3.0 25.8 28.8 Centre, PA 310 85 396 3 9 3 11.9 3.3 15.1 Top 10 Counties Total $6,348 $5,600 $11,949 Other Counties 511 150,351 150,862 Total $6,860 $155,952 $162,811 Note: Branches, deposits and deposit market share exclude branches with deposit balances greater than $1 billion. Source: SNL Financial. BB&T branch data as of June 30, 2014; National Penn branch data as of June 30, 2015. Deposit data as of June 30, 2014. Bran ch and deposit data pro forma for announced M&A through August 17, 2015. BB&T pro forma for the acquisition of Susquehanna. BB&T National Penn Significant Penetration in Attractive Mid - Atlantic Region

26 2016 Outlook ▪ Loans ▪ Deposits ▪ Net interest income and net interest margin ▪ Credit ▪ Fees ▪ Expenses

27 27 Value System Revenues Superior Shareholder Long - term Returns Value System Attract / Train and Retain the Right People Perfect Client Experience Culture Matters – Values Are Consistent and Important

Appendix

Non - GAAP Reconciliations 1 29 1 BB&T’s management uses these measures in their analysis of the Corporation’s performance and believes these measures provide a greater understanding of ongoing operations and enhance comparability of results with prior periods, as well as demonstrating the effects of significant gains and charges. (Dollars in millions) Loans September 30, 2015 Link Qtr Reported SUSQ BKYF Adjusted Adj Growth Ann. Commercial and industrial $ 46,462 $ (2,672) $ ( 607) $ 43,183 $ 715 6.7 % CRE - income producing properties 12,514 (1,360) (338) 10,816 127 4.7 CRE - construction and development 3,502 (553) (62) 2,887 128 18.4 Dealer floor plan 1,056 (10) - 1,046 36 14.1 Direct retail lending 9,926 (1,132) (105) 8,689 253 11.9 Sales finance 10,386 (1,157) - 9,229 (278) (11.6) Revolving credit 2,421 - (7) 2,414 50 8.4 Residential mortgage 30,384 (1,004) (75) 29,305 (548) (7.3) Other lending subsidiaries 12,837 (527) - 12,310 609 20.6 Subtotal 129,488 (8,415) (1,194) 119,879 1,092 3.6 PCI/FDIC 1,052 (113) - 939 (116) (43.6) Total average loans and leases HFI $ 130,540 $ ( 8,528) $ ( 1,194) $ 120,818 $ 976 3.2 % June 30, 2015 Reported SUSQ BKYF Adjusted Commercial and industrial $ 42,541 $ - $ (73) $ 42,468 CRE - income producing properties 10,730 - (41) 10,689 CRE - construction and development 2,767 - (8) 2,759 Dealer floor plan 1,010 - - 1,010 Direct retail lending 8,449 - (13) 8,436 Sales finance 9,507 - - 9,507 Revolving credit 2,365 - (1) 2,364 Residential mortgage 29,862 - (9) 29,853 Other lending subsidiaries 11,701 - - 11,701 Subtotal 118,932 - (145) 118,787 Purchased credit - impaired loans (PCI) 1,055 - - 1,055 Total average loans and leases HFI $ 119,987 $ - $ (145) $ 119,842 Link Quarter Average Balance Growth Adjusted for Acquisitions

Non - GAAP Reconciliations 1 30 1 BB&T’s management uses these measures in their analysis of the Corporation’s performance and believes these measures provide a greater understanding of ongoing operations and enhance comparability of results with prior periods, as well as demonstrating the effects of significant gains and charges. (Dollars in millions) Loans September 30, 2015 Reported SUSQ Adjusted CAGR Commercial – other $ 7,584 $ (817) $ 6,766 16.5 % Consumer – other 19,943 ( 1,738) 18,205 12.5 Direct retail lending 10,626 (1,715) 8,910 11.8 Commercial & industrial 48,095 (3,891) 44,204 8.6 CRE – income producing properties 13,312 (2,084) 11,228 11.7 CRE – construction & development 3,806 (846) 2,960 9.0 Residential mortgage 31,070 (1,479) 29,591 (1.4) End of Period Balances Adjusted for Acquisition

Non - GAAP Reconciliations 1 31 1 BB&T’s management uses these measures in their analysis of the Corporation’s performance and believes these measures provide a greater understanding of ongoing operations and enhance comparability of results with prior periods, as well as demonstrating the effects of significant gains and charges. (Dollars in millions) June 30, 2015 Reported SUSQ BKYF Adjusted Noninterest - bearing deposits $ 41,502 $ - $ (58) $ 41,444 Interest checking 20,950 - (57) 20,893 Money market and savings 53,852 - (39) 53,813 Subtotal $ 116,304 - (154) 116,150 Time deposits 14,800 - (34) 14,766 Foreign office deposits - interest - bearing 764 - - 764 Total deposits $ 131,868 $ - $ (188) $ 131,680 Deposits September 30, 2015 Link Qtr Reported SUSQ BKYF Adjusted Adj Growth Ann. Noninterest - bearing deposits $ 44,153 $ (1,506) $ (482) $ 42,165 721 6.9 % Interest checking 22,593 (2,152) (472) 19,969 (924) (17.5) Money market and savings 59,306 (3,073) (324) 55,909 2,096 15.5 Subtotal 126,052 (6,731) (1,278) 118,043 1,893 6.5 Time deposits 16,837 (2,670) (279) 13,888 (878) (23.6) Foreign office deposits - interest - bearing 948 - - 948 184 95.5 Total deposits $ 143,837 $ (9,401) $ (1,557) $ 132,879 1,199 3.6 % Link Quarter Average Balance Growth Adjusted for Acquisitions

Non - GAAP Reconciliations 1 32 1 BB&T’s management uses these measures in their analysis of the Corporation’s performance and believes these measures provide a g reater understanding of ongoing operations and enhance comparability of results with prior periods, as well as demonstrating the effects of significant gains and charges. 2 Adjustment represents $15 million of net charge - offs recorded in connection with the mortgage loan sale in the quarter ended Sep tember 30, 2014. (Dollars in millions) For the Quarter Ended Adjusted net charge - offs as a percentage of average loans and leases Sept. 30, 2014 Net charge - offs $142 Less: adjustment 2 (15) Net charge - offs, as adjusted $127 Average loans held for investment $118,564 Net charge - offs as a percentage of average loans and leases 0.48% Net charge - offs as a percentage of average loans and leases, as adjusted 0.43% As of September 30, 2015 ALLL as a % of loans held for investment ALLL LHFI Ratio Reported $1,458 135,515 1.08% Less: the impact of Susquehanna - (12,766) - ALLL as a % of loans held for investment, adjusted $1,458 $122,749 1.19%
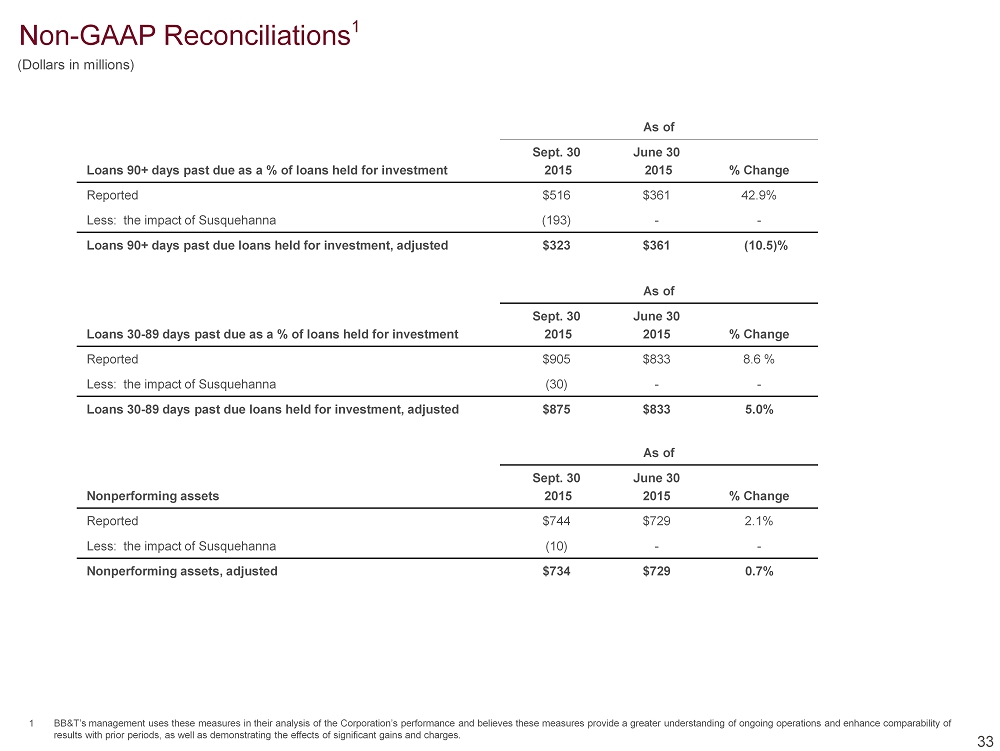
Non - GAAP Reconciliations 1 33 (Dollars in millions) As of Loans 30 - 89 days past due as a % of loans held for investment Sept. 30 2015 June 30 2015 % Change Reported $905 $833 8.6 % Less: the impact of Susquehanna (30) - - Loans 30 - 89 days past due loans held for investment, adjusted $875 $833 5.0% As of Loans 90+ days past due as a % of loans held for investment Sept. 30 2015 June 30 2015 % Change Reported $516 $361 42.9% Less: the impact of Susquehanna (193) - - Loans 90+ days past due loans held for investment, adjusted $323 $361 (10.5)% As of Nonperforming assets Sept. 30 2015 June 30 2015 % Change Reported $744 $729 2.1% Less: the impact of Susquehanna (10) - - Nonperforming assets, adjusted $734 $729 0.7% 1 BB&T’s management uses these measures in their analysis of the Corporation’s performance and believes these measures provide a g reater understanding of ongoing operations and enhance comparability of results with prior periods, as well as demonstrating the effects of significant gains and charges.

Non - GAAP Reconciliations 1 Quarter Ended Reported net interest margin vs. core net interest margin Sept. 30 2015 June 30 2015 March 31 2015 Dec. 31 2014 Sept. 30 2014 Reported net interest margin - GAAP 3.35% 3.27% 3.33% 3.36% 3.38% Adjustments to interest income for assets acquired: Effect of securities acquired from FDIC (0.04) (0.04) (0.06) (0.06) (0.06) Effect of loans acquired from FDIC and PCI (0.07) (0.08) (0.10) (0.11) (0.13) Effect of purchase accounting marks on non - PCI loans acquired from Susquehanna (0.08) - - - - Adjustments to interest expense: Effect of purchase accounting marks on time deposits assumed from Susquehanna (0.01) - - - - Effect of interest expense related to acquired assets - 0.01 0.01 0.01 0.01 Core net interest margin 3.15% 3.16% 3.18% 3.20% 3.20% 34 1 Core net interest margin is a non - GAAP measure that adjusts net interest margin to exclude the impact of interest income and funding costs associated with loans and securities acquired in the Colonial acquisition and purchased credit impaired (“PCI”) loans acquired from Susquehanna. Core net interest margin is also adjusted to remove th e p urchase accounting marks and related amortization for non - PCI loans and deposits acquired from Susquehanna. BB&T’s management believes that the adjustments to the calculation of net interest margin for cert ain assets and deposits acquired provide investors with useful information related to the performance of BB&T’s earning assets

Non - GAAP Reconciliations 1 35 1 BB&T’s management uses these measures in their analysis of the Corporation’s performance and believes these measures pro vide a greater understanding of ongoing operations and enhance comparability of results with prior periods, as well as demonstrating the effects of significant gains and charges. Quarter Ended Sept. 30 June 30 March 31 Dec. 31 Sept. 30 Efficiency and Fee Income Ratios 1 2015 2015 2015 2014 2014 Efficiency ratio - GAAP 64.1% 69.8% 60.7% 58.3% 66.0% Effect of securities gains (losses), net - - - - (0.1) Effect of merger - related and restructuring charges, net (3.1) (1.1) (0.5) ( 0.7) ( 0.3) Effect of loss on sale of American Coastal - (0.8) - - - Effect of mortgage reserve adjustments - - - ( 1.1) - Effect of loss on early extinguishment of debt - (7.1) - - ( 5.1) Effect of franchise tax adjustment - - - 0.6 - Effect of FDIC loss share accounting - (0.1) (0.1) ( 0.1) ( 0.3) Effect of foreclosed property expense (0.6) (0.6) (0.6) ( 0.4) ( 0.5) Effect of amortization of intangibles (1.2) (0.9) ( 1.0) ( 1.0) ( 1.0) Efficiency ratio - reported 59.2% 59.2% 58.5% 55.6% 58.7% Fee income ratio - GAAP 39.7% 43.0% 42.5% 42.7% 40.7% Effect of securities gains (losses), net - - - - 0.1 Effect of loss on sale of American Coastal - 0.6 - - - Effect of FDIC loss share accounting 2.4 2.7 3.3 3.5 3.5 Fee income ratio - reported 42.1% 46.3% 45.8% 46.2% 44.3% Note: Effective 1/1/15, BB&T retrospectively adopted new accounting guidance for Qualified Affordable Housing investments. Pr io r period information has been revised to conform to the current presentation
BB and T (NYSE:BBT)
Historical Stock Chart
From Mar 2024 to Apr 2024

BB and T (NYSE:BBT)
Historical Stock Chart
From Apr 2023 to Apr 2024
