AMCON Distributing Company (“AMCON”) (NYSE MKT:DIT), an Omaha,
Nebraska based consumer products company is pleased to announce
fully diluted earnings per share of $1.61 on net income available
to common shareholders of $1.1 million for the fiscal quarter ended
March 31, 2016.
“We continue to invest in our wholesale business to enhance our
leadership position in the Convenience Distribution Industry. We
are expanding our foodservice and technology capabilities as the
needs of our customers grow in complexity. This approach has served
to differentiate us from our competition,” said Christopher H.
Atayan, AMCON’s Chairman and Chief Executive Officer. He further
noted “We are actively seeking acquisitions that can benefit from
our extensive platform of customer service.”
Each of AMCON’s business segments reported solid quarters. The
wholesale distribution segment reported revenues of $288.9 million
and operating income before depreciation and amortization of $3.5
million for the second fiscal quarter of 2016. The retail health
food segment reported revenues of $7.5 million and operating income
before depreciation and amortization of $0.6 million for the same
period.
“Our annual spring trade show in Kansas City was well received
by our customers and vendors. This event provides momentum as we
enter our customers’ peak selling season,” said Kathleen M. Evans,
President of AMCON’s Wholesale Distribution segment.
“Our management team is focusing on a variety of initiatives
designed to enhance the operating economics of our retail stores.
We operate in a competitive environment that continues to be highly
challenging,” said Eric Hinkefent, President of AMCON’s Retail
Health Food Segment.
“We actively manage our working capital and liquidity which
provides us the ability to respond quickly to the dynamic
environments in which both of our business segments operate. This
conservative approach provides us significant flexibility to act in
the long term best interest of the many constituencies we serve,”
said Andrew C. Plummer, AMCON’s Chief Financial Officer. “We were
pleased to close the March 31, 2016 quarter with shareholders’
equity of $62.0 million and consolidated debt of $21.2
million.”
AMCON is a leading wholesale distributor of consumer products,
including beverages, candy, tobacco, groceries, foodservice, frozen
and chilled foods, and health and beauty care products with
locations in Illinois, Missouri, Nebraska, North Dakota, South
Dakota and Tennessee. AMCON also operates sixteen (16) health and
natural product retail stores in the Midwest and Florida. The
retail stores operate under the names Chamberlin's Market &
Cafe www.chamberlins.com and Akin’s Natural Foods Market
www.akins.com.
This news release contains forward-looking statements that are
subject to risks and uncertainties and which reflect management's
current beliefs and estimates of future economic circumstances,
industry conditions, Company performance and financial results. A
number of factors could affect the future results of the Company
and could cause those results to differ materially from those
expressed in the Company's forward-looking statements including,
without limitation, availability of sufficient cash resources to
conduct its business and meet its capital expenditures needs and
the other factors described under Item 1.A. of the Company’s Annual
Report on Form 10-K. Moreover, past financial performance should
not be considered a reliable indicator of future performance.
Accordingly, the Company claims the protection of the safe harbor
for forward-looking statements contained in the Private Securities
Litigation Reform Act of 1995 with respect to all such
forward-looking statements.
Visit AMCON Distributing Company's web site
at: www.amcon.com
AMCON Distributing Company and Subsidiaries
Condensed Consolidated Balance Sheets March 31, 2016 and
September 30, 2015 March
September 2016 2015 (Unaudited)
ASSETS Current assets: Cash $ 321,990 $ 219,536 Accounts
receivable, less allowance for doubtful accounts of $0.8 million at
March 2016 and $0.9 million at September 2015 29,255,947 31,866,787
Inventories, net 56,594,107 60,793,478 Deferred income taxes
1,278,006 1,553,726 Income taxes receivable — 113,238 Prepaid and
other current assets 4,080,280 2,125,908
Total current assets 91,530,330 96,672,673 Property
and equipment, net 12,465,906 12,753,145 Goodwill 6,349,827
6,349,827 Other intangible assets, net 3,908,478 4,090,978 Other
assets 296,717 317,184 $ 114,551,258
$ 120,183,807
LIABILITIES AND SHAREHOLDERS’
EQUITY Current liabilities: Accounts payable $ 16,033,216 $
17,044,726 Accrued expenses 5,860,058 7,224,963 Accrued wages,
salaries and bonuses 2,558,420 3,282,354 Income taxes payable
230,066 — Current maturities of long-term debt 357,000
351,383 Total current liabilities 25,038,760
27,903,426 Credit facility 17,609,387 20,902,207 Deferred
income taxes 3,772,620 3,696,098 Long-term debt, less current
maturities 3,204,052 3,384,319 Other long-term liabilities 30,838
34,860
Series A cumulative, Convertible Preferred
Stock, $.01 par value 100,000 shares authorized and issued, and a
total liquidation preference of $2.5 million at both March 2016 and
September 2015
2,500,000 2,500,000 Series B cumulative, Convertible Preferred
Stock, $.01 par value 80,000 shares authorized, 16,000 shares
issued and outstanding at both March 2016 and September 2015, and a
total liquidation preference of $0.4 million at both March 2016 and
September 2015 400,000 400,000 Shareholders’ equity:
Preferred stock, $.01 par value, 1,000,000 shares authorized,
116,000 shares outstanding and issued in Series A and B referred to
above — — Common stock, $.01 par value, 3,000,000 shares
authorized, 604,022 shares outstanding at March 2016 and 621,104
shares outstanding at September 2015 7,197 7,061 Additional paid-in
capital 16,697,234 15,509,199 Retained earnings 55,519,822
53,527,606 Treasury stock at cost (10,228,652 )
(7,680,969 ) Total shareholders’ equity 61,995,601
61,362,897 $ 114,551,258 $ 120,183,807
AMCON Distributing Company and Subsidiaries
Condensed Consolidated Unaudited Statements of Operations
for the three and six months ended March 31, 2016 and 2015
For the three months ended
March
For the six months ended March
2016 2015 2016 2015 Sales (including
excise taxes of $88.7 million and $87.4 million, and $186.0 million
and $184.4 million, respectively) $ 296,449,126 $ 287,443,864 $
618,457,375 $ 602,877,340 Cost of sales 278,908,888
269,710,529 581,955,233
565,617,473 Gross profit 17,540,238
17,733,335 36,502,142 37,259,867
Selling, general and administrative expenses 14,770,358 15,485,757
30,615,492 31,666,879 Depreciation and amortization 575,681
590,857 1,142,630
1,167,162 15,346,039 16,076,614
31,758,122 32,834,041 Operating income
2,194,199 1,656,721 4,744,020
4,425,826 Other expense (income):
Interest expense 161,402 194,375 373,856 431,517 Other (income),
net (35,827 ) (35,987 ) (63,082 )
(43,054 ) 125,575 158,388
310,774 388,463 Income from operations before
income tax expense 2,068,624 1,498,333 4,433,246 4,037,363 Income
tax expense 922,000 729,000
1,931,000 1,722,000 Net income 1,146,624
769,333 2,502,246 2,315,363 Preferred stock dividend requirements
(48,643 ) (48,108 ) (97,820 ) (97,285 )
Net income available to common shareholders $ 1,097,981 $
721,225 $ 2,404,426 $ 2,218,078 Basic
earnings per share available to common shareholders $ 1.81 $ 1.17 $
3.90 $ 3.61 Diluted earnings per share available to common
shareholders $ 1.61 $ 1.04 $ 3.46 $ 3.15 Basic weighted
average shares outstanding 606,080 615,822 615,768 614,173 Diluted
weighted average shares outstanding 712,547 737,180 723,317 735,599
Dividends declared and paid per common share $ 0.18 $ 0.18 $
0.64 $ 0.36
AMCON Distributing Company and
Subsidiaries Condensed Consolidated Unaudited Statements of
Cash Flows for the six months ended March 31, 2016 and
2015 2016 2015 CASH
FLOWS FROM OPERATING ACTIVITIES: Net income $ 2,502,246 $ 2,315,363
Adjustments to reconcile net income from operations to net cash
flows from operating activities: Depreciation 960,130 984,662
Amortization 182,500 182,500 (Gain) loss on sale of property and
equipment (34,482 ) 7,036 Equity-based compensation 660,203 607,661
Deferred income taxes 352,242 238,555 Provision (recovery) for
losses on doubtful accounts (67,000 ) 159,999 Provision (recovery)
for losses on inventory obsolescence 70,818 (34,189 ) Other (4,022
) (4,023 ) Changes in assets and liabilities: Accounts
receivable 2,677,840 2,279,407 Inventories 4,128,553 (21,852,218 )
Prepaid and other current assets (1,954,372 ) 1,708,944 Other
assets 20,467 111,792 Accounts payable (1,005,681 ) 200,996 Accrued
expenses and accrued wages, salaries and bonuses (1,479,465 )
(862,235 ) Income taxes payable 343,304
(1,577,138 ) Net cash flows from operating activities 7,353,281
(15,532,888 ) CASH FLOWS FROM INVESTING ACTIVITIES: Purchase
of property and equipment (692,402 ) (611,106 ) Proceeds from sales
of property and equipment 48,164 7,800
Net cash flows from investing activities (644,238 ) (603,306 )
CASH FLOWS FROM FINANCING ACTIVITIES: Net (payments)
borrowings on bank credit agreements (3,292,820 ) 16,881,883
Principal payments on long-term debt (174,650 ) (169,782 )
Repurchase of common stock (2,547,683 ) — Dividends paid on
convertible preferred stock (97,820 ) (97,285 ) Dividends on common
stock (412,210 ) (232,488 ) Withholdings on the exercise of
equity-based awards (81,406 ) (156,497 ) Net cash
flows from financing activities (6,606,589 )
16,225,831 Net change in cash 102,454 89,637
Cash, beginning of period 219,536 99,922
Cash, end of period $ 321,990 $ 189,559
Supplemental disclosure of cash flow information: Cash paid during
the period for interest $ 391,130 $ 403,758 Cash paid during the
period for income taxes 1,235,454 3,060,584 Supplemental
disclosure of non-cash information: Equipment acquisitions
classified as accounts payable 17,500 48,754 Issuance of common
stock in connection with the vesting and exercise of equity-based
awards 1,174,981 1,240,842
View source
version on businesswire.com: http://www.businesswire.com/news/home/20160418006512/en/
AMCON Distributing CompanyChristopher H. Atayan,
402-331-3727
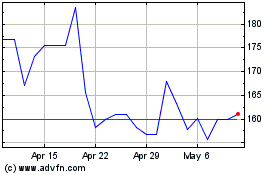
AMCON Distributing (AMEX:DIT)
Historical Stock Chart
From Mar 2024 to Apr 2024

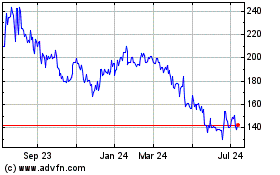
AMCON Distributing (AMEX:DIT)
Historical Stock Chart
From Apr 2023 to Apr 2024
