Form FWP - Filing under Securities Act Rules 163/433 of free writing prospectuses
May 14 2024 - 4:08PM
Edgar (US Regulatory)
Filed Pursuant to Rule 433
Registration Statement No. 333-275898


|
•
|
Trade Date: May 31, 2024
|
|
•
|
Settlement Date: June 5, 2024
|
|
•
|
Valuation Date: June 1, 2026
|
|
•
|
Maturity Date: June 4, 2026
|
|
•
|
Reference Asset: S&P 500 Market Agility 10 TCA 0.5% Decrement Index ("SPMKTD")
|
|
•
|
Participation Rate: 130%
|
|
•
|
Minimum Payment: $1,000 per $1,000 in principal amount
|
|
•
|
Percentage Change of the Reference Asset:
|

|
•
|
If the Final Level of the Reference Asset is greater than the Initial Level, the investor will receive a return based on the Percentage Change multiplied by the Participation Rate.
|
|
•
|
Return of principal amount only if the Final Level of the Reference Asset is less than or equal to the Initial Level.
|

|
•
|
The notes are subject to Royal Bank of Canada’s credit risk.
|
|
•
|
The notes do not pay interest.
|
|
•
|
Your notes are likely to have limited liquidity.
|
|
•
|
Your potential payment at maturity is limited.
|
|
•
|
Please see the following page for important risk factor information.
|

|
•
|
We intend to take the position that the notes will be treated as debt instruments subject to the special tax rules governing contingent payment debt instruments for U.S. federal income tax
purposes.
|

DETERMINING PAYMENT AT MATURITY

Additional Key Information:
This document is a summary of the preliminary terms of an equity linked note that Royal Bank of Canada will issue. It does not contain all of the material terms of, or
risks related to, these notes. You should read the preliminary terms supplement for the notes and the documents described below before investing. In addition, you should consult your accounting, legal and tax advisors before investing. The
preliminary terms supplement for this offering will be provided to you prior to your investment decision, and it may also be accessed here:
https://www.sec.gov/Archives/edgar/data/1000275/000114036124025895/ef20029080_424b2.htmThe notes are not bail-inable notes under the Canada Deposit Insurance Corporation Act.
You should review the preliminary terms supplement carefully prior to investing in the notes. In particular, you should carefully review the relevant risk factors set forth
therein, including, but not limited to, the following:
| • |
You May Not Earn a Positive Return on Your Investment.
|
| • |
The Notes Do Not Pay Interest and Your Return May Be Lower than the Return on a Conventional Debt Security of Comparable Maturity.
|
| • |
Payments on the Notes Are Subject to Our Credit Risk, and Changes in Our Credit Ratings Are Expected to Affect the Market Value of the Notes.
|
| • |
You Will Be Required to Include Income on the Notes Over Their Term Based Upon a Comparable Yield, Even Though You Will Not Receive Any Payments Until Maturity.
|
| • |
There May Not Be an Active Trading Market for the Notes—Sales in the Secondary Market May Result in Significant Losses.
|
| • |
The Initial Estimated Value of the Notes Will Be Less than the Price to the Public.
|
| • |
The Initial Estimated Value of the Notes that We Will Provide in the Final Pricing Supplement Will Be an Estimate Only, Calculated as of the Time the Terms of the Notes Are Set.
|
| • |
Our Business Activities May Create Conflicts of Interest.
|
| • |
The Reference Asset Is Subject to a Decrement Fee of 0.5% Per Annum That Will Adversely Affect the Performance of the Reference Asset.
|
| • |
The Calculation of the Reference Asset is Based on the Performance of the S&P 500 Market Agility TCA Index (the “MA Index”), Which Is Comprised of the S&P 500 Long/Short Risk Aware Daily Risk
Control 10% TCA Excess Return Index (the “Equity Component”) and the S&P U.S. Treasury Futures Long/Short Risk Aware Daily Risk Control 10% TCA Excess Return Index (the “Fixed Income Component”). The MA Index Is Subject to a
Transaction Cost, the Equity Component Is Subject to a Funding Cost and a Transaction Cost, and the Fixed Income Component Is Subject to a Transaction Cost, In Each Case, That Will Adversely Affect the Performance of the Reference
Asset.
|
| • |
Each of the Reference Asset, the Equity Component and the Fixed Income Component Relies on a Measure of Realized Volatility to Predict Future Volatility and Thereby to Achieve Their Respective Volatility
Targets of 10%. There Is No Assurance that the Respective Methods for Calculating Realized Volatility Are the Best Ways to Calculate Realized Volatility or a Reliable Way to Predict Future Volatility or to Achieve the Respective
Volatility Targets.
|
| • |
There Is No Guarantee that the Reference Asset, the Equity Component or the Fixed Income Component Will Achieve Their Respective 10% Volatility Targets.
|
| • |
The Reference Asset’s Exposure to the MA Index, the Equity Component’s Exposure to the S&P 500 Total Return Index (the “SPXT”), and the Fixed Income Component’s Exposure to the S&P 10-Year U.S.
Treasury Note Futures Excess Return Index and the S&P 2-Year U.S. Treasury Note Futures Excess Return Index (the “Treasury Indices”) May Be Rebalanced into a Hypothetical Non-Interest Bearing Cash Position on Any or All Days
During the Term of the Notes. The Non-Interest Bearing Cash Position Will Not Earn Interest or a Positive Yield.
|
| • |
Even Though the Titles of the Equity Component and the Fixed Income Component Include the Phrase “Risk Control,” Each Component May Decrease Significantly or Not Increase Significantly Relative to Their
Respective Underlying Indices.
|
| • |
Controlled Volatility Does Not Mean the Reference Asset, the Equity Component or the Fixed Income Component Will Have Lower Volatility than the MA Index, the SPXT or the Treasury Indices, respectively.
|
| • |
Because the Equity Component and the Fixed Income Component May Include Notional Short Positions, the Notes May Be Subject to Additional Risks.
|
| • |
The Methodology for Determining the Exposure Direction of the Equity Component or the Fixed Income Component May Not Be a Reliable Predictor of Whether the Daily Percentage Change of the SPXT or a Treasury
Index, Respectively, Will Be Positive or Negative.
|
| • |
The Reference Asset, Through the Fixed Income Component, Is Linked In Part to the Performance of the Treasury Indices, Which Are Comprised of Futures Contracts.
|
| • |
Negative Roll Yields Will Adversely Affect the Level of the Treasury Indices Over Time and Therefore the Payment at Maturity.
|
| • |
The Treasury Indices Are Excess Return Indices, Not Total Return Indices.
|
| • |
Owning the Notes Is Not the Same as Directly Owning the Treasuries or Futures Contract Directly or Indirectly Tracked by the Treasury Indices.
|
| • |
Suspension or Disruptions of Market Trading in Treasuries or Futures Contracts May Adversely Affect the Value of the Notes.
|
RBC Capital Markets is the global brand name for the capital markets business of Royal Bank of Canada and its affiliates, including RBC Capital Markets, LLC (member FINRA,
NYSE and SIPC); RBC Dominion Securities Inc. (member IIROC and CIPF); Royal Bank of Canada – Sydney Branch (ABN 86 076 940 880); RBC Capital Markets (Hong Kong) Limited (regulated by the Securities and Futures Commission of Hong Kong and
the Hong Kong Monetary Authority) and RBC Europe Limited (authorized by the Prudential Regulation Authority and regulated by the Financial Conduct Authority and Prudential Regulation Authority.) ® Registered trademark of Royal
Bank of Canada. Used under license. All rights reserved.
Royal Bank of Canada has filed a registration statement (including a product prospectus supplement, a prospectus supplement, and a prospectus) with the SEC for the offering to which this
document relates. Before you invest, you should read those documents and the other documents relating to this offering that we have filed with the SEC for more complete information about us and this offering. You may obtain these documents
without cost by visiting EDGAR on the SEC website at www.sec.gov. Alternatively, Royal Bank of Canada, any agent or any dealer participating in this offering will arrange to send you the product prospectus supplement, the prospectus
supplement and the prospectus if you so request by calling toll-free at 1-877-688-2301.
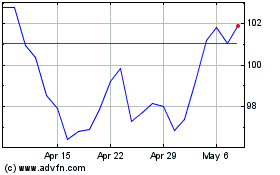
Royal Bank of Canada (NYSE:RY)
Historical Stock Chart
From Apr 2024 to May 2024

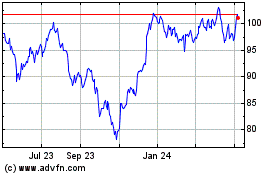
Royal Bank of Canada (NYSE:RY)
Historical Stock Chart
From May 2023 to May 2024
