SECURITIES AND EXCHANGE COMMISSION
Washington, D.C. 20549
FORM 6-K
REPORT OF FOREIGN PRIVATE ISSUER
PURSUANT TO RULE 13a-16 OR 15d-16
UNDER THE SECURITIES EXCHANGE ACT OF 1934
For the month of
February 2016
Commission File Number 001-12284
GOLDEN STAR
RESOURCES LTD.
(Translation
of registrant’s name into English)
150 King
Street West
Suite 1200
Toronto, Ontario
M5H
1J9, Canada
(Address of
principal executive office)
Indicate by check mark whether the registrant files or will file annual reports under cover of Form 20-F or Form 40-F.
Form
20-F ¨ Form 40-F x
Indicate by check mark if the registrant is submitting the Form 6-K in paper as permitted by Regulation S-T Rule 101(b)(1): ¨
Indicate by check mark if the registrant is submitting the Form 6-K in paper as permitted by Regulation S-T
Rule 101(b)(7): ¨
Indicate by check mark whether the registrant by furnishing the information
contained in this Form is also thereby furnishing the information to the Commission pursuant to Rule 12g3-2(b) under the Securities Exchange Act of 1934. Yes ¨ No x
If “Yes” is marked, indicate below the file number assigned to the registrant in connection with
Rule 12g3-2(b):
SIGNATURES
Pursuant to the requirements of the Securities Exchange Act of 1934, the registrant has duly caused this report to be signed on its behalf by
the undersigned, thereunto duly authorized.
Date: February
23, 2016
|
|
|
| GOLDEN STAR RESOURCES LTD. |
|
|
| By: |
|
/s/ André van Niekerk |
|
|
André van Niekerk Executive Vice
President and Chief Financial Officer |
EXHIBIT INDEX
|
|
| Exhibit No. |
Description of Exhibit |
|
|
| 99.1 |
Press Release dated February 23, 2016 - Golden Star Increases Mineral Reserves by Over 10% to 2.1 Million Ounces |
|
|
Exhibit 99.1
Golden Star Increases Mineral Reserves by Over 10% to 2.1 Million
Ounces
TORONTO, Feb. 23, 2016 /CNW/ - Golden Star Resources Ltd.
(NYSE MKT: GSS; TSX: GSC; GSE: GSR) ("Golden Star" or the "Company") announces its Mineral Reserves and Mineral
Resources estimate as of December 31, 2015.
Highlights
| · | Mineral Reserves increased by over 10% to 2.1 million
ounces |
| · | Grade increased by 34% to 2.8 grams per tonne (g/t)
|
| · | Tonnage declined to 23.6 million tonnes |
| · | Mineral Reserves are composed of only non-refractory
ounces |
| · | Measured and Indicated Mineral Resources(1),
inclusive of Mineral Reserves, increased to 4.7 million ounces |
| · | Grade remained relatively constant at 2.4 g/t |
| · | Tonnage increased to 61.4 million tonnes |
Sam Coetzer, President and CEO of Golden Star, commented:
"The 2015 Mineral Reserve statement is a true reflection of our transformation to become a low cost and far less complex
Company. Approximately 60% of the Company's Mineral Reserve base is now contained in our two high grade underground mines.
This concentration allows for much greater predictability and reliability of production and costs throughout our properties as
the underground operations will be impacted less by seasonal changes and fuel price fluctuations."
Proven and Probable Mineral Reserves and Measured and Indicated
Mineral Resources summary as of December 31, 2015
| |
Tonnes
(000) |
Grade
(g/t) |
Ounces
(000) |
| Proven and Probable Mineral Reserves(1) |
23,626 |
2.82 |
2,143 |
| Measured and Indicated Mineral Resources(1)(2) |
61,360 |
2.38 |
4,700 |
(1) Includes only non-refractory material
(2) Mineral Resources are inclusive of Mineral Reserves.
Mineral Reserves were estimates using $1,100 gold price per
ounce. Mineral Resources were estimated using a $1,300 gold price per ounce.
Mineral Reserves
Total Proven and Probable Mineral Reserves for the year ending
December 31, 2015, increased to over 2.1 million ounces from approximately 1.9 million ounces the previous year. Grades increased
by 34%, to 2.82 g/t offset by a 17% decline in tonnage to 23.6 million. The gain was achieved after depletion from production
in 2015 and despite the $100 lower gold price assumption used in the estimation versus the gold price assumption used in the prior
year. This estimation does not include any refractory material at Bogoso / Prestea as the refractory operation was suspended
in 2015.
Wassa
Total Proven and Probable Mineral Reserves at Wassa decreased
slightly to 1.5 million ounces from 2014 while grades increased by 11% to 2.27 g/t and tonnage decreased to 20.4 million tonnes. Most
notable is the increase in grade at the Wassa Underground, from 4.26 g/t to 4.59 g/t. The gains at Wassa Underground and in
the Wassa stockpiles were offset by the depletion from production of the Wassa Open Pit.
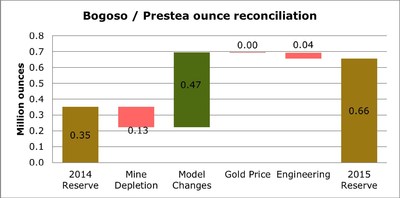
Bogoso / Prestea
Total Proven and Probable Mineral Reserves at Bogoso / Prestea
increased significantly to 656,000 ounces when comparing to 2014. The increase was almost entirely driven by the newly declared
Mineral Reserves at Prestea Underground, which is expected to commence production sometime in mid-2017. The increases
were slightly offset by the depletion due to production in 2015.
The following table provides a breakdown of the Proven and
Probable Mineral Reserves:
| |
Dec 31, 2015 Proven
Mineral Reserve |
Dec 31, 2015 Probable
Mineral Reserve |
Dec 31, 2015 Proven and
Probable Mineral Reserve |
Dec 31, 2014 Proven and
Probable Mineral Reserve |
tonnes
(000) |
grade
g/t Au |
ounces
(000) |
tonnes
(000) |
grade
g/t Au |
ounces
(000) |
tonnes
(000) |
grade
g/t Au |
ounces
(000) |
tonnes
(000) |
grade
g/t Au |
ounces
(000) |
| Wassa Open Pit |
257 |
1.56 |
13 |
13,922 |
1.46 |
654 |
14,179 |
1.46 |
667 |
17,831 |
1.42 |
815 |
| Wassa Underground |
- |
- |
- |
5,397 |
4.59 |
796 |
5,397 |
4.59 |
796 |
5,437 |
4.26 |
745 |
| Stockpiles |
789 |
0.93 |
24 |
- |
- |
- |
789 |
0.93 |
24 |
820 |
0.73 |
19 |
| Total Wassa |
1,046 |
1.09 |
37 |
19,319 |
2.33 |
1,450 |
20,365 |
2.27 |
1,486 |
24,089 |
2.04 |
1,579 |
| Bogoso / Prestea (refractory) |
- |
- |
- |
- |
- |
- |
- |
- |
- |
1,954 |
2.52 |
158 |
| Mampon |
- |
- |
- |
304 |
4.60 |
45 |
304 |
4.60 |
45 |
320 |
4.43 |
46 |
| Prestea South |
- |
- |
- |
1,892 |
2.30 |
140 |
1,892 |
2.30 |
140 |
1,697 |
2.24 |
122 |
| Prestea Underground |
- |
- |
- |
1,041 |
14.02 |
469 |
1,041 |
14.02 |
469 |
- |
- |
- |
| Stockpiles |
25 |
2.69 |
2 |
- |
- |
- |
25 |
2.69 |
2 |
405 |
1.82 |
24 |
| Total Bogoso / Prestea |
25 |
2.69 |
2 |
3,237 |
6.29 |
654 |
3,261 |
6.26 |
656 |
4,376 |
2.49 |
350 |
| Total |
1,071 |
1.12 |
39 |
22,556 |
2.90 |
2,104 |
23,626 |
2.82 |
2,143 |
28,465 |
2.11 |
1,929 |
| Total excl. refractory |
1,071 |
1.12 |
39 |
22,556 |
2.90 |
2,104 |
23,626 |
2.82 |
2,143 |
26,510 |
2.08 |
1,771 |
**Numbers may not add due to rounding. See the end of
this news release for additional notes.
Reconciliation of Mineral Reserves
The following graphs provide a reconciliation of the Company's
Proven and Probable Mineral Reserves from December 31, 2014 and December 31, 2015:
(Please see Figures 1-3)
** Numbers may not add due to rounding.
Mineral Resources
Total Measured and Indicated Mineral Resources, inclusive
of the Proven and Probable Mineral Reserves, of 6.1 million ounces as of December 31, 2015 were slightly lower than they were as
of December 31, 2014, mostly driven by fewer tonnes with grade remaining relatively consistent at 2.5 g/t. Given the Company's
decision to discontinue refractory operations in 2015 resulting in no refractory mineral resource development in the year, the
decline in Mineral Resources can largely be attributed to the depletion in the refractory ounces from production in 2015.
Mineral Resources, inclusive of Mineral Reserves but excluding
refractory material, as of December 31, 2015 increased slightly to 4.7 million ounces driven by slightly lower grade, 2.38 g/t,
and slightly more tonnes, 61.4 million tonnes, despite the lower gold price and the depletion from production of the non-refractory
ounces.
Wassa
Total Measured and Indicated Mineral Resources at Wassa have
increased slightly to 3.6 million ounces from December 31, 2014 resulting from a decline in grade and increase in tonnage. Measured
and Indicated Resources at Wassa Underground increased by 10% to 1.6 million ounces, while grade declined by 5% to 3.85 g/t and
tonnage increased slightly. First ore production from the Wassa Underground is expected in the second half of 2016.
Bogoso / Prestea
Total Measured and Indicated Mineral Resource at Bogoso /
Prestea is 2.6 million ounces, a decrease of approximately 18% from 2014 attributed to the decline in refractory ounces due to
depletion from production during 2015. Much of the decline in tonnage was offset by the 16% increase to average grades attributable
to the 5% increase in the grade at Prestea Underground to 15.52 g/t.
The following table provides a breakdown of the Measured and
Indicated Mineral Resources:
| |
Dec 31, 2015
Measured
Mineral Resources |
Dec 31, 2015
Indicated
Mineral Resources |
Dec 31, 2015
Measured and Indicated Mineral Resources |
Dec 31, 2014
Measured and Indicated Mineral Resources |
tonnes
(000) |
grade
g/t Au |
ounces
(000) |
tonnes
(000) |
grade
g/t Au |
ounces
(000) |
tonnes
(000) |
grade
g/t Au |
ounces
(000) |
tonnes
(000) |
grade
g/t Au |
ounces
(000) |
| Wassa Open Pit |
243 |
1.72 |
13 |
37,731 |
1.23 |
1,488 |
37,974 |
1.23 |
1,501 |
33,039 |
1.37 |
1,458 |
| Wassa Underground |
- |
- |
- |
13,090 |
3.85 |
1,621 |
13,090 |
3.85 |
1,621 |
11,248 |
4.07 |
1,471 |
| Wassa Other |
- |
|
- |
3,583 |
3.76 |
434 |
3,583 |
3.76 |
434 |
5,199 |
3.53 |
590 |
| Subtotal Wassa |
243 |
1.72 |
13 |
54,404 |
2.03 |
3,543 |
54,647 |
2.02 |
3,556 |
49,486 |
2.21 |
3,519 |
| Bogoso / Prestea (refractory) |
- |
- |
- |
14,740 |
3.00 |
1,420 |
14,740 |
3.00 |
1,420 |
23,245 |
2.77 |
2,071 |
| Mampon |
- |
- |
- |
396 |
4.25 |
54 |
396 |
4.25 |
54 |
557 |
3.44 |
62 |
| Prestea South |
- |
- |
- |
2,568 |
2.12 |
175 |
2,568 |
2.12 |
175 |
3,710 |
2.03 |
243 |
| Prestea Underground |
- |
- |
- |
1,597 |
15.52 |
797 |
1,597 |
15.52 |
797 |
1,322 |
14.82 |
630 |
| Bogoso / Prestea Other |
- |
- |
- |
2,151 |
1.70 |
118 |
2,151 |
1.70 |
118 |
2,418 |
1.66 |
129 |
| Subtotal Bogoso / Prestea |
- |
- |
- |
21,452 |
3.72 |
2,564 |
21,452 |
3.72 |
2,564 |
31,253 |
3.12 |
3,135 |
| Total |
243 |
1.72 |
13 |
75,856 |
2.50 |
6,107 |
76,100 |
2.50 |
6,120 |
80,739 |
2.56 |
6,653 |
| Total excl. Refractory |
243 |
1.72 |
13 |
61,116 |
2.39 |
4,687 |
61,360 |
2.38 |
4,700 |
57,494 |
2.48 |
4,583 |
** Numbers may not add due to rounding. See the end of
this news release for additional notes.
Inferred Mineral Resources
Total Inferred Mineral Resources increased by 28% to 3.3 million
ounces with increased grades and tonnage as the drivers. When refractory material is excluded the increase improves to 34% or 3.1
million ounces. The increase in Inferred Mineral Resources can largely be attributed to the 55% increase in ounces at Wassa.
The following table provides a breakdown of the Inferred Mineral
Resources:
| |
Dec 31, 2015
Inferred Mineral Resources |
Dec 31, 2014
Inferred Mineral Resources |
tonnes
(000) |
grade
g/t Au |
ounces
(000) |
tonnes
(000) |
grade
g/t Au |
ounces
(000) |
| Wassa Open Pit |
286 |
1.37 |
13 |
137 |
1.47 |
6 |
| Wassa Underground |
14,442 |
4.16 |
1,930 |
10,331 |
3.69 |
1,227 |
| Wassa Other |
1,764 |
4.53 |
257 |
1,127 |
4.97 |
180 |
| Subtotal Wassa |
16,492 |
4.15 |
2,200 |
11,596 |
3.79 |
1,414 |
| Bogoso / Prestea (refractory) |
1,184 |
4.22 |
161 |
2,073 |
3.52 |
235 |
| Mampon |
103 |
2.08 |
7 |
257 |
1.72 |
14 |
| Prestea South |
72 |
2.34 |
5 |
549 |
2.49 |
44 |
| Prestea Underground |
3,249 |
8.74 |
913 |
3,253 |
8.05 |
842 |
| Bogoso / Prestea Other |
389 |
1.54 |
19 |
510 |
1.48 |
24 |
| Subtotal Bogoso / Prestea |
4,997 |
6.88 |
1,105 |
6,643 |
5.43 |
1,159 |
| Total |
21,486 |
4.78 |
3,305 |
18,238 |
4.39 |
2,573 |
| Total excl. refractory |
20,305 |
4.82 |
3,144 |
16,166 |
4.50 |
2,338 |
** Numbers may not add due to rounding. See the end of
this news release for additional notes.
| Notes to the Mineral Reserve Statement: |
| (1) |
The Mineral Reserves as of December 31, 2015 were estimated using a gold price assumption of $1,100 per ounce. |
| (2) |
The slope angles of all pit designs are based on geotechnical criteria as established by external consultants. The size and shape of the pit designs are guided by consideration of the results from a pit optimization program. |
| (3) |
Cut-off grades have been estimated based on operating cost projections, mining dilution and recovery, government royalty payment requirements and applicable metallurgical recovery. Marginal cut-off grade estimates for the open pits are as follows: Wassa 0.70 g/t; Mampon 1.52 g/t; and Prestea South 1.23 g/t. Break-even cut-off grade estimates for the underground mines are as follows: Wassa Underground 2.39 g/t; and Prestea Underground 7.50 g/t. |
| Notes to the Measured and Indicated Mineral Resource and the Inferred Mineral Resources: |
| (1) |
The Mineral Resources for Wassa Other include Father Brown, Benso and Chichiwilli. |
| (2) |
The Mineral Resources for Bogoso / Prestea Other include Chujah, Dumasi, Bogoso North, Buesichem, Opon, and Ablifa. |
| (3) |
The Wassa Underground Mineral Resource has been estimated below the $1,300 per ounce of gold pit shell using an economic gold grade cut-off of 1.81 g/t Au, which the Company believes would be the lower cut-off for underground. |
| (4) |
The Father Brown Underground Mineral Resource has been estimated below the $1,300 per ounce of gold pit shell using an economic gold grade cut-off of 3.17 g/t Au, which the Company believes would be the lower cut-off for underground. |
| (5) |
Prestea Underground Mineral Resource has been estimated below the $1,300 pit shell of Prestea South down to 3800m elevation using a gold cut-off at 5.43 g/t Au. |
| (6) |
Mineral Resources were estimated using optimized pit shells at a gold price of $1,300 per ounce. Other than gold price, the same optimized pit shell and underground parameters and modifying factors used to determine the Mineral Reserves were used to determine the Mineral Resources. |
Company Profile
Golden Star is an established gold mining company that owns
and operates the Wassa and Prestea mines situated on the prolific Ashanti Gold Belt in western Ghana, Africa. Listed on the NYSE
MKT, the TSX, and the GSE, Golden Star is strategically focused on increasing operating margins and cash flow through the development
of two high grade, low cost underground mines both beneath existing open pit operations. The Wassa Underground is expected to commence
production in 2016 with the Prestea Underground commencing production in 2017. Both projects are fully funded and on track
to begin production as expected. Production in 2016 is expected to be between 180,000 – 205,000 ounces of gold with costs
between $815 - $925 per ounce.
Statements Regarding Forward-Looking Information
Some statements contained in this news release are "forward-looking
statements" within the meaning of the Private Securities Litigation Reform Act of 1995 and "forward looking information"
within the meaning of Canadian securities laws. Forward looking statements and information include but are not limited to, statements
and information regarding: Mineral Reserve and Mineral Resource estimates and underlying assumptions; the timing of the commencement
of production at Prestea Underground and at Wassa Underground and as to both projects being fully funded; the impact of the underground
resource base on the predictability and reliability of production; underground operations being less impacted by seasonal changes
and fuel price fluctuations; anticipated production and associated costs in 2016; and the transformation of Wassa and Prestea to
lower cost mines and the Company into a lower cost producer. Generally, forward-looking information and statements can be
identified by the use of forward-looking terminology such as "plans", "expects", "is expected", "budget",
"scheduled", "estimates", "forecasts", "intends", "anticipates", "believes"
or variations of such words and phrases (including negative or grammatical variations) or statements that certain actions, events
or results "may", "could", "would", "might" or "will be taken", "occur"
or "be achieved" or the negative connotation thereof. Investors are cautioned that forward-looking statements and information
are inherently uncertain and involve risks, assumptions and uncertainties that could cause actual facts to differ materially. There
can be no assurance that future developments affecting the Company will be those anticipated by management. Please refer to
the discussion of these and other factors in our Annual Information Form for the year ended December 31, 2014. Our Annual
Information Form for the year ended December 31, 2014 will be superseded by our Annual Information From for the year ended December
31, 2015, which will contain similar information and will be made available on SEDAR at www.sedar.com. The forecasts contained
in this press release constitute management's current estimates, as of the date of this press release, with respect to the matters
covered thereby. We expect that these estimates will change as new information is received. While we may elect to update
these estimates at any time, we do not undertake any estimate at any particular time or in response to any particular event.
Technical Information
The Mineral Reserve and Mineral Resource estimates have been
compiled by the Company's technical personnel in accordance with definitions and guidelines set out in the Definition Standards
for Mineral Resources and Mineral Reserves adopted by the Canadian Institute of Mining, Metallurgy, and Petroleum and as required
by Canada's National Instrument 43-101 – Standards of Disclosure for Mineral Projects ("NI 43-101"). Mineral
Reserve estimates reflect the Company's reasonable expectation that all necessary permits and approvals will be obtained and maintained.
Mining dilution and mining recovery vary by deposit and have been applied in estimating the Mineral Reserves.
The Mineral Resource technical contents of this press release
have been reviewed and approved by S. Mitchel Wasel, BSc Geology, a "Qualified Person" pursuant to NI 43-101. Mr. Wasel
is Vice President Exploration for Golden Star and an active member of the Australasian Institute of Mining and Metallurgy. The
2015 estimates of Mineral Resources were prepared under the supervision of Mr. Wasel. The 2015 estimates of Mineral Reserves
were prepared under the supervision of Dr. Martin Raffield, Senior Vice President Technical Services for the Company. Dr.
Raffield is a "Qualified Person" as defined by NI 43-101.
Additional scientific and technical information relating to
the mineral properties referenced in this news release are contained in the following current technical reports for those properties
available at www.sedar.com: (i) Wassa - "NI 43-101 Technical Report on feasibility study of the Wassa open pit mine and underground
project in Ghana" effective date December 31, 2014; (ii) Prestea Underground - "NI 43-101 Technical Report on a Feasibility
Study of the Prestea Underground Gold Project in Ghana" effective date November 3, 2015; and (iii) Bogoso - "NI 43-101
Technical Report on Resources and Reserves Golden Star Resources Ltd., Bogoso Prestea Gold Mine, Ghana" effective date December
31, 2013.
Cautionary Note to US Investors Concerning Estimates of
Measured and Indicated Mineral Resources
This press release uses the terms "Measured Mineral Resources"
and "Indicated Mineral Resources". The Company advises US investors that while these terms are recognized and required
by NI 43-101, the US Securities and Exchange Commission ("SEC") does not recognize them. Also, disclosure of contained
ounces is permitted under Canadian regulations; however the SEC generally requires Mineral Resource information to be reported
as in-place tonnage and grade. US Investors are cautioned not to assume that any part or all of the mineral deposits in these
categories will ever be converted into Mineral Reserves.
Cautionary Note to US Investors Concerning Estimates of
Inferred Mineral Resources
This press release uses the term "Inferred Mineral Resources." The
Company advises US investors that while this term is recognized and required by NI 43-101, the SEC does not recognize it. "Inferred
Mineral Resources" have a great amount of uncertainty as to their existence, and great uncertainty as to their economic and
legal feasibility. It cannot be assumed that all or any part of Inferred Mineral Resources will ever be upgraded to a higher
category. In accordance with Canadian rules, estimates of Inferred Mineral Resources cannot form the basis of feasibility or other
economic studies. US investors are cautioned not to assume that any part or all of the Inferred Mineral Resource exists, or
is economically or legally mineable.
SOURCE Golden Star Resources Ltd.
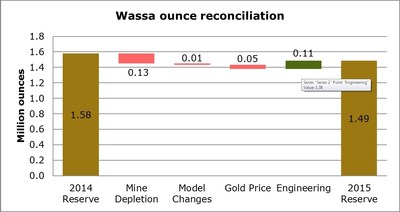
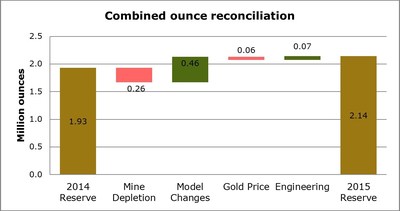
Image with caption: "Figure 1 ** Numbers may not add
due to rounding. (CNW Group/Golden Star Resources Ltd.)". Image available at: http://photos.newswire.ca/images/download/20160223_C8601_PHOTO_EN_625952.jpg
Image with caption: "Figure 2 ** Numbers may not add
due to rounding. (CNW Group/Golden Star Resources Ltd.)". Image available at: http://photos.newswire.ca/images/download/20160223_C8601_PHOTO_EN_625954.jpg
Image with caption: "Figure 3 ** Numbers may not add
due to rounding. (CNW Group/Golden Star Resources Ltd.)". Image available at: http://photos.newswire.ca/images/download/20160223_C8601_PHOTO_EN_625956.jpg
%CIK: 0000903571
For further information: please contact: Lisa Doddridge, Vice
President, Investor Relations and Corporate Affairs, +1 416 583 3800, investor@gsr.com
CO: Golden Star Resources Ltd.
CNW 16:30e 23-FEB-16
Golden Star Resources (AMEX:GSS)
Historical Stock Chart
From Mar 2024 to Apr 2024

Golden Star Resources (AMEX:GSS)
Historical Stock Chart
From Apr 2023 to Apr 2024
