WestBond Posts Record Sales Performance and Declares Quarterly Dividend Payment Date
November 21 2019 - 5:30PM

WestBond Enterprises Corporation (TSX-V: WBE) has posted a profit
of $136,909 for the three months ended September 30, 2019. This
represents an increase of 124% over the profit of $61,134 for the
three months ended September 30, 2018. Sales for the period
increased 10.3% to a record high of $3,007,023 this year compared
to $2,725,671 for the three months ended September 30, 2018.
Further sales growth was hindered by a temporary shortage of
personal hygiene paper supply early in the period, which was
resolved by the end of the period.
Sales of the company’s air laid products and clinical lines
continue strong. WestBond intends to continue to develop
these markets and increase profitability by improving production
efficiencies and lowering overhead costs.
The quarterly report and other information can
be found on the company’s website at www.westbond.ca and on SEDAR
at www.sedar.com.
The board of directors has declared the
quarterly dividend of $0.0025 per share is payable on
December 20, 2019 to shareholders of record on December 5,
2019.
For further information please contact:
Gennaro Magistrale
Chief Executive Officer, President and Director WestBond
Enterprises Corporation 101 – 7403 Progress Way, Delta, B.C. V4G
1E7
Tel: (604) 940-3939
Cautionary Note Regarding Forward
Looking Statements: This release includes certain
statements and information that constitute forward-looking
information within the meaning of applicable Canadian securities
laws, including statements regarding the Company’s intentions.
Generally, forward-looking statements and information can be
identified by the use of forward-looking terminology such as
“intends” or “anticipates”, or variations of such words and phrases
or statements that certain actions, events or results “may”,
“could”, “should” or “would” occur. Forward-looking statements are
based on certain material assumptions and analysis made by the
Company and the opinions and estimates of management as of the date
of this press release, including the ability to develop markets and
increase profitability. Although the Company considers these
assumptions to be reasonable based on information currently
available to it, they may prove to be incorrect, and the
forward-looking statements in this release are subject to numerous
risks, uncertainties and other factors that may cause future
results to differ materially from those expressed or implied in
such forward-looking statements. Such risk factors may
include, among others, changes in operating performance,
availability of and prices for raw materials, availability of
trained labour, foreign currency exchange rate fluctuations,
unexpected competition and other technical, market and economic
factors. Although management of the Company has attempted to
identify important factors that could cause actual results to
differ materially from those contained in forward-looking
statements or forward-looking information, there may be other
factors that cause results not to be as anticipated, estimated or
intended. There can be no assurance that such statements will prove
to be accurate, as actual results and future events could differ
materially from those anticipated in such statements. Accordingly,
readers should not place undue reliance on forward-looking
statements and forward-looking information. Readers are cautioned
that reliance on such information may not be appropriate for other
purposes. The Company does not undertake to update any
forward-looking statement, forward-looking information or financial
out-look that is incorporated by reference herein, except in
accordance with applicable securities laws. We seek safe
harbour.
Neither the TSX Venture Exchange nor its
Regulation Services Provider (as that term is defined in the
policies of the TSX Venture Exchange) accepts responsibility for
the adequacy or accuracy of this release.
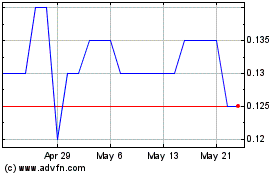
WestBond Enterprises (TSXV:WBE)
Historical Stock Chart
From Oct 2024 to Oct 2024

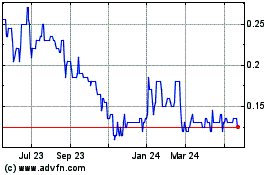
WestBond Enterprises (TSXV:WBE)
Historical Stock Chart
From Oct 2023 to Oct 2024
