Solana On The Brink? Price Stalemate At Crucial $140 Support
May 16 2024 - 6:50AM
NEWSBTC
Solana (SOL), the high-speed blockchain network, is facing a
balancing act. While experiencing a short-term price bump, analysts
warn of a potential plunge if a key technical level crumbles.
Related Reading: Floki Inu Moment Of Glory: Analysts Forecast
Explosive 200% Rally Bullish Flicker Amidst Bearish Gloom SOL’s
price has seen a recent uptick of 3.60%, currently hovering around
$162. However, this seemingly positive movement comes against the
backdrop of a broader downward trend. Analysts attribute this shift
to a change in market sentiment. Meanwhile, the altcoin’s RSI is
48, which denotes a neutral position. As a result, SOL has room to
move in either direction because it is neither overbought nor
oversold. A drop in trading activity has been observed, which is
typical of periods of consolidation. A spike in trade volume
following a breakout should confirm the trajectory of the trade.
Lifeline Or Looming Abyss? Crypto analyst Alan Santana emphasizes
the significance of the Exponential Moving Average 100 (EMA 100) as
a critical support level for SOL. The EMA 100 acts as a technical
indicator, reflecting the average price over the past 100 days. ✴️
Support Weakens | Solana To Crash Below 100#SOL | #Solana A trend
following system uses a moving average as the main tool to generate
trading signals for a system trader; the moving average is like the
holy grail of technical analysis, together with the RSI. The
moving… pic.twitter.com/9d5NrjuWWR — Alan Santana (@lamatrades1111)
May 14, 2024 Historically, SOL has found support at this level
during bullish periods. In September and October 2023, price
breakouts above the EMA 100 signaled positive market sentiment.
However, the recent trend reversal has cast a shadow over this once
reliable indicator. A Potential Price Plunge Santana warns that a
drop below the current EMA 100, sitting at roughly $140, could
trigger a significant downturn for SOL. This breach could instill
fear among investors, potentially leading to a sell-off and pushing
the price even lower. The analyst cautions of a possible plunge
below $100 if such a scenario unfolds. Solana: Beyond The Technical
While the technical analysis paints a concerning picture, it’s
crucial to remember the inherent volatility of the cryptocurrency
market. Short-term predictions based on technical indicators may
not always hold true. Other factors, such as industry news,
regulations, and broader market trends, can also play a significant
role in price movements. Related Reading: Buckle Up, XRP Fans:
Analyst Eyes Price Explosion To $0.65 In Next 5 Days For instance,
a positive regulatory stance towards cryptocurrencies could boost
investor confidence and lead to a price increase, even if technical
indicators suggest a downtrend. Conversely, negative news
surrounding a blockchain hack or security vulnerabilities could
trigger a sell-off, defying bullish technical signals. The Road
Ahead Solana’s future trajectory remains uncertain. Will the $140
price point become a launchpad for a recovery, or will it crumble,
sending SOL tumbling down deeper? Featured image from Pngtree,
chart from TradingView
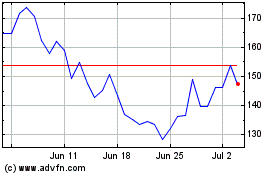
Solana (COIN:SOLUSD)
Historical Stock Chart
From Apr 2024 to May 2024

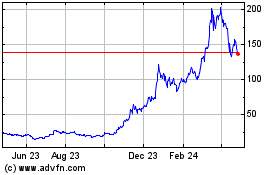
Solana (COIN:SOLUSD)
Historical Stock Chart
From May 2023 to May 2024
