SECURITIES AND EXCHANGE COMMISSION
Washington, D.C. 20549
FORM 6-K
Report of Foreign Private Issuer
Pursuant to Rule 13a-16 or 15d-16 of the
Securities Exchange Act of 1934
For the month of May, 2024
Commission File Number 1-14668
COMPANHIA PARANAENSE DE ENERGIA
(Exact name of registrant as specified in its
charter)
Energy Company of Paraná
(Translation of Registrant's name into English)
José Izidoro Biazetto, 158
81200-240 Curitiba, Paraná
Federative Republic of Brazil
+55 (41) 3331-4011
(Address of principal executive offices)
Indicate by check
mark whether the registrant files or will file annual reports under cover Form 20-F or Form 40-F. Form
20-F ___X___ Form 40-F _______
Indicate
by check mark whether the registrant by furnishing the information contained in this Form is also thereby furnishing the information
to the Commission pursuant to Rule 12g3-2(b) under the Securities Exchange Act of 1934.
Yes _______ No ___X____
List of contents
| 1. Consolidated Results |
2 |
| 1.1 EBITDA |
2 |
| 1.2 Operating Revenue |
3 |
| 1.3 Operating Costs and Expenses |
3 |
| 1.4 Equity in Earnings of Subsidiaries |
5 |
| 1.5 Financial Result |
5 |
| 1.6 Consolidated Net Income |
5 |
| 1.7 Debt |
6 |
| 2. Investments |
8 |
| 2.1 Investment Policy |
8 |
| 2.2 Investment Program |
8 |
| 3. Copel Geração e Transmissão |
9 |
| 3.1.1 IFRS Effect on the Transmission Segment |
10 |
| 3.2 Operacional Performance |
10 |
| 3.2.1 Generation |
11 |
| 3.2.2 Hydro and Wind Generation |
11 |
| 3.2.3 Thermal Generation |
11 |
| 3.3 Transmission |
12 |
| 3.3.1 RBSE Reprofiling |
12 |
| 4. Copel Distribuição |
13 |
| 4.1 Financial Performance |
13 |
| 4.1.1 Regulatory Efficiency |
14 |
| 4.2 Operacional Performance |
15 |
| 4.2.1 Grid Market (TUSD) |
15 |
| 4.2.2 Captive Market |
15 |
| 4.2.3 Concession Agreement |
15 |
| 4.2.4 Investment and Operational Data |
15 |
| 5. Copel Mercado Livre |
18 |
| 5.1 Financial Performance |
18 |
| 5.2 Operacional Performance |
19 |
| 6. Performance ESG |
20 |
| 6.1 Copel pioneers in ESG in the sector |
20 |
| 6.2 Recent Highlights |
20 |
| 6.3 Indicators |
21 |
| 6.4 Ratings, Rankings, and Indexes |
22 |
| 7. Other highlights |
23 |
| Exhibit |
29 |
1. Consolidated Results
The following analyses refer to the first quarter of 2024 compared
to the same period in 2023.
1.1 EBITDA
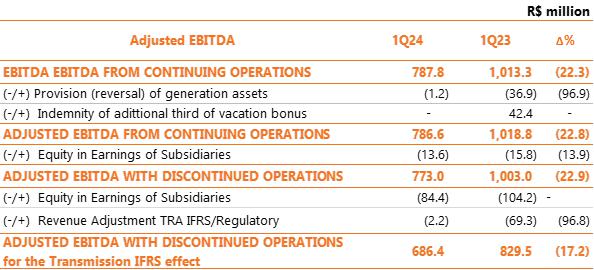
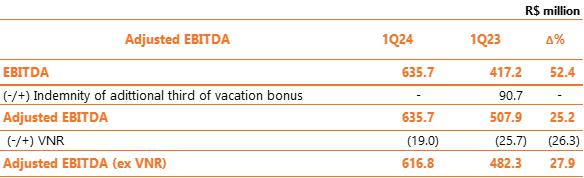
Copel's adjusted EBITDA1 (excluding, in addition
to non-recurring items, revenues from Copel Dis' VNR, equity and inflation on assets from transmission contracts) was R$1,329.7 million
in 1Q24. This amount was 6.3% lower than the R$ 1,418.8 million in 1Q23, mainly reflecting the lower average price of energy sold by
Copel GeT, partially offset by the increase in Copel Distribuição's revenue due to the 7.9% growth in the billed wire market
in its concession area.
Considering continuing operations (excluding the results of
Compagas and UEGA, which are in the process of being divested) and excluding only non-recurring items, adjusted EBITDA was R$1,411.4 million,
10.3% lower than the R$1,573.9 million in 1Q23.
Thus, the main factors that explain the result in the quarter are:
| (i) | Copel GeT's EBITDA of R$ 786.6 million, 22.8% lower than the R$ 1,018.7 million in 1Q23, basically as
a result of (a) the reduction in the average sale price of energy (R$ 174.86 in 1Q24 compared to R$ 205.98 in 1Q23, a reduction of 15.1%)
and the lower performance of wind farms, and (b) the lower remuneration on transmission contract assets, mainly due to lower inflation
in the comparison between periods (IPCA of 1.42% in 1Q24 compared to 2.09% in 1Q23), with a negative effect of R$ 32.4 million on Copel
GeT's electricity grid availability revenue and R$ 19.8 million on equity results; |
| (ii) | the increase in expenses with provisions and reversals, with R$ 87.2 million recorded in 1Q24 compared
to R$25.8 million in 1Q23 (in recurring terms), mainly due to the reversal of R$14.2 million in the PCLD (allowance for doubtful accounts)
in 1Q23 as a result of the recovery of invoices due to the end of the collection restrictions imposed by the COVID-19 pandemic within
the distributor, while in 1Q24 there was a provision of R$ 42.3 million. |
These events were partially compensated, essentially, by the better
result of Copel Distribuição, mainly due to (i) the 7.9% growth in the billed wire market; (ii) the tariff adjustment of
June 2023, with an average effect of 6.32% on the Tariffs for the Use of the Distribution System (TUSD); and (iii) the reduction of R$25.3
million in the line of "other operating costs and expenses", due, basically, to the higher recovery of taxes and disposal of
assets.
Considering discontinued operations, adjusted EBITDA, excluding
only non-recurring items, was
R$ 1,432.5 million in 1Q24, with a variation of 11.5% lower than the R$ 1,617.8 million in 1Q23, a reflection, in addition to factors
mentioned, the lower result of Compagas due to the lower sales volume for the cogeneration and industrial segments.
Adjusted Consolidated EBITDA
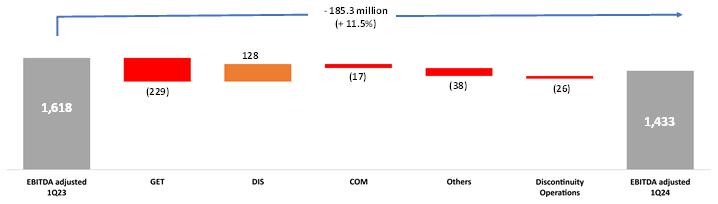
Note. Considers discontinued operations and equity
The non-recurring items that were neutralized for the calculation
of adjusted EBITDA are shown in the following table:
1
Excluding non-recurring items, fair value of Copel Distribuição's
indemnifiable concession assets (VNR), and IFRS effects on transmission contract assets.
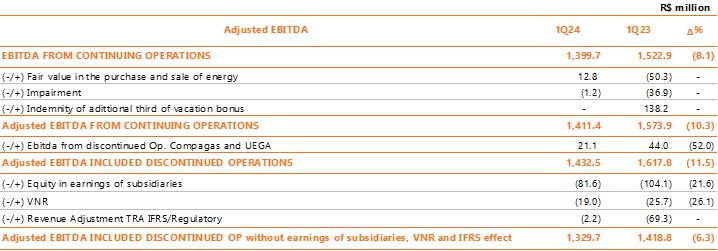
In 1Q24, the following non-recurring items were recorded: (i) R$
12.8 million related to the fair value of Copel Mercado Livre's power purchase and sale agreements (mark-to-market), an amount calculated
by the difference between the contracted price and the future market price estimated by the Company; and (ii) partial reversal of impairment
of generation assets in the amount of R$ 1.2 million, basically referring to the GPS HPP.
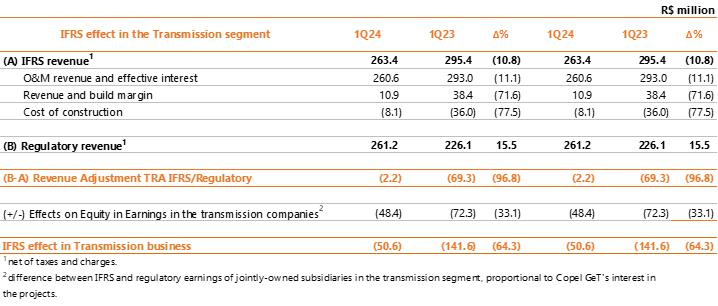
In the context of transmission assets, item 3.1.1 presents the regulatory
accounting of the result for the purpose of verifying the IFRS (International Financial Reporting Standards) effect.
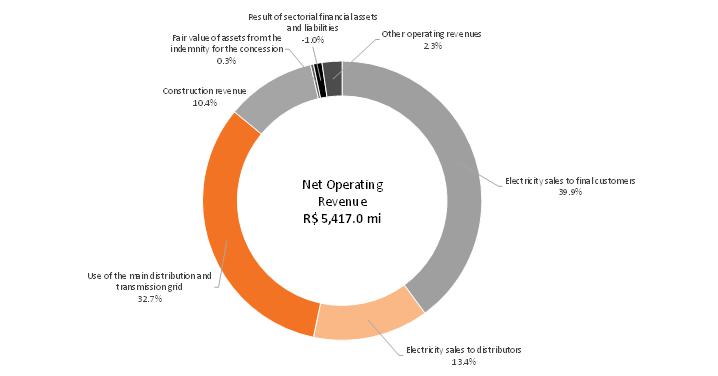
1.2 Operating Revenue
Net operating revenue from continuing operations totaled R$5,417.0
million in 1Q24, up 2.8% from R$5,267.6 million in 1Q23. This result is mainly a reflection of:
| (i) | the increase of R$ 309.1 million (+20.7%) in revenue from the availability of the electricity grid, mainly
due to the 7.9% growth in the billed wire market of Copel Distribuição, which considers the compensated energy of Mini and
Micro Distributed Generation – MMGD and the tariff adjustment of June 2023 of Copel Distribuição, with an average
effect of an increase of 6.32% in the tariffs for the use of the distribution system (TUSD); |
| (ii) | the increase of R$ 301.3 million (+15.8%) in electricity supply revenue, mainly due to the growth of 7.7%
in the billed captive market and the tariff adjustment applied to the distributor's Energy Tariff (TE) component in June 2023, with an
average effect of 17.4%; and |
| (iii) | the increase of R$ 45.3 million in construction revenue, mainly due to the increase in the volume of works
related to Copel Distribuição's "Transformation" program, which includes investments aimed at improving and modernizing
infrastructure and improving customer service; and |
These increases were partially offset, above all, by (i) the reduction
of R$298.6 million in the result of sectoral financial assets and liabilities (CVA), mainly reflecting the reduction in costs with sectoral
charges and financial components; (ii) the decrease of R$ 152.4 million in revenue from the supply of electricity, basically due to the
lower average price in the sale of energy and the lower performance of Copel GeT's wind complexes; and (iii) the decrease of R$48.4 million
in "other operating revenues", mainly due to the lower fair value in the purchase and sale of energy (mark-to-market) of Copel
Mercado Livre.
Operating Income Breakdown
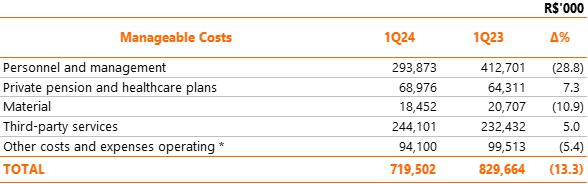
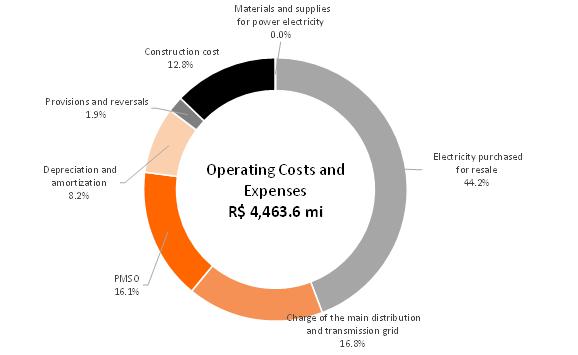
1.3 Operating Costs and Expenses
In 1Q24, operating costs and expenses from continuing operations
totaled R$4,463.6 million, an increase of 6.8% compared to R$4,180.1 million in 1Q23, mainly due to:
| (i) | the growth of R$ 152.5 million with electricity purchased for resale (+8.4%) basically as a result of
higher costs within the distributor with the increase of 71.7% (+R$ 178.8 million) in the financial compensation of energy from distributed
generation systems and growth of 3.2% (+R$ 30.1 million) in expenses with energy contracted in the regulated environment (CCEARs), partially
offsetting the reductions of R$48.4 million with bilateral contracts and R$33.7 million with acquisitions in the short-term market (MCP)
of CCEE; |
| (ii) | the increase of R$97.1 million with provisions and reversals, mainly the effect of (a) the provision for
doubtful accounts (PCLD) of R$42.3 million in 1Q24 compared to the reversal of R$14.2 million in 1Q23, as a result of the end of the collection
restrictions imposed on the distributor by the COVID-19 pandemic, (b) the partial reversal of impairment generation assets in the
amount of R$36.9 million in 1Q23 (R$1.2 million in 1Q24), and (c) the increase of R$4.8 million with provisions for litigation in civil
lawsuits, mainly; |
| (iii) | the increase of R$ 71.6 million (+10.6%) with "charges for the use of the electric grid" justified,
mainly, by higher costs with the transportation of energy in the basic grid; and |
| (iv) | the growth of R$ 11.7 million with third-party services, basically due to higher costs with maintenance
of the electrical system (a) within the scope of the distributor, mainly due to the greater number of interventions in the grid due to
inclement weather, and (b) within the scope of Copel GeT, as a result of the increase of R$ 8.4 million in expenses with maintenance of
wind farms (Cutia and Vilas, mostly). |
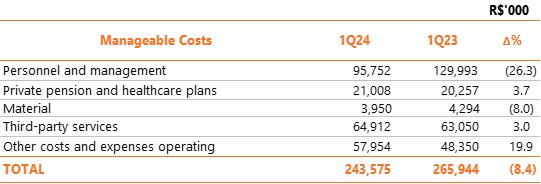
These increases were partially offset by the reduction of 13.3%
(R$110 million) in manageable costs (PMSO), mainly due to (i) a reduction of R$118.8 million in personnel expenses for managers, resulting
from the indemnity of R$138.2 million related to the bonus of the additional third of vacation paid in January 2023, after a collective
bargaining agreement signed with employees. This compensatory indemnity replaced the benefit of additional vacation allowance, dealt with
in previous Collective Bargaining Agreements. The indemnity ceased the payment of this benefit, and only the constitutional third of vacation
was preserved for the employees (CF, 7th, XVII); and (ii) a decrease of R$5.4 million in the "other operating costs and expenses"
line, due, especially, to the higher recovery of taxes and disposal of assets within the scope of the distributor. Reductions partially
offset by the growth of R$ 11.7 million with third-party services, basically due to higher costs with maintenance of the electric system
within the distributor, due to the greater amount of bad weather, and within the scope of Copel GeT, due to the increase of R$ 8.4 million
in expenses with maintenance of wind farms.
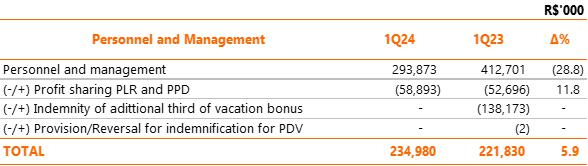
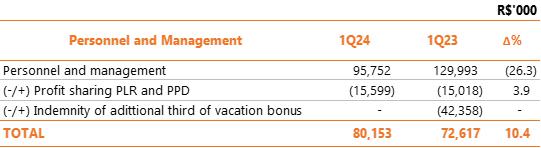
Neutralizing the effects of the severance pay for the additional
third of vacation and the provisions related to profit sharing (PLR) and performance bonus (PPD), there was an increase of 5.9% in expenses
with personnel and managers, in line with the salary recomposition for the period provided for in the collective bargaining agreement
and in the Company's compensation policy.
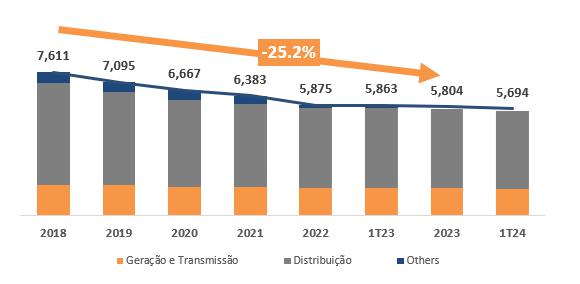
Evolution of the establishment plan
Breakdown of Costs and Expenses
It is worth mentioning that the company, in 2023, changed the
way in which the item "monetary update on provisions for litigation" is accounted for, which is no longer recorded in the line
of provisions and reversals and is now part of financial expenses. More information can be found in Note 28.1 to our Financial Statements.
1.4 Equity in Earnings of Subsidiaries
The equity result of Copel's jointly controlled projects and
other affiliates decreased by R$ 22.4 million compared to the same period of the previous year (R$ 81.6 million, compared to R$ 104.1
million recorded in 1Q23), as a result of the lower remuneration on transmission contract assets, basically explained by the lower inflation
(IPCA) in 1Q24 (1.42%) compared to 2.09% in 1Q23. More details can be viewed in Annex I.
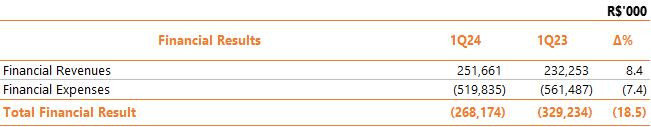
1.5 Financial Result
In 1Q24, the financial result was negative at R$ 268.2 million,
compared to negative R$ 329.2 million recorded in 1Q23, reflecting an improvement of 18.5%.
Financial revenues increased by R$19.4 million, mainly due
to the higher income from investments, mainly due to the higher volume of cash resources.
Financial expenses decreased by R$41.6 million, mainly due
to the decrease of R$39.9 million due to monetary variation and debt charges, due to lower interest rates in the period.
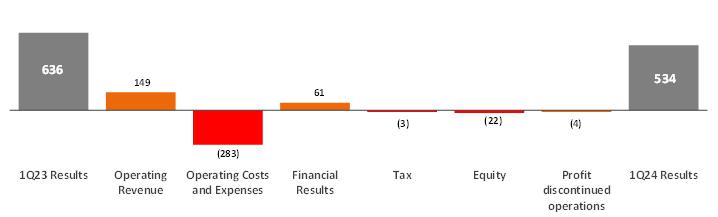
1.6 Consolidated Net Income
In 1Q24, considering discontinued operations, Copel recorded
net income of R$ 533.5 million, compared to R$ 635.5 million in 1Q23 (a decrease of 16.0%). In addition to the items already mentioned,
the growth of R$ 33.2 million in the item "depreciation and amortization" contributed to the reduction in the result, mainly
due to the investment cycle of Copel Distribuição and the entry, as of January 30, 2023, of assets associated with the Aventura
and Santa Rosa & Mundo Novo Wind Complexes.
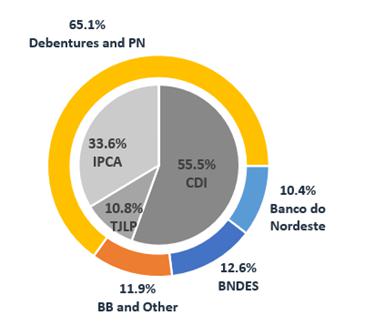
1.7 Debt
Copel's total consolidated debt, considering the result of continuing
operations, totaled R$15,046.5 million on March 31, 2024, a change of 0.6% compared to the amount recorded on December 31, 2023, of R$14,962.3
million.
At the end of 1Q24, the Company's gross indebtedness represented 60.9%
of consolidated shareholders' equity, which was R$24,725.3 million.
The following table and graphs show the indebtedness of Copel and its
subsidiaries at the end of the first quarter of 2024.
Debt by Subsidiary
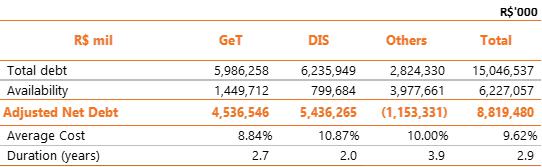
Note: the Company has at Availability the amount of R$ 2.0 billion
related to the funding in the Primary Offering of Shares for the payment of the Grant Bonus for the renewal of the concessions of the
FDA, Segredo and Salto Caxias plants.
Adjusted Net Debt/Adjusted EBITDA

Debt Indexes
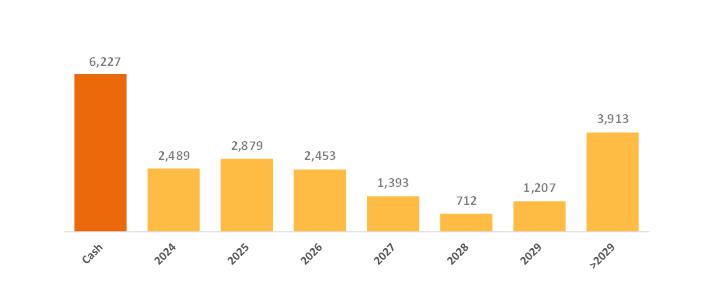
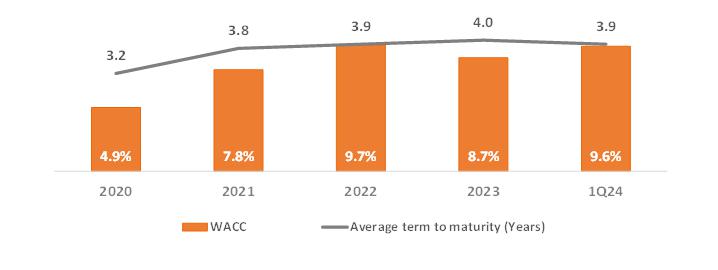
Average cost: 9.62%
Amortization - R$ million
Average Term: 3.9 years
Weighted Average Cost and Average Term
Copel's consolidated debt at the end of the first quarter of 2024, considering
Compagas' 4th issuance of simple debentures in July 2023 in the current amount of R$ 265.0 million, totaled R$ 15,311.5 million.
2. Investments
2.1 Investment Policy
In March 2021, the Board of Directors approved the Company's Investment
Policy. This Policy was analyzed and approved by the Investment and Innovation Committee, which was established by the new Bylaws of March
11, 2021, whose main purpose is to improve discipline in capital allocation, being an essential tool for the execution of strategic guidelines
for sustainable growth, shareholder value generation and continuity of our energy business.
The Policy establishes the criteria for the selection, prioritization,
evaluation, approval and monitoring of investments. Among the various aspects, the Policy segregates investment opportunities into three
groups that will be prioritized as follows:
| (i) | Operational Investments: capacity expansion and modernization of the assets of the Distribution, Transmission
and Generation concessions, in addition to the continuity of existing businesses; |
| (ii) | Strategic Investments: acquisition and development of new assets with emphasis on greenfield and
brownfield opportunities that provide operational synergies to the Company. Includes portfolio review and divestments; and |
| (iii) | Investments in Innovation: where we highlight projects aimed at open innovation. |
The Investment and Innovation Committee meets ordinarily once a
month and extraordinarily whenever necessary, analyzing and issuing recommendations for the Company's investment proposals.
2.2 Investment Program
The Investment Programs follow their schedules in each development
project. In 1Q24, the amount realized in the investment program was R$ 592.0 million, of which R$ 534.6 million was realized by Copel
Distribuição, R$ 33.9 million by Copel Geração e Transmissão (Generation and Transmission),
R$ 22.6 million by Copel Serviços and others and R$ 0.9 million by Copel Holding and Copel Mercado Livre.
The investments made at Copel Distribuição aim to
expand and automate the electrical infrastructure in the concession area, mainly through the Paraná Trifásico, Smart Grid
and Total Reliability programs (see item 4.2.4). Of the amount allocated per quarter, 91.9% was allocated to investments in electrical
assets (net of special obligations), 5.7% to investments in non-electrical assets and 2.4% to other investments.
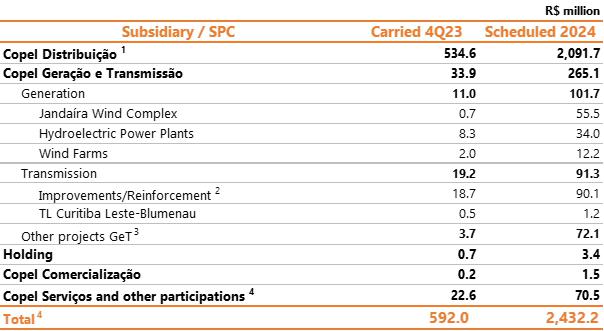
1 Includes the "Transformação"
program comprising the Paraná Trifásico, Rede Elétrica Inteligente and Confiabilidade Total.
2 Includes Facility Modernization Plan - PMI.
3 Includes modernization of the GOC (Generation Operations
Center), investments in substations/transmission lines and other projects.
4 Includes innovation plan in the energy sector and
aligned with the investment thesis, Copel's innovation programs and ESG practice.
3. Copel Geração e Transmissão
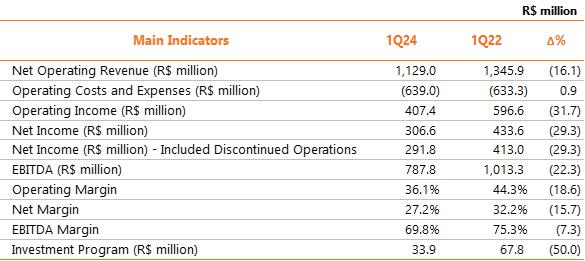
3.1 Financial Performance
Copel GeT presented an adjusted EBITDA of R$686.4 million, an amount
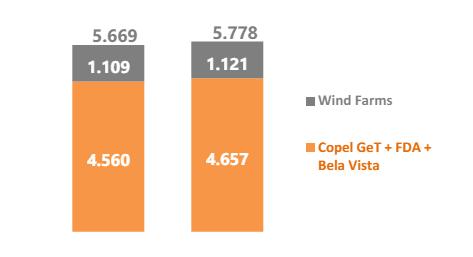
17.2% lower than the R$829.5 million recorded in 1Q23. This result mainly reflects the reduction in revenue from “Electricity sales
to distributors” by R$ 160.5 million, due to (i) lower average energy price for 2024 of R$ 174.86 compared to R$ 205.98 in 1Q23
, despite the increase in energy sold (5,778 GWh in 1Q24 compared to 5,669 GWh in 1Q23); and (ii) increase in generation diversion in
wind complexes, with an increase in revenue frustration of R$49.1 million; partially offset by (iii) increase in energy sold in regulated
auctions (CCEARs) with full incorporation in the quarter of Complexes Aventura and Complexo SR&MN (+R$30.7 million) and increase of
R$10.3 million, with the start of supply in the ACR of the Vilas Wind Complex and PCH Bela Vista.
Lower remuneration on transmission contract assets also contributed
to the result, with a reduction of R$32.4 million in Copel GeT's “use of the main distribution and transmission grid”, mainly
due to the periodic tariff review applied to contracts and lower inflation in comparison between periods (IPCA of 1.42% in 1Q24 compared
to 2.09% in 1Q23). Item 3.1.1 presents the regulatory accounting of results for the purpose of verifying the IFRS (International Financial
Reporting Standards) effect on transmission assets.
Additionally, an increase in costs with the acquisition of “electricity
purchased for resale” was recorded by R$ 11.8 million, essentially a consequence of the lower performance of wind farms.
Regarding non-recurring items in 1Q24, a partial reversal of impairment
of generation assets in the amount of R$1.2 million was recorded, essentially from UHE GPS.
Expenses with PMSO, excluding provisions and reversals, decreased
by 8.4%, influenced by:
| (i) | lower costs with "personnel and administrators" of R$ 34.2 million, mainly justified by the
non-recurring record in 1Q23 (-R$ 42.4 million), referring to the additional third of vacation bonuses; |
This reduction was partially offset by:
| (i) | an increase of R$ 1.9 million in expenses with "third-party services", mainly due to the maintenance
costs of the wind farms; |
| (ii) | the increase in "Other operating costs and expenses" by 19.9%, mainly due to the increase in
costs with financial compensation for the use of CFURH water resources (+R$ 5.4 million) and payment of property tax and municipal contributions
(+R$ 2.3 million), mainly due to adjustments approved by the municipalities. |
Neutralizing the effects of provisions relating to PLR, PPD and
Indemnity, there is a 10.4% increase in personnel and managers costs in the quarterly comparison, justified mainly by the salary recovery
in
2023, in accordance with the collective agreement and salary policy,
and the lower amount of labor allocated to fixed assets, given the lower volume of works at Copel GeT.
Net income with discontinued operations was R$291.8 million in 1Q24,
compared to R$413.0 million in 1Q23, a reduction of 29.3% when comparing the quarters. This result reflects, in addition to the items
discussed previously, (a) the growth of (+R$ 16.9 million) in the item “depreciation and amortization”, mainly due to the
incorporation of the Aventura and SR&MN Wind Complexes (+R$ 7 .1 million); the reduction of R$53.2 million in the financial result
deficit, resulting from the lower amount of debt and the lower CDI; and (c) lower expenditure on income tax and social contribution.
3.1.1 IFRS Effect on the Transmission Segment
3.2 Operational Performance application
of CPC 47 / IFRS 15 on the corporate statements in the transmission segment.
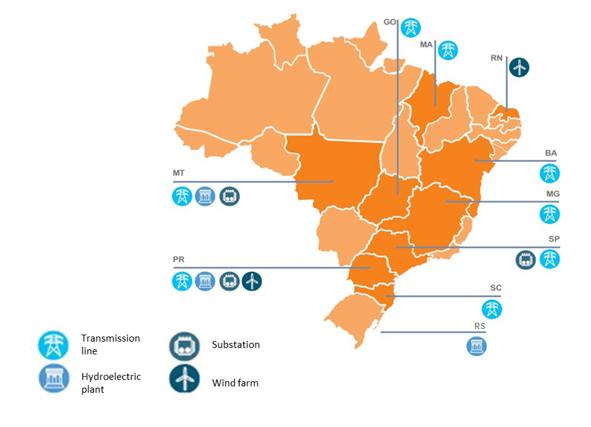
| 3.2 Operacional Performance |
Copel is present in 10 states, operating in the generation and transmission
segments.
In the Generation business, Copel GET operates a diversified park
of hydroelectric, wind and thermal power plants, totaling 6,966.7 MW of installed capacity and 3,156.6 average MW of physical guarantee.
In the Transmission segment, Copel has a total grid of 9,685 km of transmission line and 53 basic grid substations, considering the stakes.
For more information on generation and transmission operational
data, see Annex IV.
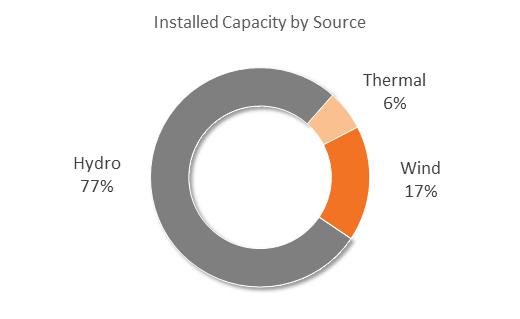
3.2.1 Generation
Copel's
generating complex is composed of 94% renewable sources such as hydro and wind.
3.2.2 Hydro and Wind Generation
The power generation of Copel Geração e Transmissão
S.A. and its wind farms in 1Q24 was 6,639 GWh (compared to 6,430 GWh in 1Q23). The increase is mainly due to the acquisition of the Aventura
and SRMN wind complexes, which became part of the Copel group as of February 2023. In relation to the energy sold in 1Q24, Copel GeT's
hydropower plants (including the Foz do Areia HPP and Bela Vista SHP) recorded an increase of 2.1% and the wind farms recorded an increase
of 1.1%, mainly due to the increase in energy sold in regulated auctions (CCEARs) by the Aventura and SR&MN Wind Complexes.
3.2.3 Thermal Generation
Araucária TPP
It is a natural gas-fired generation plant with an installed capacity
of 484.2 MW that operates in a combined cycle (two gas turbines and one steam turbine) and operates in the so-called "merchant"
modality in which the plant operates without contracts for the sale of electricity, either in the free environment (ACL) or regulated
(ACR), subject to fluctuations in the Price for Settlement of Differences – PLD. In this modality, the thermoelectric plant is centrally
dispatched by the National Electric System Operator (ONS), in situations where the Marginal Cost of Operation (CMO) of the electric system
exceeds its Unit Variable Cost (CVU) approved by ANEEL, or out of the merit order, when requested by the ONS. For the Araucária
TPP, which is in the process of being divested by Copel, there was no dispatch in 1Q24, due to hydrological conditions.
Thermal Power Plant Figueira
On February 23, 2024, Aneel's
Technical Inspection Superintendence (SFT), through Order No. 561/2024, authorized the suspension of the commercial operation of the generating
unit – UG1 of the Figueira TPP. Copel has also formalized with the granting authority the withdrawal of the request for extension
of the concession of the asset and is awaiting a statement from the Ministry of Mines and Energy. The thermoelectric plant with 20 MW
of installed power, powered by coal, does not have current power supply contracts. This claim is another step in Copel's strategic plan
to decarbonize its power generation portfolio.
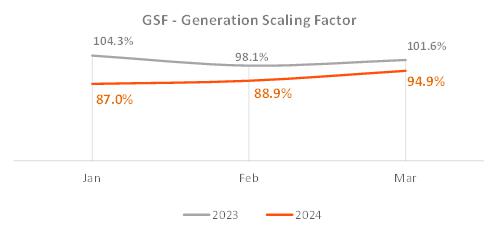
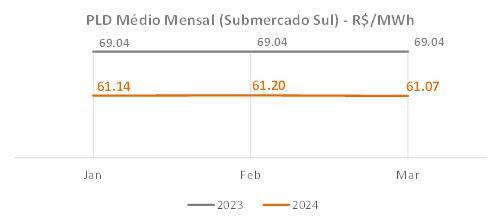
In 1Q24, generation
was 3.0 GWh.
GSF and PLD
3.3 Transmission
Copel has more than 9,600 km of transmission lines in eight
Brazilian states, considering its own assets and in partnership with other companies. In addition to building, maintaining and operating
its own extensive energy transmission grid, Copel provides services to projects of other concessionaires with the quality of those who
have accumulated 69 years of experience in the sector. The Transmission projects are listed in Annex IV, including the projects of Copel
Geração e Transmissão (Copel Generation and Transmission), West Coast SPEs, Marumbi and Uirapuru Transmissora (100%
Copel GeT), as well as the 7 SPEs in which Copel GeT has a stake.
3.3.1 RBSE Reprofiling
Concession Agreement 060/2001 represents 42.5% of Copel GET's annual
permitted transmission revenue (RAP), also considering the shareholdings. Below, we describe the flow of receipt of the portion of the
Revenue related to the Basic Grid of the Existing System – RBSE for the next cycles. It is important to note that they may be changed
in the future, as a result of the tariff review processes and/or review of parameters used to compose these revenues by the regulatory
body. The values referring to O&M from the 2023-2024 cycle were adjusted by the IPCA.
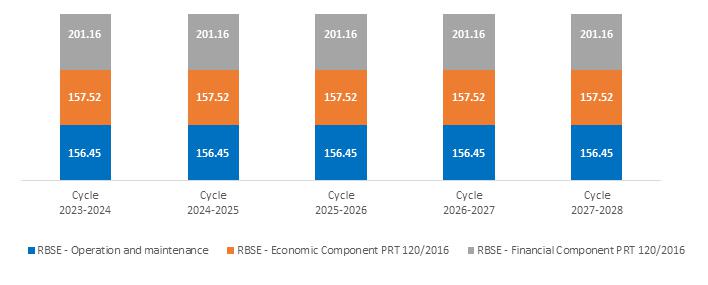
Note:
Economic component: future values based on the 2023-2024 cycle (according
to REH 3,216/2023 of 06/30/2023)
Financial component: values published in REH 2,847/21. Subject to revision
during the current cycle in view of the controversy in the methodology used to calculate these values by the regulatory agency.
RAP values up to the 2023-2024 cycle taken from the REH of each cycle, with
cycle price reference (June of the year of publication)
| 4. Copel Distribuição |
| 4.1 Financial Performance |
Copel Distribuição
posted adjusted EBITDA, excluding VNR, of R$ 616.7 million in 1Q24, an increase of 27.9% due to: (i) the 7.9% growth in the billed
wire market, mainly due to higher temperatures (see item 4.2.1), (ii) the tariff adjustment
in June 2023, with an average increase of 6.32% in the Distribution System Use Tariffs (TUSD), and (iii) the increase of 4.5% (R$ 5.1
million) in other operating revenues, due to the increase in pole-sharing contracts and their contractual adjustment by the IGP-M.
These gains were partially offset by the increase of R$63.6 million
in provisions, mainly (i) the provision for doubtful debts (PCLD) of R$39.5 million in 1Q24 compared to a reversal of R$15.4 million in
1Q23, as a result of the recovery of invoices due to the end of the charging restrictions imposed on the distributor due to the COVID-19
pandemic in that period, and (ii) the increase of R$8.7 million (26.3%) in provisions for litigation, mainly civil and administrative.
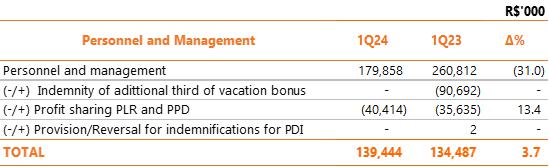
Manageable costs (PMSO) showed a reduction of 19.0%, mainly reflecting
(i) the 31.0% reduction in personnel and management costs, due to the incidence of the additional one-third vacation allowance of R$ 90.7
million in 1Q23, (ii) the 58.3% decrease in other operating costs and expenses, essentially related to the recovery of taxes (+R$12.2
million) and gains from the deactivation of assets and rights (+R$ 6.4 million), influenced by the sale of land; and (iii) the 12.6% reduction
in material costs, mainly due to the reduction in IT costs and fuel and vehicle parts; partially offset by the 4.2% increase in third-party
services, mainly caused by higher expenses with maintenance of the electrical system, due to increased rainfall, incidences of bad weather
and contractual adjustments.
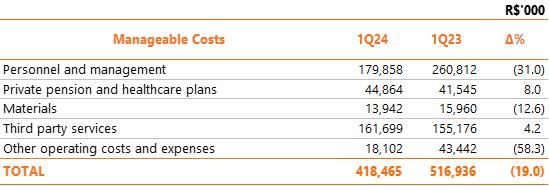
The personal account and management
account, excluding the indemnity of the additional third of vacation and the effects of the provision of PPD and PLR, recorded an increase
of 3.7%, due to the salary adjustment for the period provided for in the collective agreement and salary policy.
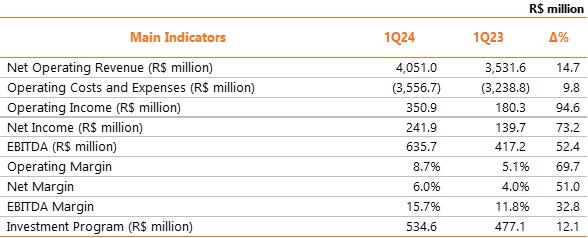
Copel Distribuição's
net income in 1Q24 was R$ 241.9 million, an increase of 73.2%, due to higher operating results, mainly due to the improvement in operating
results due to the growth of the billed wire market and TUSD's tariff adjustment, partially offset by a 27.0% reduction in financial revenues.
The following are the main indicators of Copel Distribuição:
In 1Q24, the following also stand out:
| (i) | the 27.8% growth in revenue from “use of the main distribution and transmission grid” (TUSD),
due to the 7.9% growth in the billed wire market, which considers compensated energy from Mini and Micro Distributed Generation –
MMGD, and the tariff adjustment of June 2023, with an average effect of a 6.32% increase in tariffs for the use of the distribution system
(TUSD). Also contributing to this growth was the reduction of R$ 26.0 million in the Energy Development Account – CDE, a reduction
account for the item, which constitutes a sectoral liability in the CVA to maintain the neutrality of the charges for the distributor; |
| (ii) | the 31.3% increase in “electricity sales to final customers” revenue, due to the 7.7% increase
in the billed captive market, valued by the average effect of a 17.4% increase in the Energy Tariff (TE) component in the 2023 tariff
adjustment; |
| (iii) | the 88.5% reduction in revenue from “electricity sales to distributors”, due to lower revenue
from the settlement of energy in CCEE's Short-Term Market; |
| (iv) | negative R$ 54.4 million in 1Q24 (compared to positive R$ 244.6 million in 1Q23) in the item “result
of sectorial financial assets and liabilities”, due to the constitution of financial components (overcontracting and neutrality); |
| (v) | the increase of 14.1% in the costs of “charge of the main distribution and transmission grid”,
due to higher expenses with: charges for the use of the basic grid (+R$ 99.2 million), due to the adjustment of the RAP, power transportation
from Itaipu (+R$ 22.2 million), due to the increase in the tariff, and charges for System Services – ESS (+R$ 9.0 million), due
to additional thermal dispatch for the electrical safety of the system, partially offset by the reduction of R$33.0 million in Reserve
Energy Charges; and |
| (vi) | the 11.9% increase in the costs of energy purchased for resale, mainly due to the increase of 75.6% (R$
178.8 million) with the Compensation System, as a result of the 55.0% increase in the volume of energy compensated from MMGD, valued by
the average effect of a 17.4% increase in the Energy Tariff (TE) component, and the increase of 3.4% (R$ 31.9 million) in expenses with
electricity from ANEEL auctions, partially offset by a 37.6% reduction (R$ 30.6 million) in expenses with electricity purchased in CCEE's
Short-Term Market. |
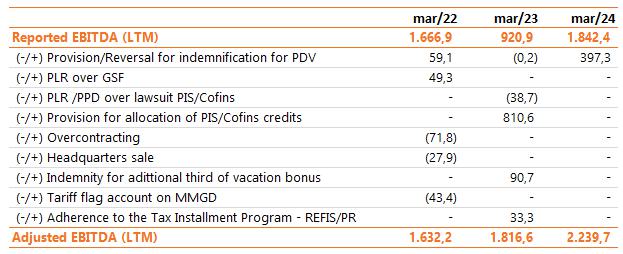
4.1.1 Regulatory Efficiency
Copel Distribuição recorded adjusted EBITDA of R$
2,239,7 million in the last 12 months, equivalent to an efficiency of R$ 573,8 million, 34,4% above the regulatory EBITDA.
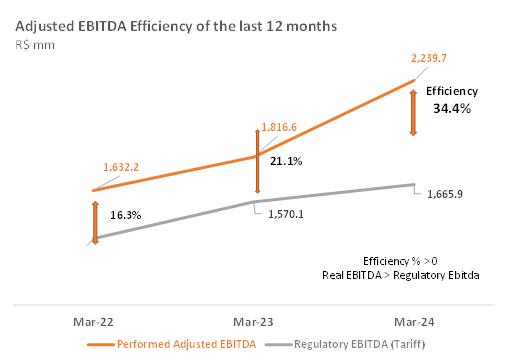
Note: Regulatory EBITDA is calculated based on the WACC
values on Remuneration Base + Special Obligations + LPLT/RGR, and QRR published in ANEEL Technical Notes in Tariff Revision or Adjustment
events.
4.2 Operacional Performance
4.2.1 Grid Market (TUSD)
Copel Distribuição's wire market, made up of the captive
market, the supply to concessionaires and permissionaires within the State of Paraná and all the free consumers existing in its
concession area, had an increase of 10.3% in electricity consumption in the 1Q24 compared to the same period of the previous year, mainly
due to higher temperatures. The billed wire market, which considers offset energy from Mini and Micro Distributed Generation – MMGD,
increased 7.9% in the quarter.
4.2.2 Captive Market
The captive market showed an increase of
11.7% in electricity consumption in 1Q24 compared to the same period of the previous year. The billed captive market, which considers
energy offset from MMGD, increased by 7.7% in the quarter.
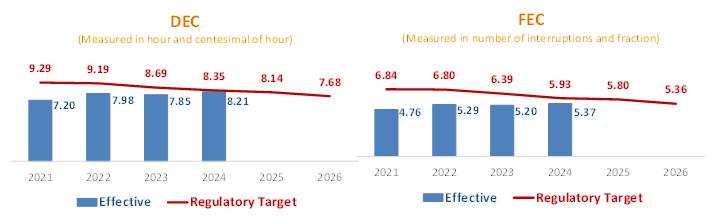
4.2.3 Concession Agreement
In December 2015, the Company signed the fifth amendment to the
Public Service Concession Agreement for the Distribution of Electric Energy No. 46/1999 of Copel Distribuição S.A., which
extends the concession until July 7, 2045. Copel Distribuição complied with the conditioning requirements of economic-financial
efficiency and quality for the inspection cycle of the initial 5 years. From the sixth year following the conclusion of the contract,
non-compliance with the quality criteria for three consecutive years or economic and financial management for two consecutive years implies
the opening of the forfeiture process. For the criterion of quality of distribution service provision, ANEEL defined the limits of Equivalent
Duration of Interruption per Consumer Unit (DEC) and Equivalent Frequency of Interruption per Consumer Unit (FEC) for the years 2021 to
2026. For the DEC, the result for the last 12 months calculated in March 2024 was 8.21 hours. For the FEC, the result in the same period
was 5.27 interruptions.
The criterion of efficiency of economic and financial management
will be measured by the calculation, each calendar year, according to ANEEL Normative Resolution No. 896/2020, by the following inequality:
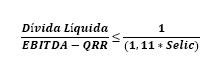
4.2.4 Investment and Operational Data
Transformation Program - a broad investment plan aimed at
modernizing, automating and renewing the distribution grid and private communication grid with standardized technologies to serve automation
equipment. Among the expected benefits are the reinforcement of rural grids to reduce disconnections and ensure support for the growth
of agribusiness in the State of Paraná, reduction of costs with O&M and commercial services and improvement in the control
of the indicators of Equivalent Duration of Interruption per Consumer Unit - DEC and Equivalent Frequency of Interruption per Consumer
Unit - FEC. The program consists of 3 pillar projects to achieve the objectives:
• Paraná Three-Phase:
represents the improvement and renewal of rural distribution grids in the Company's concession area, with the implementation of a three-phase
grid and the creation of redundancy in the main rural branches. By the end of March 2024, 16,286 km of grid had been built.
• Smart Grid: aims
to implement a private communication grid with standardized technology to serve all distribution grid automation equipment and advanced
metering infrastructure. By the end of March 2024, 703,617 smart meters had been installed. In phase 1 of the program, advances were identified
for our operation, with the reduction of man-hours and km driven, fewer non-technical losses, improvement in quality and reduction of
compensations, with estimated benefits in the order of R$ 49 million/year.
• Total Reliability:
aims to ensure modernity in the operations of the energy grid based on the following premises: maintain full communication between teams
and the availability of equipment in the grid, implement automation in special equipment, maintain the entire municipality of the concession
with a substation or special key and expand grid circuits and equipment Self Healing. By the end of March 2024, the project had
completed 85.36% of the planned schedule.
The Transformation Program covers the construction of approximately
25,000 km of new grids, 15,000 new automated points and the implementation of smart grid technology in the state of Paraná.
Compact and Protected Grids - deployment of compact grids
predominantly in urban areas with a high degree of afforestation in the vicinity of distribution grids and protected grids exclusively
in rural areas. Compact grids prevent tree cutting and pruning and improve the quality of supply by reducing the number of shutdowns.
Protected nets also improve the quality and reliability of the system, as they prevent interruptions due to contact with vegetation or
other objects and inclement weather. At the end of March 2024, the length of the compact and protected grids installed was 29,051 km,
compared to 24,135 km in March 2023, an increase of 4,916 km, or 20.36% in twelve months.
Isolated Secondary Grid - investment in isolated secondary
grids at low voltage (127/220V), which have significant advantages over the conventional overhead grid, such as: improving DEC and FEC
indicators; making energy theft more difficult; improving environmental conditions; reducing pruning areas; increasing safety; reducing
voltage drop along the grid; increasing the useful life of transformers by reducing the number of short circuits in the grid, among others.
At the end of March 2024, the length of isolated secondary distribution grids installed was 23,028 km, compared to 22,105 km in March
2023, an increase of 923 km, or 4.17% in twelve months.
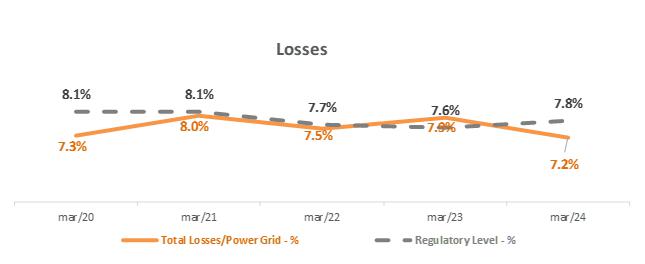
Losses - Losses are related to electricity that circulates
through transmission lines and distribution grids, but is not sold, due to technical or commercial reasons. Distribution losses can be
defined as the difference between the electricity purchased by distributors and the electricity billed to their consumers, being segmented
as "technical" and "non-technical". Technical Losses are inherent to the activity of electricity distribution and
occur due to its dissipation during the process of transport, voltage transformation and measurement as a result of the laws of physics.
Historically, the Company's Technical Losses have maintained percentages close to or below the regulatory target. At the end of March
2024, Technical Losses in the last 12 months were 2,170.9 GWh, compared to 2,041.6 GWh in March 2023.
On the other hand, Non-Technical Losses, calculated by the difference
between total losses and technical losses, originate mainly from theft (clandestine connection, direct diversion of the grid), fraud (meter
tampering or deviations), reading, measurement and billing errors. These losses are largely associated with the management of the concessionaire
and the socioeconomic characteristics of the concession areas. In this sense, the Company maintains a Program to Combat Non-Technical
Losses, which consists of several actions aimed at reducing or maintaining the current level of non-technical losses, through the following
actions:
ü
Improvement of actions to combat irregular procedures;
ü
Investments aimed at the provision and/or acquisition of equipment for inspection;
ü
Elaboration and execution of specific training related to commercial losses;
ü
Conducting inspections, both in Medium and Low Voltage;
ü
Educational notes in the press and messages on the electricity bill.
ü
Joint operations with the Civil Police and the Public Prosecutor's Office;
ü
Opening of a police investigation in the regions where significant numbers of irregular procedures were found.
At the end of March 2024, Non-Technical Losses in the last 12 months
were 534.8 GWh, compared to 752.4 GWh in March 2023. It is worth highlighting that the targets established for the reasonable tariff for
Non-Technical Losses take into account the level of complexity of the distributor's concession area and, according to the Aneel Report
on Electricity Losses in Distribution 2023, the complexity index of Copel Distribuição's concession is one of the lowest
compared to other concessionaires in Brazil. At the
end of March 2024, Total Losses were 2,705.8 GWh, compared to 2,794.0
GWh in March 2023. In terms of classification, Total Losses were made up of 80.2% Technical Losses and 19.8% of Non-Technical Losses.
| GWh - 12 Months |
Mar/20 |
Mar/21 |
Mar/22 |
Mar/23 |
Mar/24 |
| Injected Energy |
32,954 |
33,075 |
34,861 |
35,285 |
37,519 |
| Distribution Losses |
2,403 |
2,636 |
2,627 |
2,794 |
2,706 |
| Technical Losses |
1,993 |
2,000 |
2,017 |
2,042 |
2,171 |
| Non-Technical Losses |
410 |
636 |
610 |
752 |
535 |
* Losses
reflect the difference between the measured load and the billed market. In 2020, with the onset of the Covid-19 pandemic, cargo suffered
a rapid retraction and the market did not respond at the same speed, due to the mismatch between the measurement schedule and the consumer
billing calendar, reducing the volume of losses in this period.
The tariff pass-through of efficient loss levels is provided for
in the concession contracts and these losses are included in the energy purchase costs up to the regulatory limit stipulated by ANEEL.
Despite the total losses presenting percentages marginally above the regulatory one, the methodology for regulatory calculation uses the
invoiced market and within this methodology, no loss glosses were calculated for Copel Distribuição in the annual tariff
adjustment cycles of 2022 and 2023.
5. Copel Mercado Livre
5.1
Financial Performance
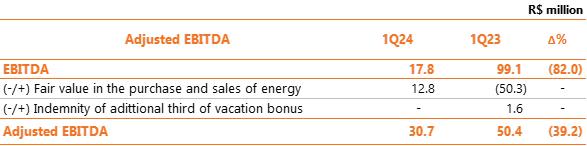
Copel Mercado Livre posted adjusted EBITDA of R$30.7 million in
1Q24, 39.2% lower than in 1Q23, mainly due to the reduction in revenues from the sale of electricity, the reduction in margins from the
sale of energy and the increase of R$0.8 million (+162.5%) in provisions for litigation and doubtful accounts. Considering the non-recurring
effects2 listed below, EBITDA reached R$17.8 million, a reduction of 82.0% compared to the same period of the previous year,
mainly due to the reasons indicated above and, mainly, due to the entry of customers into the base and the increase in the sensitivity
of delinquency given by the credit risk rate with an effect on the mark-to-market.
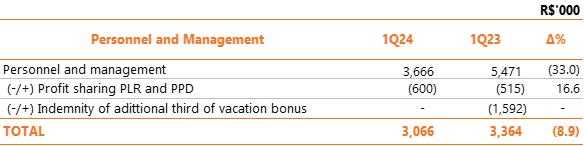
Manageable costs, excluding provisions and reversals, reduced
14.7% compared to 1Q23, mainly as a result of the 33.0% reduction in personnel and administrator costs, due to the incidence of compensation
for the additional third of vacations in 1Q23, of R$1.6 million, partially offset by the 48.6% increase in third-party services, mainly
due to the increase in expenses with communication, processing and data transmission, and 22.1% with other operating costs and expenses,
due to the increase in advertising and advertising expenses with projects to support social development and sport through tax incentives,
which have no impact on the result and still contribute to the brand's exposure and positioning strategy.

The personal and management costs, excluding the incidence
of compensation for the additional third of vacation and the PLR and PPD effects, recorded a reduction of 8.9% in 1Q24, even without changes
in the number of employees and the salary adjustment of 4.51% in October 2023. Considering the accumulated inflation measured by the National
Consumer Price Index – INPC, of 3.40% between 1Q23 and 1Q24, the personnel and administrators cost line recorded a reduction in
real terms of 11.9%.
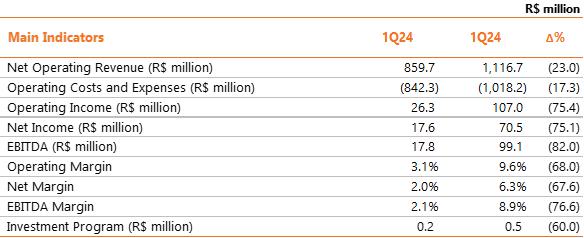
Copel Mercado Livre's net income in 1Q23 was R$ 17.6 million,
a reduction of 75.1%, due to the lower operating result justified previously, partially offset by the financial result with increased
revenue from financial investments (+R $0.2 million) and late payment charges on invoices (+R$0.1 million). Below, the main indicators
of Copel Mercado Livre:
2
The main non-recurring item for COPEL Mercado Livre is the fair value of the power purchase and sale agreements (mark-to-market) - an
amount calculated by the difference between the contracted price and the future market price estimated by the Company - mainly as a result
of the execution of contracts that left the base and the increase in the sensitivity of default given by the credit risk rate.
5.2 Operacional Performance
Copel was a pioneer in creating an energy trader and the first to
sell energy to free consumers, when this category was created in the country, in 1995. Copel Mercado Livre, created in 2016, is among
the largest in the country in terms of energy volume sold in a free contracting environment, offering more savings and peace of mind for
customers in all regions of Brazil.
For a long time known as Copel Energia, Copel Mercado
Livre is responsible for selling energy and providing services in the ACL. In March 2024, the Company registered 1,487 customers/contracts,
a reduction of 12.0% compared to the same period of the previous year. The amount of energy sold reached 6,042 GWh sold in 1Q24, an increase
of 2.5% compared to the same period of the previous year. The graph below depicts the evolution of Copel Mercado Livre in terms of quantity
of GWh sold and number of consumers.

6. Performance ESG
6.1 Copel pioneers in ESG in the sector
Copel was the 1st company in the sector to produce an Environmental
Impact Report for a generation project, and the 1st company in the energy sector in Brazil to become a signatory to the UN Global Compact
in 2000. The Company promotes actions for the dissemination of the UN 2030 Agenda and the implementation of the SDGs in the electricity
sector. Copel adhered to the "Pact for Water and Energy Resilience" Commitment and also received the Pro-Gender and Race Equity
Seal from the Federal Government. The Company received the Pro-Ethics Seal, 2018-2019 and 2020-2021 editions, granted by CGU and the ETHOS
Institute, for the voluntary adoption of integrity measures, with public recognition for the commitment to implement measures aimed at
the prevention, detection and remediation of acts of corruption and fraud. Copel participates in the 100% Transparency Movement of the
UN Global Compact, the first and largest initiative to promote corporate transparency in Brazil.
6.2 Recent Highlights
| § | Copel achieved an A- rating of the CDP Disclosure Insight Action, formerly known as the Carbon Disclosure
Project, reinforcing its commitment to ESG. |
| § | For the 18th time, Copel is in the ISE B3 – Corporate Sustainability Index portfolio, ranking among
the 15 best-placed companies in the general ranking and 4th in the Brazilian Electricity Sector; |
| § | Copel promoted the SDG in Practice Seminar, with the purpose of disseminating Copel's practices in relation
to the SDGs, the event was attended by the company's senior leadership, including the board of directors and members of the Boards, as
well as employees, suppliers and partners. |
| § | Copel signed the Share Purchase and Sale agreement related to its equity interest in UEG Araucária
S.A. ("UEGA"), in line with the decarbonization process of the generation matrix and adhering to Copel's Corporate Strategic
Planning – Vision 2030, strengthening the pillars for the continuity and sustainable growth of the business. |
| |
§ |
Copel concluded its 2023 materiality process, where 10 material topics were defined, namely: Corporate Governance; Economic and financial
performance; Customer satisfaction; Environmental commitment; Social Commitment; People Management; Well-being, health and safety for
the workforce; Transformation of the energy sector; Security of the population; Sustainable Supplier Management. For the first time,
the Company also carried out the double materiality, that is, it worked on the ESG and financial analysis together, strengthening its
corporate strategy. |
| |
§ |
For the first time, Copel carried out the Double Materiality process, which crosses the perception of stakeholders on the topics that
the Company should prioritize, with the financial impacts of these topics on the business. The themes were united in ten groups, highlighting
the entry of "Population Security" and "Sustainable Management of Suppliers". Nevertheless, the stakeholder consultation
was one of the largest ever undertaken by the company. |
| |
§ |
The transformation of Copel into a Corporation led to the revision of several Corporate Policies, Regulations and Bylaws, keeping the
Company's Governance in line with the best practices in the market. |
| § | For the second consecutive year, the Company participated as a partner in "Empowering Refugees"
in Curitiba, a UN Women project that aims to increase the employability of migrant women. Copel works on the project mainly through corporate
volunteering. |
| § | Approval of NPC 0303 - Sustainability Policy by Copel's Board of Directors, concentrating in a single
standard all matters related to sustainability. |
Environmental
| § | It has a Copel 2030 Neutrality Plan, approved by the Board of Directors: focusing on science-based targets
(SBTi), with the purpose of neutralizing Scope 1 Greenhouse Gas (GHG) Emissions, for the assets that Copel has operational control over (according
to the concept established in the GHG Protocol methodology) by 2030; |
| |
§ |
Net Zero Ambition Movement – Copel joined the Net Zero Ambition Movement. The movement is part of the strategies developed by the
Global Compact so that large companies together can promote actions that result in the reduction of greenhouse gases by 2030; |
| |
§ |
It is part of the Brazilian Business Commitment to Biodiversity with the Brazilian Business Council for Sustainable Development (CEBDS). |
Social
| |
§ |
Actions and Programs – Solidary Selective Collection; Cultivate Energy Program; Electricidania; Good Neighbor Program; Diversity
Commission; Human rights; EducaODS; Enlightening Generations; More than Energy, among others. |
| |
§ |
It reformulated its Sustainability Policy, which now includes corporate policies on Human Rights, Stakeholder Engagement, Private Social
Investment, Climate Change, Biodiversity and Environmental. |
| |
§ |
It has a Policy, People Management, Occupational Health and Safety, among others. |
Governance
| |
§ |
It has statutory advisory committees to the Board of Directors: Statutory Audit Committee - CAE; Statutory Sustainable Development Committee
(CDS), Investment and Innovation Committee (IIC) and People Committee (CDG); |
| § | The Board of Directors is composed mostly of independent members; |
| § | The Statutory Audit Committee (CAE) is made up of independent members, one of whom is an external member; |
| |
§ |
Establishment of Variable Compensation with ESG goals – 2023: 30% of the PPD; |
| |
§ |
Listed in Level 2 of B3's Governance; |
| |
§ |
Review of Corporate Policies for Transactions with Related Parties and Conflict of Interest and Integrity; |
| |
§ |
On 08/11/2023, Copel was transformed into a Corporation. As a result, the company became a company with dispersed capital and no controlling
shareholder. |
| |
§ |
Joined the 100% Transparency Movement of the UN Global Compact; |
Priority SDGs for the Brazilian Electricity Sector

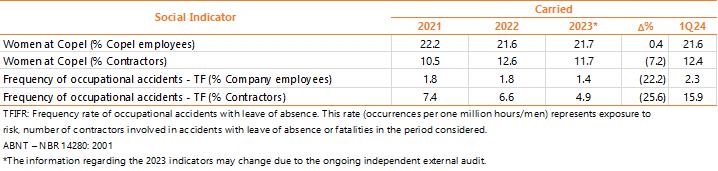
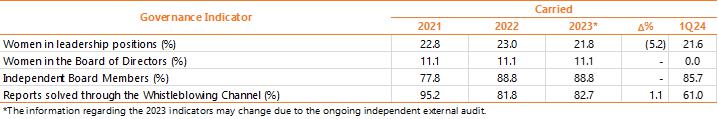
6.3 Indicators
The indicators may change due to the assurance of the independent
external audit.
Regarding the GHG scope 1 indicator (tCO2), the increase recorded
is due to the resumption of the commercial operation of the Figueira TPP, on 12/07/2022, by ANEEL Order No. 2502/2022, with generation
until September 2023. In line with the plan to have a 100% clean generation matrix, in October 2023 the Company filed a letter with the
Ministry of Mines and Energy (MME) requesting the withdrawal of the intention to extend the concession of the Figueira TPP. In February
2024, Aneel decided to suspend commercial operation, and the plant will be hibernated.

6.4 Ratings, Rankings, and Indexes
| Index |
Ranking |
Reference
Year |
 |
15th position
4º in SEB |
2023 |
 |
CSA Score 70 |
2023 |
 |
A- |
2023 |
 |
Sim |
2023 |
 |
Medium Risk |
2023 |
 |
A |
2023 |
7. Other highlights
Available Cash Flow and Dividends
Available Cash Flow is defined in the Dividend Policy as: DCF
= Cash generated by Operating activities, deducted from net cash used by investment activities, being: (a) Cash Generated by Operating
Activities: cash generated by operating activities in the fiscal year , before taxes, contributions (IRCS) and financial charges; (b)
Net cash used by Investment activities: amount invested in the fiscal year in non-current assets. The Table below demonstrates the calculation
of the FCD on March 31, 2024:
R$ mil |
| 03.31.2024 |
| CASH FLOW FROM OPERATIONAL ACTIVITIES |
| CASH GENERATED BY OPERATING ACTIVITIES |
1,326,148 |
| CASH FLOW FROM INVESTMENT ACTIVITIES |
| FROM CONTINUING OPERATIONS |
(564,907) |
| FROM DISCONTINUED OPERATIONS |
(3,721) |
| NET CASH USED FROM INVESTMENT ACTIVITIES |
(568,628) |
| AVAIABLE CASH FLOW “FCD” |
757,520 |
In line with the dividend policy, considering the above DCF
and the leverage level, the 69th Annual General Meeting approved the payment of interest on equity, declared on 09.20.2023, in the amount
of R$ 501.0 million (ex date 09.29.2023), and dividends in the amount of R$ 131.1 million. Both payments will be made on 28.06.2024.
Long-Term Incentive Plan - ILP
The Company's 210th Extraordinary
General Meeting held on April 22, 2024, approved the "Plan for the Granting of Restricted Shares and Performance Shares", which
will be attended by managers and
employees of the Company and its subsidiaries. The Plan managed by the Board of Directors with the support
of the People Committee establishes a dilution limit of up to 1.0% of the Company's total capital stock, up to 0.2% for Restricted Shares
and up to 0.8% for Performance Shares. The ILP consolidates the Company's meritocratic practices for retaining, creating and attracting
talent and represents an important commitment to long-term value creation, strengthening our organizational
culture and reinforcing our commitment to excellence at all levels.
For more information,
see the Plan
for the Granting of Restricted Shares and Performance-Restricted Actions available on
the ri.copel.com website.
Potential Divestment in Small Generation
Assets
In line with the Company's strategic guideline for value generation,
Copel approved the start of the non-binding stage for potential divestment in thirteen (13) small-scale generation assets, focusing its
activities on larger assets. The divestment will enable the reuse of personnel linked to these assets, already trained and qualified,
to replace the professionals who will leave the Company through the Voluntary Dismissal Plan (PDV). With this process, it is possible
to optimize the group's capital allocation, with the improvement of the operational efficiency of the portfolio of Copel Geração
e Transmissão S.A.
For more information, see Material
Fact 03/2024.
Copel partners with Google Cloud
In line with the Company's
strategic planning and vision of the future, Copel has entered into a partnership with Google and will migrate its Information Technology
("IT") services to Google Cloud, as a strategic measure for significant advances in operational efficiency and economies of
scale. With the Google Cloud platform, the Company will enhance strategic decisions based on data analysis, artificial intelligence and
machine learning tools, with integration with existing analytical systems, enabling more competitiveness and agility in the development
of the energy generation, transmission, distribution and trading businesses, from asset management and operation to customer service.
This partnership reinforces our commitment to excellence, information security and the continuous search for innovative solutions for
business sustainability and value creation.
Copel's CVC Fund invests in start-up aimed
at market opening and DG
Through FIP Copel Ventures
I, the Company's Corporate Venture Capital (CVC) fund, Copel made its second investment, now in a solar energy market place startup
, with integration between Distributed Generation ("DG") and end consumers. R$ 11.0 million was allocated and the investment
aims to advance in an innovative solution, with a view to simplifying access to clean energy through a digital platform, which connects
the consumer to the renewable energy project through a subscription service. The move is in line with the strategic commitment to be recognized
by customers for its offer of innovative and digital services that generate value for all its stakeholders.
Replacement of independent audit
As of the revision of the 1Q24
quarterly information, PricewaterhouseCoopers Auditores Independentes (PwC) will provide the independent audit service of the financial
statements of Copel and its wholly-owned subsidiaries until the end of the 2028 fiscal year, replacing Deloitte Touche Tohmatsu Auditores
Independentes ("Deloitte"). The hiring aims to comply with governance practices and the recommendation of the Statutory Audit
Committee ("CAE") to rotate independent auditors before the maximum period required in article 31-A of CVM Resolution No. 23/21.
The Company would like to thank Deloitte for the services rendered,
which were fundamental for the solid, complete and transparent construction of the financial-accounting records.
Copel GeT creates a system that prevents
environmental accidents at a power plant
The Company's technical team
developed an oil separation and containment system in the turbine cover of the hydroelectric plant's generating units, avoiding contamination
of the river in case of leaks. The environmentally relevant proposal is to take advantage of the immiscible physical properties
of the oil accumulated on the surface of the water to separate it using a "T" shaped tube, open at the ends. The system is installed
at the Governador José Richa plant and is capable of retaining approximately 10,000 liters of oil in the event of a leak from bearings,
servo motors and reservoirs. Once retained, this oil can be pumped into suitable storage containers and disposed of properly.
Project
sponsored by Copel rescues the history of Brazilian women writers erased from literary records
Between April and July, students
from municipal and state schools in the municipalities of Colombo, Pinhais and Almirante Tamandaré receive free cultural activities
from the “Anônimas” project, which aims to rescue the stories of female writers of Brazilian literature who were excluded
from cultural memory and literary analyses. The project is sponsored by Copel via the State Program for the Promotion and Incentive of
Culture (PROFICE) and reinforces the commitment to sustainability and gender equality linked to SDG 5, aiming to establish a fair and
inclusive representation of women and their stories.
Disclaimer
Informações contidas neste documento podem incluir
considerações futuras e refletem a percepção atual e perspectivas da diretoria sobre a evolução
do ambiente macroeconômico, condições da indústria, desempenho da Companhia e resultados financeiros. Quaisquer
declarações, expectativas, capacidades, planos e conjecturas contidos neste documento, que não descrevam fatos históricos,
tais como informações a respeito da declaração de pagamento de dividendos, a direção futura
das operações, a implementação de estratégias operacionais e financeiras relevantes, o programa de
investimento, os fatores ou tendências que afetem a condição financeira, liquidez ou resultados das operações
são considerações futuras de significado previsto no “U.S. Private Securities Litigation Reform Act”
de 1995 e contemplam diversos riscos e incertezas. Não há garantias de que tais resultados venham a ocorrer. As declarações
são baseadas em diversos fatores e expectativas, incluindo condições econômicas e mercadológicas, competitividade
da indústria e fatores operacionais. Quaisquer mudanças em tais expectativas e fatores podem implicar que o resultado real
seja materialmente diferente das expectativas correntes.
| |
Relações com Investidores
ri@copel.com
Telefone: (41) 3331-4011 |
| Exhibit I - CONSOLIDATED RESULTS > INCOME STATEMENT |
| |
|
|
|
|
|
R$ '000 |
| Income Statement |
|
|
|
1Q24 |
1Q23 |
Δ% |
| |
|
| OPERATING REVENUES |
|
|
|
5,416,998 |
5,267,557 |
2.8 |
| Electricity sales to final customers |
|
|
|
2,205,465 |
1,904,159 |
15.8 |
| Electricity sales to distributors |
|
|
|
740,230 |
892,664 |
(17.1) |
| Use of the main distribution and transmission grid |
|
|
|
1,805,284 |
1,496,218 |
20.7 |
| Construction revenue |
|
|
|
573,647 |
528,369 |
8.6 |
| Fair value of assets from the indemnity for the concession |
|
|
|
18,970 |
25,734 |
(26.3) |
| Result of Sectorial financial assets and liabilities |
|
|
|
(54,417) |
244,226 |
(122.3) |
| Other operating revenues |
|
|
|
127,819 |
176,187 |
(27.5) |
| OPERATING COSTS AND EXPENSES |
|
|
|
(4,463,552) |
(4,180,130) |
6.8 |
| Electricity purchased for resale |
|
|
|
(1,973,467) |
(1,820,975) |
8.4 |
| Charge of the main distribution and transmission grid |
|
|
|
(748,074) |
(676,458) |
10.6 |
| Personnel and management |
|
|
|
(293,873) |
(412,701) |
(28.8) |
| Pension and healthcare plans |
|
|
|
(68,976) |
(64,311) |
7.3 |
| Materials and supplies |
|
|
|
(18,452) |
(20,707) |
(10.9) |
| Materials and supplies for power eletricity |
|
|
|
(936) |
(6,716) |
(86.1) |
| Third-party services |
|
|
|
(244,101) |
(232,432) |
5.0 |
| Depreciation and amortization |
|
|
|
(364,628) |
(331,415) |
10.0 |
| Provisions and reversals |
|
|
|
(86,021) |
11,088 |
- |
| Construction cost |
|
|
|
(570,924) |
(525,990) |
8.5 |
| Other cost and expenses |
|
|
|
(94,100) |
(99,513) |
(5.4) |
| EQUITY IN EARNINGS OF SUBSIDIARIES |
|
|
|
81,643 |
104,088 |
(21.6) |
| PROFIT BEFORE FINANCIAL RESULTS AND TAXES |
|
|
|
1,035,089 |
1,191,515 |
(13.1) |
| FINANCIAL RESULTS |
|
|
|
(268,174) |
(329,234) |
(18.5) |
| Financial income |
|
|
|
251,661 |
232,253 |
8.4 |
| Financial expenses |
|
|
|
(519,835) |
(561,487) |
(7.4) |
| OPERATIONAL EXPENSES/ INCOME |
|
|
|
766,915 |
862,281 |
(11.1) |
| INCOME TAX AND SOCIAL CONTRIBUTION ON PROFIT |
|
|
|
(234,725) |
(232,131) |
1.1 |
| Income tax and social contribution on profit |
|
|
|
(146,666) |
(144,504) |
1.5 |
| Deferred income tax and social contribution on profit |
|
|
|
(88,059) |
(87,627) |
0.5 |
| NET INCOME continuing operations |
|
|
|
532,190 |
630,150 |
(15.5) |
| NET INCOME discontinued operations |
|
|
|
1,353 |
5,340 |
(74.7) |
| NET INCOME |
|
|
|
533,543 |
635,490 |
(16.0) |
| Attributed to the controlling company's shareholders - continuing operations |
|
|
|
539,198 |
630,553 |
(14.5) |
| Attributed to the controlling company's shareholders - discontinued operations |
|
|
|
(7,815) |
(3,963) |
97.2 |
| Attributed to non-controlling shareholders - continuing operations |
|
|
|
(1,513) |
177 |
- |
| Attributed to non-controlling shareholders - discontinued operations |
|
|
|
3,673 |
8,723 |
(57.9) |
| EBITDA continued operations |
|
|
|
1,399,717 |
1,522,930 |
(8.1) |
| Exhibit I - CONSOLIDATED RESULTS > BALANCE SHEET |
| R$'000 |
|
R$'000 |
| Assets |
Mar-24 |
Dec-23 |
Δ% |
|
Liabilities |
Mar-24 |
Dec-23 |
Δ% |
| CURRENT |
13,686,398 |
13,715,730 |
- 0.2 |
|
CURRENT |
9,845,753 |
9,309,433 |
5.8 |
| Cash and cash equivalents |
5,789,893 |
5,634,623 |
2.8 |
|
Payroll, social charges and accruals |
946,974 |
927,538 |
2.1 |
| Bonds and securities |
2,779 |
4,763 |
(41.7) |
|
Suppliers |
2,156,716 |
2,154,430 |
0.1 |
| Collaterals and escrow accounts |
9 |
9 |
- |
|
Income tax and social contribution payable |
45,269 |
132,979 |
(66.0) |
| Customers |
3,850,298 |
3,761,170 |
2.4 |
|
Other taxes due |
308,288 |
346,083 |
(10.9) |
| Dividends receivable |
85,046 |
95,569 |
(11.0) |
|
Loans and financing |
1,145,446 |
675,980 |
69.4 |
| Sectorial financial assets |
- |
15,473 |
- |
|
Debentures |
1,344,004 |
1,225,649 |
9.7 |
| Account receivable related to concession |
9,751 |
9,354 |
4.2 |
|
Minimum compulsory dividend payable |
464,137 |
464,147 |
(0.0) |
| Contract Assets |
278,515 |
284,616 |
(2.1) |
|
Post employment benefits |
96,705 |
85,833 |
12.7 |
| Other current receivables |
767,182 |
949,732 |
(19.2) |
|
Customer charges due |
62,816 |
61,466 |
2.2 |
| Inventories |
193,391 |
174,726 |
10.7 |
|
Research and development and energy efficiency |
295,811 |
320,196 |
(7.6) |
| Income tax and social contribution |
345,916 |
315,218 |
9.7 |
|
Accounts Payable related to concession |
101,098 |
101,976 |
(0.9) |
| Other current recoverable taxes |
857,093 |
943,343 |
(9.1) |
|
Net sectorial financial liabilities |
423,955 |
476,103 |
(11.0) |
| Prepaid expenses |
65,231 |
62,869 |
3.8 |
|
Lease liability |
52,717 |
49,742 |
6.0 |
| Related parties |
804 |
1,336 |
(39.8) |
|
Other accounts payable |
1,051,243 |
859,456 |
22.3 |
| Assets held for sale |
1,440,490 |
1,462,929 |
(1.5) |
|
PIS and COFINS to be refunded to costumers |
773,259 |
558,591 |
38.4 |
| NON-CURRENT |
41,774,591 |
42,103,344 |
(0.8) |
|
Provision for allocation of Pis and Cofins credits |
64,628 |
- |
- |
| Long Term Assets |
15,865,529 |
16,343,437 |
(2.9) |
|
Provisions for litigation |
- |
336,000 |
- |
| Bonds and securities |
520,894 |
490,732 |
6.1 |
|
Liabilities associated with assets held for sale |
512,687 |
533,264.0 |
(3.9) |
| Other temporary investments |
42,133 |
31,728 |
32.8 |
|
NON-CURRENT |
20,889,972 |
22,317,974 |
(6.4) |
| Customers |
94,832 |
105,259 |
(9.9) |
|
Suppliers |
131,143 |
131,143 |
- |
| Judicial deposits |
390,398 |
634,712 |
(38.5) |
|
Deferred income tax and social contribution |
1,704,968 |
1,686,793 |
1.1 |
| Sectoral financial assets |
- |
15,473 |
- |
|
Other taxes due |
334,765 |
612,093 |
(45.3) |
| Account receivable related to concession |
2,957,737 |
2,809,901 |
5.3 |
|
Loans and financing |
4,112,616 |
4,667,237 |
(11.9) |
| Contract Assets |
7,308,842 |
7,320,445 |
(0.2) |
|
Debentures |
8,444,473 |
8,393,457 |
0.6 |
| Other non-current receivables |
658,013 |
853,340 |
(22.9) |
|
Post employment benefits |
1,396,498 |
1,398,410 |
(0.1) |
| Income tax and social contribution |
61,704 |
68,003 |
(9.3) |
|
Research and development and energy efficiency |
254,478 |
233,478 |
9.0 |
| Deferred income tax and social contribution |
1,687,771 |
1,757,688 |
(4.0) |
|
Accounts Payable related to concession |
781,093 |
791,879 |
(1.4) |
| Other non-current recoverable taxes |
2,143,205 |
2,256,156 |
(5.0) |
|
Net sectorial financial liabilities |
93,797 |
27,888 |
236.3 |
| Investments |
3,507,535 |
3,511,797 |
(0.1) |
|
Lease liability |
246,138 |
220,700 |
11.5 |
| Property, plant and equipment, net |
10,717,791 |
10,825,421 |
(1.0) |
|
Other accounts payable |
395,667 |
579,070 |
(31.7) |
| Intangible assets |
11,404,490 |
11,170,089 |
2.1 |
|
PIS and COFINS to be refunded to costumers |
- |
173,135 |
- |
| Right to use an asset |
279,246 |
252,600 |
10.5 |
|
Provision for allocation of Pis and Cofins credits |
1,846,131 |
1,909,775 |
(3.3) |
| TOTAL |
55,460,989 |
55,819,074 |
(0.6) |
|
Provisions for litigation |
1,148,205 |
1,492,916 |
(23.1) |
| |
|
|
|
|
EQUITY |
24,725,264 |
24,191,667 |
2.2 |
| |
|
|
|
|
Attributed to controlling shareholders |
24,417,580 |
23,886,153 |
2.2 |
| |
|
|
|
|
Share capital |
12,821,758 |
12,821,758 |
- |
| |
|
|
|
|
Equity valuation adjustments |
299,005 |
307,050 |
(2.6) |
| |
|
|
|
|
Legal reserves |
1,625,628 |
1,625,628 |
- |
| |
|
|
|
|
Retained earnings |
9,000,506 |
9,000,506 |
- |
| |
|
|
|
|
Proposed additional dividend |
131,211 |
131,211 |
- |
| |
|
|
|
|
Accrued earnings |
539,472 |
- |
- |
| |
|
|
|
|
Attributable to non-controlling interest |
307,684 |
305,514 |
0.7 |
| |
|
|
|
|
TOTAL |
55,460,989 |
55,819,074 |
(0.6) |
| Exhibit I - CONSOLIDATED RESULTS > CASH FLOW |
| |
|
R$'000 |
| |
03/31/24 |
12/31/23 |
| CASH FLOWS FROM OPERATIONAL ACTIVITIES |
| |
|
|
| Net income from continuing operations |
532,190 |
630,150 |
| |
|
|
| Adjustments to reconcile net income for the period with cash generation from operating activities: |
1,018,166 |
376,229 |
| Unrealized monetary and exchange variation and debt charges - net |
471,223 |
419,656 |
| Interest - bonus from the grant of concession agreements under the quota system |
(33,051) |
(36,944) |
| Remuneration of transmission concession contracts |
(202,886) |
(238,365) |
| Income tax and social contribution |
146,666 |
144,504 |
| Deferred income tax and social contribution |
88,059 |
87,627 |
| Equity in earnings of investees |
(81,643) |
(104,088) |
| Appropriation of post-employment benefits obligations |
66,582 |
66,794 |
| Creation for research and development and energy efficiency programs |
43,343 |
40,203 |
| Recognition of fair value of assets from the indemnity for the concession |
(18,970) |
(25,734) |
| Sectorial financial assets and liabilities result |
59,964 |
(269,120) |
| Depreciation and amortization |
364,628 |
331,415 |
| Net operating estimated losses, provisions and reversals |
86,021 |
(11,088) |
| Realization of added value in business combinations |
(181) |
(181) |
| Fair value in energy purchase and sale operations |
12,839 |
(50,291) |
| Loss on disposal of accounts receivable related to concession |
84 |
30 |
| Loss on disposal of contract assets |
3,533 |
2,834 |
| Loss on disposal of property, plant and equipment |
2,169 |
729 |
| Loss on disposal of intangible assets |
9,837 |
18,252 |
| Result of write-offs of use rights of assets and liabilities of leases - net |
(51) |
(4) |
| |
|
|
| Decrease (increase) in assets |
130,477 |
108,739 |
| Trade accounts receivable |
98,897 |
97,329 |
| Dividends and interest on own capital received |
59,208 |
5,860 |
| Judicial deposits |
(1,081) |
11,724 |
| Sectorial financial assets |
(15,444) |
13,796 |
| Other receivables |
(7,045) |
(45,682) |
| Inventories |
(18,665) |
(23,359) |
| Income tax and social contribution recoverable |
(59,822) |
(5,395) |
| Other taxes recoverable |
76,665 |
64,605 |
| Prepaid expenses |
(2,768) |
(9,844) |
| Related parties |
532 |
(295) |
| |
|
|
| Increase (decrease) in liabilities |
(354,685) |
(112,292) |
| Payroll, social charges and accruals |
57,677 |
40,189 |
| Suppliers |
(28,011) |
(197,927) |
| Other taxes |
106,928 |
218,766 |
| Post-employment benefits |
(57,622) |
(55,942) |
| Sectorial charges due |
1,350 |
(4,150) |
| Research and development and energy efficiency |
(51,961) |
(29,894) |
| Payable related to the concession |
(27,481) |
(29,049) |
| Other accounts payable |
(298,679) |
19,470 |
| Provisions for legal claims |
(56,886) |
(73,755) |
| |
|
|
| CASH GENERATED BY OPERATING ACTIVITIES |
1,326,148 |
1,002,826 |
| |
|
|
| Income tax and social contribution paid |
(234,376) |
(186,716) |
| Loans and financing - interest due and paid |
(152,206) |
(166,072) |
| Debentures - interest due and paid |
(122,975) |
(142,569) |
| Charges for lease liabilities paid |
(7,121) |
(5,387) |
| |
|
|
| NET CASH GENERATED BY OPERATING ACTIVITIES FROM CONTINUING OPERATIONS |
809,470 |
502,082 |
| NET CASH GENERATED BY OPERATING ACTIVITIES FROM DISCONTINUED OPERATIONS |
(30,354) |
38,108 |
| NET CASH GENERATED FROM OPERATING ACTIVITIES |
779,116 |
540,190 |
| |
|
|
| CASH FLOWS FROM INVESTMENT ACTIVITIES |
| Financial investments |
(38,549) |
(45,638) |
| Additions to contract assets |
(522,376) |
(504,383) |
| Acquisitions of subsidiaries - effect on cash |
- |
(912,139) |
| Additions in investments |
- |
(10,780) |
| Capital reduction of investees |
37,129 |
- |
| Additions to property, plant and equipment |
(38,355) |
(34,907) |
| Additions to intangible assets |
(2,756) |
(2,044) |
| |
|
|
| NET CASH USED BY INVESTMENT ACTIVITIES FROM CONTINUING OPERATIONS |
(564,907) |
(1,509,891) |
| NET CASH USED BY INVESTMENT ACTIVITIES FROM DISCONTINUED OPERATIONS |
(3,721) |
(3,824) |
| NET CASH USED FROM INVESTING ACTIVITIES |
(568,628) |
(1,513,715) |
| |
|
|
| CASH FLOWS FROM FINANCING ACTIVITIES |
| Issue of debentures |
- |
1,300,000 |
| Transaction costs in the issuing of debentures |
- |
(11,325) |
| Payments of principal - loans and financing |
(66,375) |
(59,216) |
| Payments of principal - debentures |
(5,862) |
(5,688) |
| Amortization of principal of lease liabilities |
(17,047) |
(16,655) |
| Dividends and interest on own capital paid |
(9) |
(45) |
| |
|
|
| NET CASHGENERATED (USED) BY FINANCING ACTIVITIES FROM CONTINUING OPERATIONS |
(89,293) |
1,207,071 |
| NET CASH GENERATED (USED)BY FINANCING ACTIVITIESFROM DISCONTINUED OPERATIONS |
(19,299) |
(729) |
| NET CASH GENERATED (USED) FROM FINANCING ACTIVITIES |
(108,592) |
1,206,342 |
| |
|
|
| TOTAL EFFECTS ON CASH AND CASH EQUIVALENTS |
101,896 |
232,817 |
| |
|
|
| Cash and cash equivalents at the beginning of the period |
5,634,623 |
2,678,457 |
| Cash and cash equivalents at the end of the period |
5,789,893 |
2,751,672 |
| Change in cash and cash equivalents from discontinued operations |
(53,374) |
159,602 |
| |
|
|
| CHANGE IN CASH AND CASH EQUIVALENTS |
101,896 |
232,817 |
Exhibit I - CONSOLIDATED RESULTS > ADJUSTED EBITDA
AND FINANCIAL RESULT
|
| |
|
|
|
R$'000 |
| |
|
|
|
1Q24 |
1Q23 |
Δ% |
| EBITDA FROM CONTINUING OPERATIONS |
|
|
|
1,399.7 |
1,522.9 |
(8.1) |
| (-/+) Fair value in the purchase and sale of energy |
|
|
|
12.8 |
(50.3) |
- |
| (-/+) Provision/Reversal of asset impairment |
|
|
|
(1.2) |
(36.9) |
- |
| (-/+) Indemnity of adittional third of vacation bonus |
|
|
|
- |
138.2 |
- |
| Adjusted EBITDA FROM CONTINUING OPERATIONS |
|
|
|
1,411.4 |
1,573.9 |
(10.3) |
| (-) Ebitda from discontinued Op. Compagas and UEGA |
|
|
|
21.1 |
44.0 |
(52) |
| Adjusted EBITDA INCLUDED DISCONTINUED OPERATIONS |
|
|
|
1,432.5 |
1,617.8 |
(11.5) |
| (-/+) Equity in earnings of subsidiaries |
|
|
|
-81.6 |
-104.1 |
(21.6) |
| (-/+) VNR |
|
|
|
(19.0) |
(25.7) |
(26.1) |
| (-/+) Revenue Adjustment TRA IFRS/Regulatory |
|
|
|
(2.2) |
(69.3) |
- |
| Adjusted EBITDA INCLUDED DISCONTINUED OP without earnings of subsidiaries, VNR and IFRS effect |
|
|
1,329.7 |
1,418.8 |
(6.3) |
| |
|
|
|
|
|
|
| |
|
|
|
|
|
R$'000 |
| |
|
|
|
1Q24 |
1Q23 |
Δ% |
| Financial Revenues |
|
|
|
251,661 |
232,253 |
8.4 |
| Income from investments held for trading |
|
|
|
156,430 |
92,999 |
68.2 |
| Late fees on electricity bills |
|
|
|
46,900 |
54,593 |
(14.1) |
| Monetary restatement and adjustment to present value of accounts payable related to concession |
|
|
|
16,582 |
7,375 |
124.8 |
| Income from sectorial assets and liabilities |
|
|
|
4,242 |
25,195 |
(83.2) |
| Exchange variation About Purchase Itaipu Electric Power |
|
|
|
1,206 |
3,338 |
(63.9) |
| Interest on taxes to be compensated |
|
|
|
10,108 |
17,315 |
(41.6) |
| Income and monetary restatement of judicial deposits |
|
|
|
9,167 |
15,979 |
(42.6) |
| Other financial revenues |
|
|
|
16,786 |
23,936 |
(29.9) |
| (-) Pis/Pasep and Cofins on revenues |
|
|
|
(9,760) |
(8,477) |
15.1 |
| Financial Expenses |
|
|
|
519,835 |
561,487 |
(7.4) |
| Monetary variation, foreign exchange and debt service charges |
|
|
|
427,021 |
466,949 |
(8.6) |
| Monetary variation of litigation |
|
|
|
16,726 |
- |
- |
| Uptade of provision for allocation of Pis and Cofins credits |
|
|
|
984 |
25,676 |
|
| Monetary variation and adjustment to present value of accounts payable related to concession |
|
|
|
32,399 |
34,825 |
(7.0) |
| Exchange variation About Purchase Itaipu Electric Power |
|
|
|
2,453 |
813 |
201.7 |
| Pis/ Pasep and Cofins taxes over interest on equity |
|
|
|
5,550 |
- |
- |
| Income from sectorial assets and liabilities |
|
|
|
4,429 |
1,605 |
176.0 |
| Interest on R&D and PEE |
|
|
|
5,233 |
7,059 |
(25.9) |
| Interest on tax installments |
|
|
|
7,550 |
10,561 |
(28.5) |
| Interest on lease liabilities |
|
|
|
7,088 |
5,403 |
31.2 |
| Other financial expenses |
|
|
|
10,402 |
8,596 |
21.0 |
| Financial income (expenses) |
|
|
|
(268,174) |
(329,234) |
(18.5) |
|
Exhibit I - CONSOLIDATED RESULTS > EQUITY IN EARNINGS
OF SUBSIDIARIES AND INDICATORS
|
| |
|
|
|
|
|
|
|
R$'000 |
| Variation
in Equity in earnings of subsidiaries |
|
|
|
|
1Q23 |
1Q22 |
Δ% |
| Joint
Ventures |
|
|
|
|
|
77,467
|
98,895
|
(21.7) |
| Voltalia
São Miguel do Gostoso I Participações S.A. |
|
|
|
|
|
(4,238) |
(1,241) |
241.5
|
| Caiuá
Transmissora de Energia S.A. |
|
|
|
|
|
3,417
|
4,056
|
(15.8) |
| Integração
Maranhense Transmissora de Energia S.A. |
|
|
|
|
|
4,991
|
9,450
|
(47.2) |
| Matrinchã
Transmissora de Energia (TP NORTE) S.A. |
|
|
|
|
|
22,374
|
26,949
|
(17.0) |
| Guaraciaba
Transmissora de Energia (TP SUL) S.A. |
|
|
|
|
|
12,906
|
12,092
|
6.7
|
| Paranaíba
Transmissora de Energia S.A. |
|
|
|
|
|
7,986
|
9,352
|
(14.6) |
| Mata
de Santa Genebra Transmissão S.A. |
|
|
|
|
|
17,503
|
22,308
|
(21.5) |
| Cantareira
Transmissora de Energia S.A. |
|
|
|
|
|
12,476
|
15,816
|
(21.1) |
| Solar
Paraná |
|
|
|
|
|
52
|
113
|
(54.0) |
| Associates |
|
|
|
|
|
4,176
|
5,193
|
(19.6) |
| Dona
Francisca Energética S.A. |
|
|
|
|
|
1,480
|
1,032 |
43.4
|
| Foz
do Chopim Energética Ltda. |
|
|
|
|
|
2,698
|
4,162
|
(35.2) |
| Others
¹ |
|
|
|
|
|
(2) |
(1) |
100.0
|
| TOTAL |
|
|
|
|
|
81,643
|
104,088
|
(21.6) |
| 1
Includes Carbocampel S.A. |
|
|
|
|
|
| |
|
|
|
|
|
|
|
|
| |
|
|
|
|
|
|
|
R$'000 |
| Main
Indicators -AssociatesMar-24 |
|
|
|
|
Dona
Francisca |
Foz
do Chopim |
| Total
assets |
|
|
|
|
|
172,397
|
|
44,772
|
| Shareholder’s
equity¹ |
|
|
|
|
|
140,212
|
|
43,098
|
| Net
operating revenue |
|
|
|
|
|
16,651
|
|
11,128
|
| Net
Income |
|
|
|
|
|
6,426
|
|
7,550
|
| Participation
in the enterprise - % |
|
|
|
|
|
23.0
|
|
35.8
|
| Investment
book value |
|
|
|
|
|
32,292
|
|
15,414
|
| |
|
|
|
|
|
|
|
R$'000 |
Main
Indicators -Joint ventures
Mar-24 |
Voltalia |
Caiuá |
Integração
Maranhense |
Matrinchã |
Guaraciaba |
Paranaíba |
Mata
de Santa Genebra |
Cantareira |
| Total
assets |
231,208 |
344,601 |
613,369 |
3,052,717 |
1,641,231 |
2,060,869 |
3,700,258 |
1,845,064 |
| Shareholder’s
equity¹ |
231,111 |
278,552 |
435,407 |
2,076,275 |
1,030,589 |
1,348,397 |
1,348,397 |
981,198 |
| Net
operating revenue |
- |
9,963 |
16,629 |
87,386 |
48,073 |
62,996 |
114,836 |
49,733 |
| Net
Income |
(8,751) |
6,974 |
10,189 |
45,662 |
26,337 |
32,595 |
34,935 |
25,461 |
| Participation
in the enterprise - % |
49.0 |
49.0 |
49.0 |
49.0 |
49.0 |
24.5 |
50.1 |
49.0 |
| Investment
book value |
113,246 |
136,491 |
213,347 |
1,017,373 |
504,989 |
300,008 |
675,547 |
480,787 |
| Note: Income
from Transmitters according to adjustments for the application of CPC 47 / IFRS 15 in the Corporate Statements. |
|
Exhibit I - CONSOLIDATED RESULTS > SHARE CAPITAL
|
| |
|
|
|
|
|
|
|
|
|
| Share Capital -As of March, 31,2024 * |
| |
|
|
|
|
|
|
|
|
Thousand shares |
| Shareholders |
Common |
% |
Preferred "A" |
% |
Preferred "B" |
% |
Special ** |
TOTAL |
% |
| State of Paraná |
358,563 |
27.6% |
- |
- |
116,081 |
6.9% |
<1 |
474,644 |
15.9% |
| BNDESPAR |
131,161 |
10.1% |
- |
- |
524,646 |
31.2% |
- |
655,807 |
22.0% |
| Free Floating |
807,500 |
62.1% |
688 |
22.0% |
1,037,630 |
61.8% |
- |
1,845,818 |
61.9% |
| B3 |
785,782 |
60.4% |
688 |
22.0% |
946,380 |
56.4% |
- |
1,732,850 |
58.1% |
| NYSE |
21,510 |
1.7% |
- |
- |
89,498 |
5.3% |
- |
111,008 |
3.7% |
| LATIBEX |
208 |
0.0% |
- |
- |
1,752 |
0.1% |
- |
1,960 |
0.1% |
| Other |
3,123 |
0.2% |
2,440 |
78.0% |
978 |
0.1% |
- |
6,540 |
0.2% |
| TOTAL |
1,300,347 |
100% |
3,128 |
100% |
1,679,335 |
100% |
<1 |
2,982,810 |
100% |
| * The 209th Extraordinary General Assembly approved the undoing of the UNITS Program, ending in December/23. |
| ** State of Paraná has a special class preferred share with veto power as established in the Statute. |
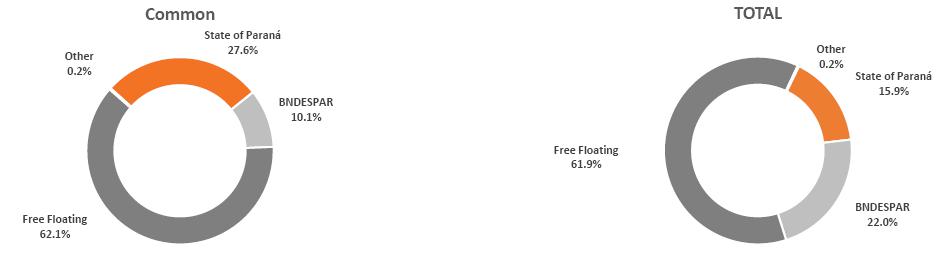
Exhibit II- RESULT BY SUBSIDIARY > COPEL GET (CONSOLIDATED)
|
| |
|
|
|
R$'000 |
| Income Statement |
|
|
|
1Q24 |
1Q23 |
Δ% |
| OPERATING REVENUES |
|
|
|
1,129,000 |
1,345,859 |
(16.1) |
| Electricity sales to final customers |
|
|
|
- |
(9) |
- |
| Electricity sales to distributors |
|
|
|
847,208 |
1,007,682 |
(15.9) |
| Use of the main transmission grid |
|
|
|
260,635 |
293,039 |
(11.1) |
| Construction revenue |
|
|
|
10,899 |
38,392 |
(71.6) |
| Other operating revenues |
|
|
|
10,258 |
6,755 |
51.9 |
| OPERATING COSTS AND EXPENSES |
|
|
|
(639,048) |
(633,298) |
0.9 |
| Electricity purchased for resale |
|
|
|
(29,830) |
(18,017) |
65.6 |
| Charges of main distribution and transmission grid |
|
|
|
(146,482) |
(142,618) |
2.7 |
| Personnel and management |
|
|
|
(95,750) |
(129,993) |
(26.3) |
| Pension and healthcare plans |
|
|
|
(21,008) |
(20,257) |
3.7 |
| Materials and supplies |
|
|
|
(3,947) |
(4,294) |
(8.1) |
| Materials and supplies for power eletricity |
|
|
|
(936) |
(6,716) |
(86.1) |
| Third-party services |
|
|
|
(64,912) |
(63,050) |
3.0 |
| Depreciation and amortization |
|
|
|
(213,497) |
(196,555) |
8.6 |
| Provisions and reversals |
|
|
|
3,444 |
32,565 |
(89.4) |
| Construction cost |
|
|
|
(8,176) |
(36,013) |
(77.3) |
| Other cost and expenses |
|
|
|
(57,954) |
(48,350) |
19.9 |
| EQUITY IN EARNINGS OF SUBSIDIARIES |
|
|
|
84,353 |
104,186 |
(19.0) |
| PROFIT BEFORE FINANCIAL RESULTS AND TAXES |
|
|
|
574,305 |
816,747 |
(29.7) |
| FINANCIAL RESULTS |
|
|
|
(166,934) |
(220,190) |
(24.2) |
| Financial income |
|
|
|
80,529 |
83,792 |
(3.9) |
| Financial expenses |
|
|
|
(247,463) |
(303,982) |
(18.6) |
| OPERATIONAL EXPENSES/ INCOME |
|
|
|
407,371 |
596,557 |
(31.7) |
| INCOME TAX AND SOCIAL CONTRIBUTION ON PROFIT |
|
|
|
(100,804) |
(162,944) |
(38.1) |
| Income tax and social contribution on profit |
|
|
|
(80,565) |
(104,545) |
(22.9) |
| Deferred income tax and social contribution on profit |
|
|
|
(20,239) |
(58,399) |
(65.3) |
| NET INCOME continuing operations |
|
|
|
306,567 |
433,613 |
(29.3) |
| NET INCOME discontinued operations |
|
|
|
(14,783) |
(20,652) |
(28.4) |
| NET INCOME |
|
|
|
291,784 |
412,961 |
(29.3) |
| Attributed to shareholders of the parent company - continuing operations |
|
|
|
310,682 |
434,125 |
(28.4) |
| Attributed to the controlling company's shareholders - discontinued operations |
|
|
|
(11,509) |
(12,888) |
(10.7) |
| Attributed to non-controlling shareholders |
|
|
|
(7,389) |
(8,276) |
(10.7) |
| EBITDA continuing operations |
|
|
|
787,802 |
1,013,302 |
(22.3) |
|
Exhibit II- RESULT BY SUBSIDIARY > COPEL DIS
|
| |
|
|
|
R$'000 |
| Income Statement |
|
|
|
1Q24 |
1Q23 |
Δ% |
| OPERATING REVENUES |
|
|
|
4,050,962 |
3,531,641 |
14.7 |
| Electricity sales to final customers |
|
|
|
1,739,360 |
1,324,337 |
31.3 |
| Electricity sales to distributors |
|
|
|
3,913 |
34,115 |
(88.5) |
| Use of the main distribution grid |
|
|
|
1,663,024 |
1,300,992 |
27.8 |
| Construction revenue |
|
|
|
562,748 |
489,977 |
14.9 |
| Fair value of assets from the indemnity for the concession |
|
|
|
18,970 |
25,734 |
(26.3) |
| Sectorial assets and liabilities result |
|
|
|
(54,417) |
244,226 |
(122.3) |
| Other operating revenues |
|
|
|
117,364 |
112,260 |
4.5 |
| OPERATING COSTS AND EXPENSES |
|
|
|
(3,556,705) |
(3,238,770) |
9.8 |
| Electricity purchased for resale |
|
|
|
(1,639,673) |
(1,464,757) |
11.9 |
| Charges of main transmission grid |
|
|
|
(713,135) |
(625,128) |
14.1 |
| Personnel and management |
|
|
|
(179,858) |
(260,812) |
(31.0) |
| Pension and healthcare plans |
|
|
|
(44,864) |
(41,545) |
8.0 |
| Materials and supplies |
|
|
|
(13,942) |
(15,960) |
(12.6) |
| Third-party services |
|
|
|
(161,700) |
(155,176) |
4.2 |
| Depreciation and amortization |
|
|
|
(141,490) |
(124,363) |
13.8 |
| Provisions and reversals |
|
|
|
(81,192) |
(17,610) |
361.1 |
| Construction cost |
|
|
|
(562,748) |
(489,977) |
14.9 |
| Other cost and expenses |
|
|
|
(18,103) |
(43,442) |
(58.3) |
| PROFIT BEFORE FINANCIAL RESULTS AND TAXES |
|
|
|
494,257 |
292,871 |
68.8 |
| FINANCIAL RESULTS |
|
|
|
(143,317) |
(112,535) |
27.4 |
| Financial income |
|
|
|
84,449 |
115,620 |
(27.0) |
| Financial expenses |
|
|
|
(227,766) |
(228,155) |
(0.2) |
| OPERATIONAL EXPENSES/ INCOME |
|
|
|
350,940 |
180,336 |
94.6 |
| INCOME TAX AND SOCIAL CONTRIBUTION ON PROFIT |
|
|
|
(109,061) |
(40,646) |
168.3 |
| Income tax and social contribution on profit |
|
|
|
(53,350) |
(26,320) |
102.7 |
| Deferred income tax and social contribution on profit |
|
|
|
(55,711) |
(14,326) |
288.9 |
| NET INCOME (LOSS) |
|
|
|
241,879 |
139,690 |
73.2 |
| EBITDA |
|
|
|
635,747 |
417,234 |
52.4 |
|
Exhibit II- RESULT BY SUBSIDIARY > COPEL DIS
|
| |
|
|
|
R$'000 |
| OPERATING REVENUE |
|
|
|
1Q24 |
1Q23 |
Δ% |
| Electricity sales to final customers |
|
|
|
2,093,630 |
1,579,237 |
32.6 |
| Residential |
|
|
|
991,079 |
699,254 |
41.7 |
| Industrial |
|
|
|
172,204 |
162,724 |
5.8 |
| Commercial, service and other activities |
|
|
|
498,825 |
384,312 |
29.8 |
| Rural |
|
|
|
225,850 |
169,952 |
32.9 |
| Public Sector |
|
|
|
74,599 |
52,975 |
40.8 |
| Street lightining |
|
|
|
46,163 |
42,388 |
8.9 |
| Public Service |
|
|
|
84,910 |
67,632 |
25.5 |
| Donations and subsidies |
|
|
|
257,231 |
190,832 |
34.8 |
| Electricity sales to distributors |
|
|
|
4,424 |
35,673 |
(87.6) |
| Bilateral contracts |
|
|
|
6,250 |
4,562 |
37.0 |
| Electricity Trading Chamber - CCEE |
|
|
|
(1,826) |
31,111 |
- |
| Use of the main distribution grid |
|
|
|
3,042,358 |
2,292,648 |
32.7 |
| Residential |
|
|
|
1,061,097 |
742,262 |
43.0 |
| Industrial |
|
|
|
301,789 |
167,087 |
80.6 |
| Commercial, service and other activities |
|
|
|
582,946 |
414,950 |
40.5 |
| Rural |
|
|
|
244,330 |
194,530 |
25.6 |
| Public Sector |
|
|
|
82,643 |
60,578 |
36.4 |
| Street lightining |
|
|
|
50,153 |
47,375 |
5.9 |
| Public Service |
|
|
|
70,327 |
54,299 |
29.5 |
| Free Market |
|
|
|
609,331 |
580,225 |
5.0 |
| Dealers and generators |
|
|
|
39,742 |
31,342 |
26.8 |
| Construction Revenue |
|
|
|
562,748 |
489,977 |
14.9 |
| Fair value of assets from the indemnity for the concession |
|
|
|
18,970 |
25,734 |
(26.3) |
| Sectorial assets and liabilities result |
|
|
|
(59,964) |
269,120 |
(122.3) |
| Other operating income |
|
|
|
129,971 |
124,662 |
4.3 |
| Leases and rentals |
|
|
|
118,308 |
112,858 |
4.8 |
| Income from the provision of services |
|
|
|
1,682 |
1,495 |
12.5 |
| Other income |
|
|
|
9,981 |
10,309 |
(3.2) |
| RECEITA OPERACIONAL BRUTA |
|
|
|
6,049,368 |
5,007,883 |
20.8 |
| (-) Tributos e deduções |
|
|
|
(1,998,406) |
(1,476,242) |
35.4 |
| (-) PIS/PASEP e COFINS |
|
|
|
(432,313) |
(376,231) |
14.9 |
| (-) ICMS |
|
|
|
(816,625) |
(427,464) |
91.0 |
| (-) Encargos Setoriais |
|
|
|
(749,468) |
(672,533) |
11.4 |
| (-) ISS |
|
|
|
- |
(14) |
- |
| NET OPERATING REVENUES |
|
|
|
4,050,962 |
3,531,641 |
14.7 |
|
Exhibit II- RESULT BY SUBSIDIARY > COPEL COM (MERCADO
LIVRE)
|
| |
|
|
|
R$'000 |
| Income Statement |
|
|
|
1Q24 |
1Q23 |
Δ% |
| OPERATING REVENUES |
|
|
|
859,651 |
1,116,652 |
(23.0) |
| Electricity sales to final customers |
|
|
|
466,469 |
580,207 |
(19.6) |
| Electricity sales to distributors |
|
|
|
392,753 |
479,303 |
(18.1) |
| Other operating revenues |
|
|
|
429 |
57,142 |
(99.2) |
| OPERATING COSTS AND EXPENSES |
|
|
|
(842,270) |
(1,018,224) |
(17.3) |
| Electricity purchased for resale |
|
|
|
(833,563) |
(1,008,782) |
(17.4) |
| Personnel and management |
|
|
|
(3,666) |
(5,471) |
(33.0) |
| Pension and healthcare plans |
|
|
|
(452) |
(510) |
(11.4) |
| Materials and supplies |
|
|
|
(17) |
(9) |
88.9 |
| Third-party services |
|
|
|
(745) |
(501) |
48.7 |
| Depreciation and amortization |
|
|
|
(440) |
(714) |
(38.4) |
| Provisions and reversals |
|
|
|
(1,221) |
(465) |
162.6 |
| Other cost and expenses |
|
|
|
(2,166) |
(1,772) |
22.2 |
| PROFIT BEFORE FINANCIAL RESULTS AND TAXES |
|
|
|
17,381 |
98,428 |
(82.3) |
| FINANCIAL RESULTS |
|
|
|
8,962 |
8,547 |
4.9 |
| Financial income |
|
|
|
9,029 |
8,631 |
4.6 |
| Financial expenses |
|
|
|
(67) |
(84) |
(20.2) |
| OPERATIONAL EXPENSES/ INCOME |
|
|
|
26,343 |
106,975 |
(75.4) |
| INCOME TAX AND SOCIAL CONTRIBUTION ON PROFIT |
|
|
|
(8,783) |
(36,471) |
(75.9) |
| Income tax and social contribution on profit |
|
|
|
(12,620) |
(13,638) |
(7.5) |
| Deferred income tax and social contribution on profit |
|
|
|
3,837 |
(22,833) |
(116.8) |
| NET INCOME (LOSS) |
|
|
|
17,560 |
70,504 |
(75.1) |
| EBITDA |
|
|
|
17,821 |
99,142 |
(82.0) |
|
Exhibit II- RESULT BY SUBSIDIARY > INCOME STATEMENT
FOR THE QUARTER BY COMPANY
|
| R$'000 |
| Income
Statement 1Q24 |
GET
|
Distribuição
|
Compagas
|
Elejor
|
UEG
Araucária |
Serviços
|
Wind
Farms |
FDA
|
Bela
Vista |
C.
Oeste, Marumbi, Uirapuru |
Mercado
Livre |
Holding
|
Elimination
|
Consolidated
|
| Geração
|
Transmissão
|
| NET
OPERATING INCOME |
541,578
|
262,229
|
4,050,962
|
198,428
|
24,066
|
-
|
-
|
179,189
|
136,725
|
8,589
|
18,228
|
859,651
|
-
|
(862,647) |
5,416,998
|
| Electricity
sales to final customers |
-
|
-
|
1,739,360
|
-
|
-
|
-
|
-
|
-
|
-
|
-
|
-
|
466,469
|
-
|
(364) |
2,205,465
|
| Electricity
sales to distributors |
526,551
|
-
|
3,913
|
-
|
24,032
|
-
|
-
|
175,625
|
136,722
|
8,589
|
-
|
392,753
|
-
|
(527,955) |
740,230
|
| Use
of the main distribution and transmission grid (TUSD/ TUST) |
-
|
244,443
|
1,663,024
|
-
|
-
|
-
|
-
|
-
|
-
|
-
|
18,760
|
-
|
-
|
(120,943) |
1,805,284
|
| Construction
revenue |
-
|
11,438
|
562,748
|
5,067
|
-
|
-
|
-
|
-
|
-
|
-
|
(539) |
-
|
-
|
(5,067) |
573,647
|
| Fair
value of assets from the indemnity for the concession |
-
|
-
|
18,970
|
-
|
-
|
-
|
-
|
-
|
-
|
-
|
-
|
-
|
-
|
-
|
18,970
|
| Distribution
of piped gas |
-
|
-
|
-
|
193,361
|
-
|
-
|
-
|
-
|
-
|
-
|
-
|
-
|
-
|
(193,361) |
-
|
| Sectoral
assets and liabilities result |
-
|
-
|
(54,417) |
-
|
-
|
-
|
-
|
-
|
-
|
-
|
-
|
-
|
-
|
-
|
(54,417) |
| Other
operating revenues |
15,027
|
6,348
|
117,364
|
-
|
34
|
-
|
-
|
3,564
|
3
|
-
|
7
|
429
|
-
|
(14,957) |
127,819
|
| OPERATING
COSTS AND EXPENSES |
(319,137) |
(76,459) |
(3,556,705) |
(175,082) |
(22,474) |
(22,159) |
(909) |
(148,746) |
(95,450) |
(4,714) |
(1,603) |
(842,270) |
(52,226) |
854,381
|
(4,463,552) |
| Energy
purchased for resale |
(13,978) |
-
|
(1,639,673) |
-
|
(29) |
-
|
-
|
(14,922) |
(1,202) |
(11) |
-
|
(833,563) |
-
|
529,911
|
(1,973,467) |
| Charges
of the main distribution and transmission grid |
(92,252) |
-
|
(713,135) |
-
|
(6,322) |
(9,030) |
-
|
(15,793) |
(40,457) |
(344) |
-
|
-
|
-
|
129,259
|
(748,074) |
| Personnel
and management |
(51,579) |
(39,046) |
(179,858) |
(12,950) |
(1,231) |
(1,450) |
(46) |
(4,185) |
(587) |
(161) |
(197) |
(3,666) |
(13,317) |
14,400
|
(293,873) |
| Private
pension and health plans |
(11,584) |
(8,658) |
(44,864) |
(1,557) |
(42) |
(190) |
(8) |
(624) |
(88) |
(24) |
(30) |
(452) |
(2,602) |
1,747
|
(68,976) |
| Materials
and supplies |
(1,475) |
(879) |
(13,942) |
(209) |
(90) |
(5) |
(16) |
(1,045) |
(501) |
(47) |
-
|
(17) |
(440) |
214
|
(18,452) |
| Materials
and supplies for power eletricity |
(936) |
-
|
-
|
-
|
-
|
(426) |
-
|
-
|
-
|
-
|
-
|
-
|
-
|
426
|
(936) |
| Natural
gas and supplies for gas business |
-
|
-
|
-
|
(137,646) |
-
|
-
|
-
|
-
|
-
|
-
|
-
|
-
|
-
|
137,646
|
-
|
| Third-party
services |
(19,992) |
(13,009) |
(161,700) |
(4,436) |
(3,671) |
(4,986) |
(724) |
(32,446) |
(8,552) |
(827) |
(1,685) |
(745) |
(13,415) |
22,086
|
(244,101) |
| Depreciation
and amortization |
(98,655) |
(4,273) |
(141,490) |
(11,269) |
(8,229) |
(5,158) |
(196) |
(68,426) |
(31,933) |
(2,847) |
(11) |
(440) |
(779) |
9,078
|
(364,628) |
| Provisions
and reversals |
2,437
|
1,153
|
(81,192) |
(275) |
-
|
(175) |
-
|
(44) |
(7) |
(279) |
71
|
(1,221) |
(10,538) |
4,049
|
(86,021) |
| Construction
cost |
-
|
(8,718) |
(562,748) |
(5,067) |
-
|
-
|
-
|
-
|
-
|
-
|
542
|
-
|
-
|
5,067
|
(570,924) |
| Other
operating costs and expenses |
(31,123) |
(3,029) |
(18,103) |
(1,673) |
(2,860) |
(739) |
81
|
(11,261) |
(12,123) |
(174) |
(293) |
(2,166) |
(11,135) |
498
|
(94,100) |
| EQUITY
IN EARNINGS OF SUBSIDIARIES |
11,797
|
98,853
|
-
|
-
|
-
|
-
|
-
|
(14,041) |
-
|
-
|
-
|
-
|
566,383
|
(581,349) |
81,643
|
| EARNINGS
BEFORE INCOME TAXES |
234,238
|
284,623
|
494,257
|
23,346
|
1,592
|
(22,159) |
(909) |
16,402
|
41,275
|
3,875
|
16,625
|
17,381
|
514,157
|
(589,615) |
1,035,089
|
| FINANCIAL
RESULTS |
(79,207) |
(59,404) |
(143,317) |
(11,558) |
(9,837) |
(1,898) |
44
|
(38,923) |
8,520
|
912
|
1,857
|
8,962
|
44,198
|
11,477
|
(268,174) |
| Financial
income |
23,787
|
15,331
|
84,449
|
5,165
|
20,635
|
662
|
204
|
30,101
|
8,680
|
924
|
2,395
|
9,029
|
58,114
|
(7,815) |
251,661
|
| Financial
expenses |
(102,994) |
(74,735) |
(227,766) |
(16,723) |
(30,472) |
(2,560) |
(160) |
(69,024) |
(160) |
(12) |
(538) |
(67) |
(13,916) |
19,292
|
(519,835) |
| OPERATIONAL
EXPENSES / INCOME |
155,031
|
225,219
|
350,940
|
11,788
|
(8,245) |
(24,057) |
(865) |
(22,521) |
49,795
|
4,787
|
18,482
|
26,343
|
558,355
|
(578,138) |
766,915
|
| INCOME
TAX AND SOCIAL CONTRIBUTION ON PROFIT |
(36,961) |
(32,608) |
(109,061) |
(4,461) |
3,202
|
-
|
(120) |
(14,733) |
(16,918) |
(583) |
(1,402) |
(8,783) |
(19,157) |
6,860
|
(234,725) |
| NET
INCOME continuing operations |
118,070
|
192,611
|
241,879
|
7,327
|
(5,043) |
(24,057) |
(985) |
(37,254) |
32,877
|
4,204
|
17,080
|
17,560
|
539,198
|
(571,278) |
532,190
|
| NET
INCOME discontinued operations |
(11,509) |
-
|
-
|
-
|
-
|
-
|
-
|
-
|
-
|
-
|
-
|
-
|
(7,815) |
20,677
|
1,353
|
| NET
INCOME |
106,561
|
192,611
|
241,879
|
7,327
|
(5,043) |
(24,057) |
(985) |
(37,254) |
32,877
|
4,204
|
17,080
|
17,560
|
531,383
|
(550,601) |
533,543
|
| Attributed
to shareholders of the parent company - continuing operations |
118,070
|
192,611
|
241,879
|
-
|
(3,530) |
-
|
(985) |
(37,254) |
32,877
|
4,204
|
17,080
|
17,560
|
527,690
|
(571,003) |
539,198
|
| Attributed
to the controlling company's shareholders - discontinued operations |
(11,509) |
|
-
|
3,737
|
-
|
(19,534) |
-
|
-
|
-
|
-
|
-
|
-
|
3,693
|
15,787
|
(7,815) |
| Attributed
to non-controlling shareholders- continuing operations |
-
|
-
|
-
|
-
|
(1,513) |
-
|
-
|
-
|
-
|
-
|
-
|
-
|
-
|
-
|
(1,513) |
| Attributed
to non-controlling shareholders- discontinued operations |
-
|
-
|
-
|
3,590
|
-
|
(4,523) |
-
|
-
|
-
|
-
|
-
|
-
|
-
|
4,615
|
3,673
|
| EBITDA
continuing operations |
332,893
|
288,896
|
635,747
|
34,615
|
9,821
|
(17,001) |
(713) |
84,828
|
73,208
|
6,722
|
16,636
|
17,821
|
514,936
|
(598,693) |
1,399,717
|
| R$'000 |
| Income
Statement 1Q23 |
GET
|
Distribuição
|
Compagas
|
Elejor
|
UEG
Araucária |
Serviços
|
Wind
Farms |
FDA
|
Bela
Vista |
C.
Oeste, Marumbi, Uirapuru |
Mercado
Livre |
Holding
|
Elimination
|
Consolidated
|
| Geração
|
Transmissão
|
| NET
OPERATING INCOME |
625,877
|
317,699
|
3,531,641
|
263,251
|
41,034
|
- |
- |
203,808
|
192,001
|
7,953
|
22,700
|
1,116,652
|
- |
(1,055,059) |
5,267,557
|
| Electricity
sales to final customers |
- |
- |
1,324,337
|
- |
- |
- |
- |
- |
- |
(9) |
- |
580,207
|
- |
(376) |
1,904,159
|
| Electricity
sales to distributors |
611,265
|
- |
34,115
|
- |
40,816
|
- |
- |
203,808
|
191,997
|
7,962
|
- |
479,303
|
- |
(676,602) |
892,664
|
| Use
of the main distribution and transmission grid (TUSD/ TUST) |
- |
273,146
|
1,300,992
|
- |
- |
- |
- |
- |
- |
- |
22,324
|
- |
- |
(100,244) |
1,496,218
|
| Construction
revenue |
- |
38,022
|
489,977
|
2,991
|
- |
- |
- |
- |
- |
- |
370
|
- |
- |
(2,991) |
528,369
|
| Fair
value of assets from the indemnity for the concession |
- |
- |
25,734
|
- |
- |
- |
- |
- |
- |
- |
- |
- |
- |
- |
25,734
|
| Distribution
of piped gas |
- |
- |
- |
260,260
|
- |
- |
- |
- |
- |
- |
- |
- |
- |
(260,260) |
- |
| Sectoral
assets and liabilities result |
- |
- |
244,226
|
- |
- |
- |
- |
- |
- |
- |
- |
- |
- |
- |
244,226
|
| Other
operating revenues |
14,612
|
6,531
|
112,260
|
- |
218
|
- |
- |
- |
4
|
- |
6
|
57,142
|
- |
(14,586) |
176,187
|
| OPERATING
COSTS AND EXPENSES |
(306,870) |
(121,398) |
(3,238,770) |
(219,345) |
(22,273) |
(21,760) |
(661) |
(120,861) |
(97,815) |
(5,120) |
(2,801) |
(1,018,224) |
(34,179) |
1,029,947
|
(4,180,130) |
| Energy
purchased for resale |
(11,769) |
- |
(1,464,757) |
- |
(502) |
- |
- |
(7,544) |
(5,575) |
(474) |
- |
(1,008,782) |
- |
678,428
|
(1,820,975) |
| Charges
of the main distribution and transmission grid |
(90,281) |
- |
(625,128) |
- |
(5,923) |
(8,640) |
- |
(15,244) |
(39,025) |
(328) |
- |
- |
- |
108,111
|
(676,458) |
| Personnel
and management |
(70,418) |
(52,646) |
(260,812) |
(10,863) |
(1,203) |
(1,606) |
- |
(5,186) |
(1,011) |
(402) |
(330) |
(5,471) |
(15,222) |
12,469
|
(412,701) |
| Private
pension and health plans |
(11,482) |
(8,178) |
(41,545) |
(1,500) |
(56) |
(187) |
- |
(454) |
(89) |
(24) |
(30) |
(510) |
(1,943) |
1,687
|
(64,311) |
| Materials
|
(2,311) |
(1,355) |
(15,960) |
(213) |
(121) |
(4) |
- |
(363) |
(219) |
(32) |
(15) |
(9) |
(321) |
216
|
(20,707) |
| Raw
material and supplies - energy production |
(6,716) |
- |
- |
- |
- |
(162) |
- |
- |
- |
- |
- |
- |
- |
162
|
(6,716) |
| Natural
gas and supplies for gas business |
- |
- |
- |
(181,782) |
- |
- |
- |
- |
- |
- |
- |
- |
- |
181,782
|
- |
| Third-party
services |
(24,387) |
(14,780) |
(155,176) |
(3,073) |
(3,829) |
(5,104) |
(172) |
(24,008) |
(8,794) |
(820) |
(1,676) |
(501) |
(10,671) |
20,559
|
(232,432) |
| Depreciation
and amortization |
(94,648) |
(3,881) |
(124,363) |
(15,775) |
(8,544) |
(5,460) |
(511) |
(61,038) |
(31,899) |
(2,801) |
(7) |
(714) |
(729) |
18,955
|
(331,415) |
| Provisions
and reversals |
32,356
|
(2,243) |
(17,610) |
(365) |
- |
- |
- |
2,508
|
- |
- |
(56) |
(465) |
(3,120) |
83
|
11,088
|
| Construction
cost |
- |
(35,643) |
(489,977) |
(2,991) |
- |
- |
- |
- |
- |
- |
(370) |
- |
- |
2,991
|
(525,990) |
| Other
operating costs and expenses |
(27,214) |
(2,672) |
(43,442) |
(2,783) |
(2,095) |
(597) |
22
|
(9,532) |
(11,203) |
(239) |
(317) |
(1,772) |
(2,173) |
4,504
|
(99,513) |
| EQUITY
IN EARNINGS OF SUBSIDIARIES |
248,707
|
120,244
|
- |
- |
- |
- |
- |
21,911
|
- |
- |
- |
- |
643,535
|
(930,309) |
104,088
|
| EARNINGS
BEFORE INCOME TAXES |
567,714
|
316,545
|
292,871
|
43,906
|
18,761
|
(21,760) |
(661) |
104,858
|
94,186
|
2,833
|
19,899
|
98,428
|
609,356
|
(955,421) |
1,191,515
|
| FINANCIAL
RESULTS |
(87,668) |
(102,079) |
(112,535) |
(4,503) |
(19,283) |
598
|
(156) |
(40,607) |
5,154
|
3,232
|
1,779
|
8,547
|
14,383
|
3,904
|
(329,234) |
| Financial
income |
25,045
|
13,745
|
115,620
|
6,153
|
12,690
|
2,233
|
170
|
33,975
|
5,301
|
3,232
|
2,494
|
8,631
|
14,924
|
(11,960) |
232,253
|
| Financial
expenses |
(112,713) |
(115,824) |
(228,155) |
(10,656) |
(31,973) |
(1,635) |
(326) |
(74,582) |
(147) |
- |
(715) |
(84) |
(541) |
15,864
|
(561,487) |
| OPERATIONAL
EXPENSES / INCOME |
480,046
|
214,466
|
180,336
|
39,403
|
(522) |
(21,162) |
(817) |
64,251
|
99,340
|
6,065
|
21,678
|
106,975
|
623,739
|
(951,517) |
862,281
|
| INCOME
TAX AND SOCIAL CONTRIBUTION ON PROFIT |
(78,427) |
(31,943) |
(40,646) |
(13,480) |
1,114
|
- |
- |
(16,639) |
(33,725) |
(1,347) |
(1,578) |
(36,471) |
6,814
|
14,197
|
(232,131) |
| NET
INCOME continuing operations |
401,619
|
182,523
|
139,690
|
25,923
|
592
|
(21,162) |
(817) |
47,612
|
65,615
|
4,718
|
20,100
|
70,504
|
630,553
|
(937,320) |
630,150
|
| NET
INCOME discontinued operations |
(12,888) |
- |
- |
- |
- |
- |
- |
- |
- |
- |
- |
- |
(3,963) |
22,191
|
5,340
|
| NET
INCOME |
388,731
|
182,523
|
139,690
|
25,923
|
592
|
(21,162) |
(817) |
47,612
|
65,615
|
4,718
|
20,100
|
70,504
|
626,590
|
(915,129) |
635,490
|
| Attributed
to shareholders of the parent company - continuing operations |
401,619
|
182,523
|
139,690
|
- |
414
|
- |
(817) |
47,612
|
65,615
|
4,718
|
20,100
|
70,504
|
617,665
|
(919,090) |
630,553
|
| Attributed
to the controlling company's shareholders - discontinued operations |
(12,888) |
|
- |
13,221
|
- |
(17,184) |
- |
- |
- |
- |
- |
- |
8,925
|
3,961
|
(3,963) |
| Attributed
to non-controlling shareholders- continuing operations |
- |
- |
- |
- |
178
|
- |
- |
- |
- |
- |
- |
- |
- |
- |
177
|
| Attributed
to non-controlling shareholders- discontinued operations |
- |
- |
- |
12,702
|
- |
(3,978) |
- |
- |
- |
- |
- |
- |
- |
- |
8,723
|
| EBITDA
continuing operations |
662,362
|
320,426
|
417,234
|
59,681
|
27,305
|
(16,300) |
(150) |
165,896
|
126,085
|
5,634
|
19,906
|
99,142
|
610,085
|
(974,376) |
1,522,930
|
Exhibit II- RESULT BY SUBSIDIARY > ASSETS BY COMPANY
|
| |
|
|
|
|
|
|
|
|
|
|
|
|
|
R$'000 |
| Assets
- March -2024 |
Geração
e Transmissão |
Distribuição
|
Compagas
|
Elejor
|
UEG
Araucária |
Serviços
|
Wind
Farms |
FDA
|
Bela
Vista |
Costa
Oeste, Marumbi, Uirapuru |
Mercado
Livre |
Holding
|
Eliminations
|
Consolidated
|
| CURRENT |
2,717,034
|
5,441,875
|
218,694
|
195,995
|
20,388
|
5,783
|
1,045,019
|
388,808
|
46,285
|
125,117
|
841,741
|
4,577,893
|
(1,938,234) |
13,686,398
|
| Cash
and cash equivalents |
1,309,772
|
799,684
|
65,789
|
153,363
|
4,631
|
208
|
872,300
|
321,113
|
40,056
|
97,260
|
303,636
|
1,892,501
|
(70,420) |
5,789,893
|
| Bonds
and securities |
-
|
2,165
|
-
|
-
|
-
|
523
|
-
|
-
|
-
|
-
|
-
|
91
|
-
|
2,779
|
| Collaterals
and escrow accounts |
-
|
9
|
245
|
-
|
-
|
-
|
-
|
-
|
-
|
-
|
-
|
-
|
(245) |
9
|
| Customers |
384,078
|
3,152,410
|
79,328
|
19,655
|
-
|
-
|
108,416
|
63,917
|
5,221
|
8,703
|
328,841
|
-
|
(300,271) |
3,850,298
|
| Dividends
receivable |
203,500
|
-
|
-
|
-
|
-
|
-
|
19,883
|
-
|
-
|
-
|
-
|
1,993,256
|
(2,131,593) |
85,046
|
| Sectorial
financial assets |
-
|
-
|
-
|
-
|
-
|
-
|
-
|
-
|
-
|
-
|
-
|
-
|
-
|
-
|
| Account
receivable related to concession |
9,751
|
-
|
-
|
-
|
-
|
-
|
-
|
-
|
-
|
-
|
-
|
-
|
-
|
9,751
|
| Contract
Assets |
262,489
|
-
|
-
|
-
|
-
|
-
|
-
|
-
|
-
|
16,026
|
-
|
-
|
-
|
278,515
|
| Other
current receivables |
114,206
|
450,307
|
63,070
|
9,923
|
63
|
3,077
|
4,915
|
242
|
7
|
600
|
194,288
|
2,796
|
(76,312) |
767,182
|
| Inventories
|
36,269
|
151,710
|
5,474
|
809
|
-
|
-
|
4,387
|
11
|
-
|
205
|
-
|
-
|
(5,474) |
193,391
|
| Income
tax and social contribution |
159,520
|
1,974
|
4,454
|
11,140
|
14,318
|
1,975
|
21,487
|
1,911
|
635
|
2,018
|
14,429
|
130,827
|
(18,772) |
345,916
|
| Other
current recoverable taxes |
20,422
|
835,102
|
-
|
-
|
1,251
|
-
|
105
|
1,200
|
21
|
-
|
241
|
-
|
(1,249) |
857,093
|
| Prepaid
expenses |
10,384
|
40,320
|
334
|
1,105
|
125
|
-
|
10,541
|
414
|
345
|
305
|
286
|
1,532
|
(460) |
65,231
|
| Related
parties |
21,588
|
8,194
|
-
|
-
|
-
|
-
|
2,985
|
-
|
-
|
-
|
20
|
36,520
|
(68,503) |
804
|
| Assets
held for sale |
185,055
|
-
|
-
|
-
|
-
|
-
|
-
|
-
|
-
|
-
|
-
|
520,370
|
735,065
|
1,440,490
|
| NON-CURRENT |
20,800,905
|
16,712,440
|
787,451
|
589,069
|
381,592
|
84,270
|
8,104,512
|
426,267
|
193,192
|
492,056
|
553,741
|
21,000,745
|
(28,351,649) |
41,774,591
|
| Long
Term Assets |
5,864,676
|
7,946,618
|
76,086
|
86,395
|
98,121
|
15,235
|
670,041
|
20,324
|
3
|
491,754
|
543,230
|
553,298
|
(500,252) |
15,865,529
|
| Bonds
and securities |
139,941
|
613
|
-
|
-
|
-
|
-
|
359,055
|
16,759
|
-
|
4,526
|
-
|
-
|
-
|
520,894
|
| Other
temporary investments |
-
|
-
|
-
|
-
|
-
|
14,598
|
-
|
-
|
-
|
-
|
-
|
27,535
|
-
|
42,133
|
| Customers |
-
|
94,832
|
-
|
-
|
-
|
-
|
-
|
-
|
-
|
-
|
-
|
-
|
-
|
94,832
|
| Judicial
deposits |
38,907
|
194,256
|
274
|
-
|
37
|
72
|
90
|
-
|
-
|
-
|
15,298
|
141,778
|
(314) |
390,398
|
| Sectoral
financial assets |
-
|
-
|
-
|
-
|
|
-
|
-
|
-
|
-
|
-
|
-
|
-
|
-
|
-
|
| Account
receivable related to concession |
866,572
|
2,091,165
|
-
|
-
|
-
|
-
|
-
|
-
|
-
|
-
|
-
|
-
|
-
|
2,957,737
|
| Contract
Assets |
4,656,004
|
2,172,973
|
46,604
|
-
|
-
|
-
|
-
|
-
|
-
|
487,145
|
-
|
-
|
(53,884) |
7,308,842
|
| Other
non-current receivables |
83,033
|
41,710
|
29,208
|
2,508
|
-
|
-
|
-
|
2,796
|
-
|
83
|
527,861
|
18
|
(29,204) |
658,013
|
| Income
tax and social contribution |
512
|
59,820
|
-
|
1,301
|
-
|
-
|
-
|
-
|
-
|
-
|
71
|
-
|
-
|
61,704
|
| Deferred
income tax and social contribution |
1,674
|
1,268,959
|
-
|
76,735
|
73,066
|
-
|
-
|
-
|
-
|
-
|
-
|
340,403
|
(73,066) |
1,687,771
|
| Other
non-current recoverable taxes |
78,033
|
2,022,290
|
-
|
-
|
25,018
|
565
|
196
|
769
|
3
|
-
|
-
|
41,347
|
(25,016) |
2,143,205
|
| Related
parties |
-
|
-
|
-
|
5,851
|
-
|
-
|
310,700
|
-
|
-
|
-
|
-
|
2,217
|
(318,768) |
-
|
| Investments
|
8,650,835
|
443
|
-
|
-
|
-
|
-
|
2,774,798
|
-
|
-
|
-
|
-
|
20,425,463
|
(28,344,004) |
3,507,535
|
| Property,
plant and equipment, net |
5,206,842
|
-
|
-
|
320,143
|
283,450
|
64,539
|
4,609,252
|
319,382
|
188,233
|
242
|
769
|
8,390
|
(283,451) |
10,717,791
|
| Intangible
assets |
1,003,688
|
8,619,564
|
690,868
|
181,778
|
21
|
840
|
7,287
|
86,561
|
4,956
|
60
|
5,620
|
6,690
|
796,557
|
11,404,490
|
| Right
to use an asset |
74,864
|
145,815
|
20,497
|
753
|
-
|
3,656
|
43,134
|
-
|
-
|
-
|
4,122
|
6,904
|
(20,499) |
279,246
|
| TOTAL
|
23,517,939
|
22,154,315
|
1,006,145
|
785,064
|
401,980
|
90,053
|
9,149,531
|
815,075
|
239,477
|
617,173
|
1,395,482
|
25,578,638
|
(30,289,883) |
55,460,989
|
| Assets
- December 2023 |
Geração
e Transmissão |
Distribuição
|
Compagas
|
Elejor
|
UEG
Araucária |
Serviços
|
Wind
Farms |
FDA
|
Bela
Vista |
Costa
Oeste, Marumbi, Uirapuru |
Mercado
Livre |
Holding
|
Eliminations
|
Consolidated
|
| CURRENT |
2,483,103
|
5,153,666
|
240,017
|
209,323
|
36,580
|
13,598
|
1,008,543
|
442,162
|
38,993
|
110,409
|
1,074,359
|
4,820,021
|
(1,915,044) |
13,715,730
|
| Cash
and cash equivalents |
1,008,767
|
626,708
|
101,437
|
166,544
|
22,354
|
3,290
|
831,553
|
353,241
|
34,999
|
83,343
|
294,762
|
2,231,413
|
(123,788) |
5,634,623
|
| Bonds
and securities |
-
|
-
|
-
|
-
|
-
|
4,670
|
-
|
-
|
-
|
-
|
-
|
93
|
-
|
4,763
|
| Collaterals
and escrow accounts |
-
|
9
|
211
|
-
|
-
|
-
|
-
|
-
|
-
|
-
|
-
|
-
|
(211) |
9
|
| Customers |
425,448
|
2,973,010
|
83,153
|
21,157
|
-
|
-
|
115,672
|
84,309
|
3,074
|
7,976
|
382,264
|
-
|
(334,893) |
3,761,170
|
| Dividends
receivable |
212,944
|
-
|
-
|
-
|
-
|
-
|
19,883
|
-
|
-
|
-
|
-
|
1,942,406
|
(2,079,664) |
95,569
|
| Sectorial
financial assets |
-
|
15,473
|
-
|
-
|
-
|
-
|
-
|
-
|
-
|
-
|
-
|
-
|
-
|
15,473
|
| Account
receivable related to concession |
9,354
|
-
|
-
|
-
|
-
|
-
|
-
|
-
|
-
|
-
|
-
|
-
|
-
|
9,354
|
| Contract
Assets |
268,260
|
-
|
-
|
-
|
-
|
-
|
-
|
-
|
-
|
16,356
|
-
|
-
|
-
|
284,616
|
| Other
current receivables |
118,627
|
435,619
|
43,950
|
9,398
|
1
|
3,120
|
5,968
|
252
|
-
|
653
|
383,243
|
2,431
|
(53,530) |
949,732
|
| Inventories
|
37,923
|
131,927
|
5,383
|
264
|
-
|
16
|
4,375
|
16
|
-
|
205
|
-
|
-
|
(5,383) |
174,726
|
| Income
tax and social contribution |
150,720
|
1,259
|
5,326
|
10,217
|
13,909
|
1,937
|
19,316
|
2,586
|
491
|
1,644
|
13,516
|
113,532
|
(19,235) |
315,218
|
| Other
current recoverable taxes |
18,688
|
922,450
|
8
|
-
|
-
|
565
|
102
|
1,180
|
23
|
-
|
333
|
-
|
(6) |
943,343
|
| Prepaid
expenses |
11,334
|
37,807
|
549
|
1,743
|
316
|
-
|
8,631
|
578
|
406
|
232
|
241
|
1,897
|
(865) |
62,869
|
| Related
parties |
24,474
|
9,404
|
-
|
-
|
-
|
-
|
3,043
|
-
|
-
|
-
|
-
|
54
|
(35,639) |
1,336
|
| NON-CURRENT |
196,564
|
-
|
-
|
-
|
-
|
-
|
-
|
-
|
-
|
-
|
-
|
528,195
|
738,170
|
1,462,929
|
| Long
Term Assets |
20,868,273
|
16,677,461
|
783,607
|
594,827
|
386,787
|
49,078
|
8,125,742
|
452,885
|
196,589
|
491,174
|
750,631
|
20,538,876
|
(27,812,586) |
42,103,344
|
| Bonds
and securities |
5,886,631
|
8,229,821
|
73,274
|
83,192
|
98,157
|
593
|
609,417
|
18,922
|
224
|
490,861
|
740,114
|
611,187
|
(498,956) |
16,343,437
|
| Other
temporary investments |
136,591
|
1,005
|
-
|
-
|
-
|
-
|
330,401
|
16,388
|
-
|
4,410
|
1,937
|
-
|
-
|
490,732
|
| Customers |
-
|
-
|
-
|
-
|
-
|
-
|
-
|
-
|
-
|
-
|
-
|
31,728
|
-
|
31,728
|
| Judicial
deposits |
-
|
105,259
|
-
|
-
|
-
|
-
|
-
|
-
|
-
|
-
|
-
|
-
|
-
|
105,259
|
| Sectoral
financial assets |
94,368
|
380,433
|
61
|
-
|
41
|
593
|
81
|
-
|
218
|
-
|
15,647
|
143,371
|
(101) |
634,712
|
| Account
receivable related to concession |
-
|
15,473
|
-
|
-
|
-
|
-
|
-
|
-
|
-
|
-
|
-
|
-
|
-
|
15,473
|
| Contract
Assets |
855,222
|
1,954,679
|
-
|
-
|
-
|
-
|
-
|
-
|
-
|
-
|
-
|
-
|
-
|
2,809,901
|
| Other
non-current receivables |
4,639,497
|
2,201,958
|
44,039
|
-
|
-
|
-
|
-
|
-
|
-
|
486,451
|
-
|
-
|
(51,500) |
7,320,445
|
| Income
tax and social contribution |
81,646
|
44,839
|
29,174
|
2,507
|
-
|
-
|
44
|
1,859
|
-
|
-
|
722,423
|
18
|
(29,170) |
853,340
|
| Deferred
income tax and social contribution |
508
|
66,123
|
-
|
1,301
|
-
|
-
|
-
|
-
|
-
|
-
|
71
|
-
|
-
|
68,003
|
| Other
non-current recoverable taxes |
-
|
1,324,670
|
-
|
73,533
|
73,066
|
-
|
-
|
-
|
-
|
-
|
-
|
359,485
|
(73,066) |
1,757,688
|
| Prepaid
expenses |
78,799
|
2,135,382
|
-
|
-
|
25,050
|
-
|
178
|
675
|
6
|
-
|
36
|
41,078
|
(25,048) |
2,256,156
|
| Related
parties |
-
|
-
|
-
|
5,851
|
-
|
-
|
278,713
|
-
|
-
|
-
|
-
|
35,507
|
(320,071) |
-
|
| Investments
|
8,629,485
|
443
|
-
|
-
|
-
|
-
|
2,788,839
|
-
|
-
|
-
|
-
|
19,906,237
|
(27,813,207) |
3,511,797
|
| Property,
plant and equipment, net |
5,259,216
|
-
|
-
|
326,291
|
288,602
|
43,881
|
4,676,981
|
318,527
|
191,085
|
247
|
770
|
8,424
|
(288,603) |
10,825,421
|
| Intangible
assets |
1,028,600
|
8,317,327
|
699,697
|
184,539
|
28
|
911
|
7,267
|
115,436
|
5,280
|
66
|
5,784
|
6,336
|
798,818
|
11,170,089
|
| Right
to use an asset |
64,341
|
129,870
|
10,636
|
805
|
-
|
3,693
|
43,238
|
-
|
-
|
-
|
3,963
|
6,692
|
(10,638) |
252,600
|
| TOTAL
|
23,351,376
|
21,831,127
|
1,023,624
|
804,150
|
423,367
|
62,676
|
9,134,285
|
895,047
|
235,582
|
601,583
|
1,824,990
|
25,358,897
|
(29,727,630) |
55,819,074
|
|
Exhibit II- RESULT BY SUBSIDIARY > LIABILITIES BY
COMPANY
|
| |
|
|
|
|
|
|
|
|
|
|
|
|
|
R$'000 |
| Liabilities
- March -24 |
Geração
e Transmissão |
Distribuição
|
Compagas
|
Elejor
|
UEG
Araucária |
Serviços
|
Wind
Farms |
FDA
|
Bela
Vista |
Costa
Oeste, Marumbi, Uirapuru |
Mercado
Livre |
Holding
|
Eliminations
|
Consolidated
|
| CURRENT
|
3,410,158
|
5,878,560
|
186,805
|
106,548
|
51,030
|
17,630
|
571,228
|
114,002
|
3,066
|
22,569
|
694,791
|
874,047
|
(2,084,681) |
9,845,753
|
| Social
charges and accruals |
291,332
|
616,554
|
10,093
|
371
|
643
|
-
|
64
|
-
|
-
|
-
|
6,628
|
32,025
|
(10,736) |
946,974
|
| Associated
companies and parent company |
5,266
|
11,014
|
-
|
-
|
-
|
53
|
28,346
|
675
|
185
|
227
|
333
|
1,639
|
(47,738) |
-
|
| Suppliers
|
334,635
|
1,604,763
|
60,787
|
3,231
|
5,833
|
17,294
|
72,885
|
26,134
|
762
|
1,153
|
317,268
|
7,150
|
(295,179) |
2,156,716
|
| Income
Tax and Social Contribution payable |
314
|
12,306
|
21
|
294
|
-
|
117
|
9,591
|
20,003
|
293
|
622
|
1,725
|
-
|
(17) |
45,269
|
| Other
taxes |
25,308
|
251,756
|
4,983
|
714
|
288
|
148
|
7,056
|
3,924
|
190
|
254
|
12,668
|
6,270
|
(5,271) |
308,288
|
| Loans
and financing |
641,558
|
373,102
|
-
|
-
|
-
|
-
|
125,695
|
-
|
-
|
5,091
|
-
|
-
|
-
|
1,145,446
|
| Debentures
|
585,513
|
704,893
|
80,933
|
-
|
-
|
-
|
53,598
|
-
|
-
|
-
|
-
|
-
|
(80,933) |
1,344,004
|
| Dividends
payable |
1,325,433
|
460,904
|
24,332
|
-
|
44,266
|
-
|
40,397
|
55,460
|
1,552
|
14,152
|
185,341
|
464,138
|
(2,151,838) |
464,137
|
| Post
employment benefits |
24,856
|
67,323
|
-
|
-
|
-
|
-
|
-
|
-
|
-
|
-
|
127
|
4,399
|
-
|
96,705
|
| Customer
charges due |
16,980
|
44,789
|
-
|
-
|
-
|
-
|
-
|
840
|
-
|
207
|
-
|
-
|
-
|
62,816
|
| Research
and development and energy efficiency |
53,210
|
240,023
|
-
|
1,687
|
-
|
-
|
-
|
310
|
-
|
581
|
-
|
-
|
-
|
295,811
|
| Payables
related to concession |
2,201
|
-
|
-
|
98,897
|
-
|
-
|
-
|
-
|
-
|
-
|
-
|
-
|
-
|
101,098
|
| Sectorial
financial liabilities |
-
|
423,955
|
-
|
-
|
-
|
-
|
-
|
-
|
-
|
-
|
-
|
-
|
-
|
423,955
|
| Other
accounts payable |
9,112
|
42,392
|
2,216
|
249
|
-
|
18
|
496
|
-
|
-
|
-
|
121
|
329
|
(2,216) |
52,717
|
| Other
bills to pay |
94,440
|
186,899
|
3,440
|
1,105
|
-
|
-
|
233,100
|
6,656
|
84
|
282
|
170,580
|
358,097
|
(3,440) |
1,051,243
|
| PIS
and Cofins to be refunded to consumers |
-
|
773,259
|
-
|
-
|
-
|
-
|
-
|
-
|
-
|
-
|
-
|
-
|
-
|
773,259
|
| Provision
for allocation of Pis and Cofins credits |
-
|
64,628
|
-
|
-
|
-
|
-
|
-
|
-
|
-
|
-
|
-
|
-
|
-
|
64,628
|
| Provisions
for litigation |
-
|
-
|
-
|
-
|
-
|
-
|
-
|
-
|
-
|
-
|
-
|
-
|
-
|
-
|
| Liabilities
associated with assets held for sale |
-
|
-
|
-
|
-
|
-
|
-
|
-
|
-
|
-
|
-
|
-
|
-
|
512,687
|
512,687
|
| NON-CURRENT
|
7,120,442
|
9,251,012
|
297,365
|
719,635
|
57,396
|
5,936
|
3,110,879
|
34,143
|
2,936
|
45,301
|
340,925
|
287,011
|
(383,009) |
20,889,972
|
| Associated
companies and parent company |
-
|
-
|
-
|
-
|
36,814
|
2,217
|
297,969
|
-
|
-
|
-
|
-
|
5,851
|
(342,851) |
-
|
| Suppliers
|
131,143
|
-
|
-
|
-
|
-
|
-
|
-
|
-
|
-
|
-
|
-
|
-
|
-
|
131,143
|
| Deferred
income tax and social contribution |
1,235,697
|
-
|
20,492
|
1,498
|
-
|
(8) |
28,212
|
25,909
|
1,130
|
19,481
|
105,898
|
75
|
266,584
|
1,704,968
|
| Tax
liabilities |
-
|
334,765
|
-
|
-
|
-
|
-
|
-
|
-
|
-
|
-
|
-
|
-
|
-
|
334,765
|
| Loans
and financing |
1,579,892
|
376,788
|
-
|
-
|
-
|
-
|
2,136,725
|
-
|
-
|
19,211
|
-
|
-
|
-
|
4,112,616
|
| Debentures
|
3,179,295
|
4,781,167
|
184,039
|
-
|
-
|
-
|
484,011
|
-
|
-
|
-
|
-
|
-
|
(184,039) |
8,444,473
|
| Post-employment
benefits |
398,909
|
946,987
|
8,965
|
-
|
738
|
-
|
-
|
-
|
-
|
-
|
3,610
|
46,992
|
(9,703) |
1,396,498
|
| Research
and development and energy efficiency |
-
|
245,419
|
-
|
-
|
8,916
|
-
|
-
|
8,234
|
-
|
825
|
-
|
-
|
(8,916) |
254,478
|
| Payables
related to the concession |
63,515
|
-
|
-
|
717,578
|
-
|
-
|
-
|
-
|
-
|
-
|
-
|
-
|
-
|
781,093
|
| Sectorial
financial liabilities |
-
|
93,797
|
-
|
-
|
-
|
-
|
-
|
-
|
-
|
-
|
-
|
-
|
-
|
93,797
|
| Lease
liability |
71,066
|
113,618
|
19,545
|
559
|
-
|
3,727
|
45,888
|
-
|
-
|
-
|
4,235
|
7,045
|
(19,545) |
246,138
|
| Other
payables |
51,166
|
2,115
|
47,893
|
-
|
-
|
-
|
115,687
|
-
|
-
|
17
|
226,571
|
28,894
|
(76,676) |
395,667
|
| PIS/Cofins
to be refunded to consumers |
-
|
-
|
-
|
-
|
-
|
-
|
-
|
-
|
-
|
-
|
-
|
-
|
-
|
-
|
| Provision
for allocation of PIS and COFINS |
-
|
1,846,131
|
-
|
-
|
-
|
-
|
-
|
-
|
-
|
-
|
-
|
-
|
-
|
1,846,131
|
| Provisions
for litigation |
409,759
|
510,225
|
16,431
|
-
|
10,928
|
-
|
2,387
|
-
|
1,806
|
5,767
|
611
|
198,154
|
(7,863) |
1,148,205
|
| EQUITY
|
12,987,339
|
7,024,743
|
521,975
|
(41,119) |
293,554
|
66,487
|
5,467,424
|
666,930
|
233,475
|
549,303
|
359,766
|
24,417,580
|
(27,822,193) |
24,725,264
|
| Attributable
to controlling shareholders |
12,987,339
|
7,024,743
|
521,975
|
(41,119) |
293,554
|
66,487
|
5,467,424
|
666,930
|
233,475
|
549,303
|
359,766
|
24,417,580
|
(28,129,877) |
24,417,580
|
| Capital
|
6,242,757
|
5,372,206
|
220,966
|
35,503
|
425,662
|
78,785
|
5,157,938
|
409,509
|
223,913
|
275,161
|
237,210
|
12,821,758
|
(18,679,610) |
12,821,758
|
| Advance
for Future Capital Increase |
-
|
-
|
-
|
-
|
-
|
-
|
17,681
|
-
|
-
|
-
|
-
|
-
|
(17,681) |
-
|
| Capital
reserves |
-
|
-
|
-
|
-
|
-
|
-
|
-
|
-
|
-
|
-
|
-
|
-
|
-
|
-
|
| Asset
valuation adjustments |
490,094
|
(163,951) |
983
|
2,907
|
442
|
(1) |
-
|
-
|
-
|
-
|
(1,097) |
299,005
|
(329,377) |
299,005
|
| Legal
Reserves |
961,538
|
335,200
|
44,193
|
-
|
-
|
-
|
55,133
|
58,164
|
703
|
27,949
|
28,071
|
1,625,628
|
(1,510,951) |
1,625,628
|
| Profit
retention reserve |
4,985,688
|
1,239,409
|
136,887
|
-
|
-
|
-
|
443,457
|
-
|
-
|
186,658
|
4,377
|
9,000,506
|
(6,996,476) |
9,000,506
|
| Additional
proposed dividends |
-
|
-
|
-
|
-
|
-
|
-
|
117,100
|
166,380
|
4,655
|
42,455
|
73,645
|
131,211
|
(404,235) |
131,211
|
| Accumulated
profit |
307,262
|
241,879
|
118,946
|
(79,529) |
(132,550) |
(12,297) |
(323,885) |
32,877
|
4,204
|
17,080
|
17,560
|
539,472
|
(191,547) |
539,472
|
| Attributable
to noncontrolling interests |
-
|
-
|
-
|
-
|
-
|
-
|
-
|
-
|
-
|
-
|
-
|
-
|
307,684
|
307,684
|
| TOTAL
|
23,517,939
|
22,154,315
|
1,006,145
|
785,064
|
401,980
|
90,053
|
9,149,531
|
815,075
|
239,477
|
617,173
|
1,395,482
|
25,578,638
|
(30,289,883) |
55,460,989
|
| |
|
|
|
|
|
|
|
|
|
|
|
|
|
R$'000 |
| Liabilities
- December-23 |
Geração
e Transmissão |
Distribuição
|
Compagas
|
Elejor
|
UEG
Araucária |
Serviços
|
Wind
Farms |
FDA
|
Bela
Vista |
Costa
Oeste, Marumbi, Uirapuru |
Mercado
Livre |
Holding
|
Eliminations
|
Consolidated
|
| CURRENT
|
2,929,672
|
5,490,743
|
206,137
|
109,350
|
49,797
|
4,033
|
549,114
|
218,002
|
3,601
|
22,804
|
932,237
|
857,164
|
(2,063,223) |
9,309,433
|
| Social
charges and accruals |
290,601
|
597,160
|
9,452
|
369
|
702
|
-
|
64
|
-
|
-
|
-
|
8,736
|
30,608
|
(10,154) |
927,538
|
| Associated
companies and parent company |
5,967
|
11,950
|
-
|
-
|
-
|
54
|
30,356
|
865
|
238
|
286
|
379
|
1,841
|
(51,933) |
-
|
| Suppliers
|
318,600
|
1,605,111
|
58,010
|
3,984
|
5,684
|
3,754
|
68,712
|
23,045
|
586
|
976
|
381,520
|
4,529
|
(320,085) |
2,154,430
|
| Income
Tax and Social Contribution payable |
-
|
-
|
12,876
|
294
|
-
|
-
|
8,721
|
122,906
|
278
|
596
|
-
|
183
|
(12,876) |
132,979
|
| Other
taxes |
57,245
|
253,336
|
13,463
|
1,057
|
277
|
208
|
8,611
|
4,871
|
501
|
264
|
19,508
|
474
|
(13,734) |
346,083
|
| Loans
and financing |
174,260
|
375,135
|
-
|
-
|
-
|
-
|
120,930
|
-
|
-
|
5,656
|
-
|
-
|
-
|
675,980
|
| Debentures
|
607,981
|
569,700
|
81,797
|
-
|
-
|
-
|
47,968
|
-
|
-
|
-
|
-
|
-
|
(81,797) |
1,225,649
|
| Dividends
payable |
1,274,433
|
460,904
|
24,314
|
-
|
43,134
|
-
|
40,397
|
55,460
|
1,552
|
14,151
|
185,341
|
464,147
|
(2,099,687) |
464,147
|
| Post
employment benefits |
22,124
|
59,742
|
-
|
-
|
-
|
-
|
-
|
-
|
-
|
-
|
125
|
3,842
|
-
|
85,833
|
| Customer
charges due |
15,248
|
44,789
|
-
|
-
|
-
|
-
|
-
|
1,177
|
-
|
252
|
-
|
-
|
-
|
61,466
|
| Research
and development and energy efficiency |
55,130
|
262,444
|
-
|
1,672
|
-
|
-
|
-
|
369
|
-
|
582
|
-
|
-
|
-
|
320,196
|
| Payables
related to concession |
2,170
|
-
|
-
|
99,806
|
-
|
-
|
-
|
-
|
-
|
-
|
-
|
-
|
-
|
101,976
|
| Sectorial
financial liabilities |
-
|
476,103
|
-
|
-
|
-
|
-
|
-
|
-
|
-
|
-
|
-
|
-
|
-
|
476,103
|
| Other
accounts payable |
8,364
|
40,083
|
2,601
|
249
|
-
|
17
|
487
|
-
|
-
|
-
|
137
|
405
|
(2,601) |
49,742
|
| Other
bills to pay |
97,549
|
175,695
|
3,624
|
1,919
|
-
|
-
|
222,868
|
9,309
|
446
|
41
|
336,491
|
15,135
|
(3,620) |
859,456
|
| PIS
and Cofins to be refunded to consumers |
-
|
558,591
|
-
|
-
|
-
|
-
|
-
|
-
|
-
|
-
|
-
|
-
|
-
|
558,591
|
| Provisions
for litigation |
-
|
-
|
-
|
-
|
-
|
-
|
-
|
-
|
-
|
-
|
-
|
336,000
|
-
|
336,000
|
| Assets
held for sale |
-
|
-
|
-
|
-
|
-
|
-
|
-
|
-
|
-
|
-
|
-
|
-
|
533,264
|
533,264
|
| NON-CURRENT
|
7,673,539
|
9,557,520
|
302,821
|
730,939
|
55,959
|
4,321
|
3,080,497
|
42,991
|
2,710
|
46,555
|
550,547
|
615,579
|
(346,004) |
22,317,974
|
| Associated
companies and parent company |
-
|
-
|
-
|
-
|
35,616
|
-
|
265,157
|
-
|
-
|
-
|
-
|
5,851
|
(306,624) |
-
|
| Suppliers
|
131,143
|
-
|
-
|
-
|
-
|
-
|
-
|
-
|
-
|
-
|
-
|
-
|
-
|
131,143
|
| Deferred
income tax and social contribution |
1,207,009
|
-
|
21,319
|
1,465
|
-
|
-
|
24,244
|
35,267
|
865
|
18,733
|
109,736
|
-
|
268,156
|
1,686,793
|
| Tax
liabilities |
60,756
|
546,184
|
-
|
-
|
-
|
589
|
-
|
-
|
-
|
-
|
534
|
4,030
|
-
|
612,093
|
| Loans
and financing |
2,106,275
|
375,585
|
-
|
-
|
-
|
-
|
2,164,987
|
-
|
-
|
20,390
|
-
|
-
|
-
|
4,667,237
|
| Debentures
|
3,160,977
|
4,750,476
|
202,405
|
-
|
-
|
-
|
482,004
|
-
|
-
|
-
|
-
|
-
|
(202,405) |
8,393,457
|
| Post-employment
benefits |
398,594
|
948,724
|
8,608
|
-
|
718
|
-
|
-
|
-
|
-
|
-
|
3,555
|
47,537
|
(9,326) |
1,398,410
|
| Research
and development and energy efficiency |
-
|
224,996
|
-
|
-
|
8,690
|
-
|
-
|
7,724
|
-
|
757
|
-
|
-
|
(8,690) |
233,478
|
| Payables
related to the concession |
62,990
|
-
|
-
|
728,889
|
-
|
-
|
-
|
-
|
-
|
-
|
-
|
-
|
-
|
791,879
|
| Sectorial
financial liabilities |
-
|
27,888
|
-
|
-
|
-
|
-
|
-
|
-
|
-
|
-
|
-
|
-
|
-
|
27,888
|
| Lease
liability |
60,761
|
99,138
|
8,972
|
585
|
-
|
3,732
|
45,781
|
-
|
-
|
-
|
4,022
|
6,681
|
(8,972) |
220,700
|
| Other
payables |
49,539
|
1,559
|
45,086
|
-
|
-
|
-
|
96,018
|
-
|
-
|
17
|
431,938
|
25,297
|
(70,384) |
579,070
|
| PIS/Cofins
to be refunded to consumers |
-
|
173,135
|
-
|
-
|
-
|
-
|
-
|
-
|
-
|
-
|
-
|
-
|
-
|
173,135
|
| Provision
for allocation of PIS and Cofins credits |
-
|
1,909,775
|
-
|
-
|
-
|
-
|
-
|
-
|
-
|
-
|
-
|
-
|
-
|
1,909,775
|
| Provisions
for litigation |
435,495
|
500,060
|
16,431
|
-
|
10,935
|
-
|
2,306
|
-
|
1,845
|
6,658
|
762
|
526,183
|
(7,759) |
1,492,916
|
| EQUITY
|
12,748,166
|
6,782,864
|
514,666
|
(36,139) |
317,611
|
54,322
|
5,504,674
|
634,053
|
229,271
|
532,222
|
342,206
|
23,886,151
|
(27,318,403) |
24,191,667
|
| Attributable
to controlling shareholders |
12,748,166
|
6,782,864
|
514,666
|
(36,139) |
317,611
|
54,322
|
5,504,674
|
634,053
|
229,271
|
532,222
|
342,206
|
23,886,151
|
(27,623,917) |
23,886,153
|
| Capital
|
6,242,757
|
5,372,206
|
220,966
|
35,503
|
425,662
|
16,685
|
5,157,938
|
409,509
|
223,913
|
275,161
|
237,210
|
12,821,758
|
(18,617,510) |
12,821,758
|
| Advance
for Future Capital Increase |
-
|
-
|
-
|
-
|
-
|
48,950
|
17,681
|
-
|
-
|
-
|
-
|
-
|
(66,631) |
-
|
| Capital
reserves |
-
|
-
|
-
|
-
|
-
|
-
|
-
|
-
|
-
|
-
|
-
|
-
|
-
|
-
|
| Equity
valuation adjustments |
498,183
|
(163,951) |
983
|
2,844
|
442
|
(1) |
-
|
-
|
-
|
-
|
(1,097) |
307,049
|
(337,403) |
307,050
|
| Legal
Reserves |
961,538
|
335,200
|
44,193
|
-
|
-
|
-
|
55,133
|
58,164
|
703
|
27,949
|
28,071
|
1,625,628
|
(1,510,951) |
1,625,628
|
| Profit
retention reserve |
5,045,688
|
1,239,409
|
136,905
|
-
|
-
|
-
|
443,457
|
-
|
-
|
186,658
|
4,377
|
9,000,505
|
(7,056,494) |
9,000,506
|
| Additional
proposed dividends |
-
|
-
|
-
|
-
|
-
|
-
|
117,100
|
166,380
|
4,655
|
42,454
|
73,645
|
131,211
|
(404,235) |
131,211
|
| Accumulated
profit |
-
|
-
|
111,619
|
(74,486) |
(108,493) |
(11,312) |
(286,635) |
-
|
-
|
-
|
-
|
-
|
369,307
|
-
|
| Attributable
to noncontrolling interests |
-
|
-
|
-
|
-
|
-
|
-
|
-
|
-
|
-
|
-
|
-
|
-
|
305,514
|
305,514
|
| TOTAL
|
23,351,377
|
21,831,127
|
1,023,624
|
804,150
|
423,367
|
62,676
|
9,134,285
|
895,046
|
235,582
|
601,581
|
1,824,990
|
25,358,894
|
(29,727,630) |
55,819,074
|
|
Exhibit III - ENERGY MARKET> DISTRIBUTION AND TOTAL
MARKET
|
| |
|
|
|
|
|
|
|
|
| Copel’s Total Market |
|
Number of Customers / Agreements |
|
Energy Sold (GWh) |
| |
Mar-24 |
Mar-23 |
∆% |
|
1Q24 |
1Q23 |
Δ% |
| |
|
|
|
|
|
|
|
|
| Copel DIS |
|
######## |
######## |
1.70 |
- |
5,858 |
5,655 |
3.6 |
| Captive Market |
|
5,118,793 |
5,033,019 |
1.70 |
- |
5,753 |
5,150 |
11.7 |
| Concessionariesand Licensees |
|
2 |
2 |
- |
|
24 |
22 |
8.4 |
| CCEE (Assigments MCSD EN) |
|
180 |
304 |
(40.79) |
|
35 |
48 |
(28.1) |
| CCEE (MVE) |
|
- |
- |
- |
|
0 |
0 |
- |
| CCEE (MCP) 2 |
|
- |
- |
- |
|
47 |
435 |
(89.2) |
| Copel GeT |
|
532 |
389 |
36.76 |
- |
4,657 |
4,560 |
2.1 |
| CCEAR(Copel DIS) |
|
4 |
3 |
33.33 |
- |
34 |
33 |
3.0 |
| CCEAR(other concessionaries) |
|
119 |
101 |
17.82 |
- |
586 |
569 |
3.0 |
| Free Customers |
|
- |
- |
- |
- |
0 |
0 |
- |
| Bilateral Agreements (Copel Mercado Livre) |
|
403 |
273 |
47.62 |
- |
3,788 |
3,492 |
8.5 |
| Bilateral Agreements 1 |
|
6 |
12 |
(50.00) |
- |
50 |
153 |
(67.3) |
| CCEE (MCP) 2 |
|
- |
- |
- |
- |
199 |
313 |
(36.4) |
| Wind Farms Complex |
|
662 |
589 |
12.39 |
- |
1,121 |
1,109 |
1.1 |
| |
|
19 |
15 |
26.67 |
- |
31 |
23 |
34.8 |
| CCEAR(other concessionaries) |
|
618 |
541 |
14.23 |
- |
568 |
480 |
18.3 |
| CER |
|
10 |
10 |
- |
- |
236 |
226 |
4.4 |
| Bilateral Agreements (Copel Mercado Livre) |
|
4 |
8 |
(50.00) |
- |
88 |
122 |
(27.9) |
| Bilateral Agreements |
|
11 |
15 |
(26.67) |
- |
121 |
131 |
(7.6) |
| CCEE (MCP) 2 |
|
- |
- |
- |
- |
77 |
127 |
(39.4) |
| Copel Mercado Livre |
|
1,487 |
1,690 |
(12.01) |
- |
6,042 |
5,893 |
2.5 |
| Free Customers |
|
1,323 |
1,561 |
(15.25) |
- |
2,608 |
2,927 |
(10.9) |
| Bilateral Agreements (Group Companies) |
|
- |
- |
- |
- |
154 |
0 |
- |
| Bilateral Agreements |
|
164 |
129 |
27.13 |
- |
3,213 |
2,820 |
13.9 |
| CCEE (MCP) 2 |
|
- |
- |
- |
- |
67 |
146 |
(54.1) |
| Total Copel |
|
######## |
######## |
1.70 |
|
17,678 |
17,217 |
2.7 |
| Eliminations (operations with Group companies) |
|
- |
- |
- |
|
4,095 |
3,776 |
8.4 |
| Total Consolidated Copel |
|
- |
- |
- |
|
13,583 |
13,441 |
1.1 |
Note: Not considering the energy from MRE (Energy Relocation Mechanism) and the energy from TPP Araucária sold in the CCEE Spot Market.
1 Includes Short Term Sales Agreements and CBR
2 Assured Power allocated in the period, after impact of the GSF.
CCEE: Electric Power Trade Chamber / CCEAR: Energy Purchase Agreements in the Regulated Market / MCP: Short Term Market / CER: Agreements Reserve Energy / MCSD EN - Mechanism for Compensation of Surpluses and Deficits of New Energy / MVE - MVE - Sale of energy to the free market through the Surplus Selling Mechanism. |
| |
|
|
|
|
|
|
|
|
| Copel’s Dis Market |
|
Number of Customers |
|
Consumed Energy (GWh) |
| |
Mar-24 |
Mar-23 |
∆% |
|
1Q24 |
1Q23 |
Δ% |
| Residential |
|
######## |
######## |
2.0 |
|
2,683 |
2,254 |
19.0 |
| Industrial |
|
69,079 |
69,571 |
(0.7) |
|
3,024 |
2,950 |
2.5 |
| Captive |
|
67,698 |
68,411 |
(1.0) |
|
435 |
474 |
(8.3) |
| Free |
|
1,381 |
1,160 |
19.1 |
|
2,589 |
2,475 |
4.6 |
| Commercial |
|
442,397 |
433,318 |
2.1 |
|
1,949 |
1,697 |
14.8 |
| Captive |
|
440,550 |
431,819 |
2.0 |
|
1,302 |
1,167 |
11.6 |
| Free |
|
1,847 |
1,499 |
23.2 |
|
646 |
530 |
22.1 |
| Rural |
|
321,503 |
329,308 |
(2.4) |
|
740 |
680 |
8.8 |
| Captive |
|
321,421 |
329,257 |
(2.4) |
|
690 |
640 |
7.8 |
| Free |
|
82 |
51 |
60.8 |
|
50 |
40 |
24.5 |
| Others |
|
55,554 |
54,158 |
2.6 |
|
648 |
616 |
5.1 |
| Captive |
|
55,537 |
54,146 |
2.6 |
|
642 |
614 |
4.5 |
| Free |
|
17 |
12 |
41.7 |
|
5 |
2 |
206.6 |
| Total Captive Market |
|
######## |
######## |
1.7 |
|
5,753 |
5,150 |
11.7 |
| Total Free Market |
|
3,327 |
2,722 |
22.2 |
|
3,291 |
3,046 |
8.0 |
| Supply to Concessionaries |
|
7 |
7 |
- |
|
240 |
221 |
8.3 |
| Total Grid Market |
|
######## |
######## |
1.7 |
|
9,284 |
8,418 |
10.3 |
| Micro and Mini Distributed Energy Generation |
|
336,359 |
249,709 |
34.7 |
|
(667) |
(431) |
55.0 |
| Total Billed Market |
|
|
|
|
|
8,616 |
7,987 |
7.9 |
| |
|
|
|
|
|
|
|
|
|
Exhibit III - ENERGY MARKET> TARIFFS
|
| |
|
|
|
|
|
|
|
| Supply Tariff (R$/MWh) |
Amount |
Dec-23 |
Dec-22 |
Δ% |
Product Class* |
Validity* |
| Average MW |
| Copel Geração e Transmissão |
|
|
|
|
|
|
|
| Auction CCEAR 2011 - 2040 ( HPP Mauá) |
102 |
290.10 |
278.14 |
4.3% |
SP100 |
07.01.2020 |
12.31.2040 |
| Auction CCEAR 2013 - 2042 (SHP Cavernoso II) |
8 |
315.25 |
302.37 |
4.3% |
SP100 |
01.01.2018 |
12.31.2042 |
| Auction - CCEAR 2015 - 2044 (HPP Colíder) |
130 |
221.22 |
211.95 |
4.4% |
SP89 |
01.01.2019 |
12.31.2044 |
| Auction - CCEAR 2018 - 2048 (HPP Baixo Iguaçu) |
38 |
231.28 |
221.22 |
4.5% |
SP89 |
11.12.2018 |
11.11.2048 |
| Auction - CCEAR 2024 - 2053 (SHP Bela Vista) |
15 |
261.78 |
0.00 |
0.0% |
- |
- |
- |
| Copel Distribuição |
|
|
|
|
|
|
|
| Concession holders in the State of Paraná |
17 |
262.42 |
262.70 |
-0.1% |
- |
- |
- |
| Total / Tariff Weighted Average Supply |
257 |
303.25 |
277.10 |
9.4% |
- |
- |
- |
| Contains PIS and COFINS. Net of ICMS. |
|
|
|
|
|
|
|
*GSF renegotiation
|
|
|
|
| |
|
|
|
|
|
|
|
| Purchase Tariff - Copel Distribuição (R$/MWh) |
Amount |
Mar-24 |
Mar-23 |
Δ% |
|
|
|
| Average MW |
|
|
|
| Itaipu 1 |
491.6 |
204.60 |
181.66 |
12.6% |
|
|
|
| Auction – CCEAR 2010 – H30 |
75.5 |
301.38 |
289.97 |
3.9% |
|
|
|
| Auction – CCEAR 2010 – T15 2 |
60.1 |
195.94 |
185.46 |
5.7% |
|
|
|
| Auction – CCEAR 2011 – H30 |
62.3 |
310.73 |
298.96 |
3.9% |
|
|
|
| Auction – CCEAR 2011 – T15 2 |
53.7 |
263.79 |
237.56 |
11.0% |
|
|
|
| Auction – CCEAR 2012 – T15 2 |
107.5 |
184.06 |
171.88 |
7.1% |
|
|
|
| Auction – CCEAR 2016 – T20 2 |
26.6 |
(114.53) |
219.77 |
-152.1% |
|
|
|
| Angra |
97.7 |
344.81 |
328.91 |
4.8% |
|
|
|
| CCGF 3 |
481.5 |
160.60 |
146.89 |
9.3% |
|
|
|
| Santo Antônio |
148.8 |
192.84 |
185.53 |
3.9% |
|
|
|
| Jirau |
247.5 |
169.67 |
163.25 |
3.9% |
|
|
|
| Others Auctions 4 |
783.4 |
216.86 |
207.59 |
4.5% |
|
|
|
| Total /Average Purchuse Tariff |
2,636.0 |
203.69 |
192.66 |
5.7% |
|
|
|
| Contains PIS and COFINS |
|
|
|
| 1Furnas transport charge not included. |
|
|
|
| 2 Average auction price restated according as bilateral payment to vendors. It does not include hiring effects recorded by the CCEE. |
|
|
|
| 3 Contract of quotas of assured power of those HPPs which concessions were extended pursuant the new rules of Law 12783/13. |
|
|
|
| 4 Products average price, does not include PROINFA. |
|
|
|
| *The table has been updated for all periods as new calculation methodology for average prices, a result of the 4th phase of the Public Hearing 78/2011 Aneel approved on 03.28.2016. |
|
|
|
| |
|
|
|
|
|
|
|
| Retail Tariff - Copel Distribuição (R$/MWh) |
|
Mar-24 |
Mar-23 |
Δ% |
|
|
|
| |
|
|
|
| Industrial |
|
551.56 |
503.86 |
9.5% |
|
|
|
| Residential |
|
545.20 |
529.5 |
3.0% |
|
|
|
| Commercial |
|
614.07 |
607.35 |
1.1% |
|
|
|
| Rural |
|
596.54 |
571.89 |
4.3% |
|
|
|
| Other |
|
467.64 |
410.91 |
13.8% |
|
|
|
| Retail Tariffsupply average tariff |
|
616.50 |
586.37 |
5.1% |
|
|
|
| Demand average tariff (R$/kW) |
|
38.16 |
30.08 |
26.9% |
|
|
|
| Does not consider tariff flags, Pis/Pasep and net of ICMS. |
|
|
|
|
Exhibit III - ENERGY MARKET> ELECTRICITY PURCHASED
AND CHARGES
|
| |
|
|
|
|
|
R$'000 |
| Electricity Purchased for Resale |
|
|
|
1Q24 |
1Q23 |
Δ% |
| Purchase of energy in the regulated party - CCEAR |
|
|
|
955,517 |
925,468 |
3.4 |
| Itaipu Binacional |
|
|
|
213,086 |
212,917 |
(32.9) |
| Câmara de Comercialização de Energia - CCEE |
|
|
|
65,834 |
99,546 |
16.5 |
| Micro and mini generators and customer repurchase |
|
|
|
427,943 |
249,169 |
66.6 |
| Proinfa |
|
|
|
84,217 |
91,413 |
(15.3) |
| Bilateral Agreements |
|
|
|
403,569 |
451,943 |
(23.4) |
| Fair value in the purchase and sale of energy |
|
|
|
12,839 |
- |
- |
| (-) PIS/Pasep and Cofins |
|
|
|
(189,538) |
(209,478) |
(14.7) |
| TOTAL |
|
|
|
1,973,467 |
1,820,978 |
(4.7) |
| |
|
|
|
|
|
|
| |
|
|
|
|
|
R$'000 |
| Charges of the main distribution and transmission grid |
|
|
|
1Q24 |
1Q23 |
Δ% |
| Itaipu transportation charges |
|
|
|
(53,116) |
(36,712) |
25.7 |
| System Service Charges - ESS |
|
|
|
(13,083) |
(4,039) |
(76.7) |
| System usage charges |
|
|
|
(662,464) |
(571,152) |
25.8 |
| Charge reserve energy - EER |
|
|
|
(105,679) |
(138,655) |
52.3 |
| System usage charges - Provisions |
|
|
|
(51) |
(2,189) |
470.7 |
| (-) PIS / Pasep and Cofins taxes on charges for use of power grid |
|
|
|
86,319 |
76,289 |
16.1 |
| TOTAL |
|
|
|
(748,074) |
(676,458) |
10.6 |
|
Exhibit III - ENERGY MARKET> ENERGY BALANCE
|
| |
|
|
|
|
(average MW) |
| Energy Balance - Copel GET - Mar-24 |
2024 |
2025 |
2026 |
2027 |
2028 |
| Own Resources GeT |
2,090 |
2,061 |
2,067 |
2,070 |
2,078 |
| GeT (1) |
1,491 |
1,469 |
1,472 |
1,465 |
1,453 |
| GPS (CCGF) (2) |
73 |
73 |
73 |
73 |
73 |
| Bela Vista + FDA |
526 |
519 |
522 |
532 |
552 |
| Own Resources SPP and Wind Farm |
544 |
544 |
544 |
544 |
544 |
| Purchases |
72 |
61 |
- |
- |
- |
| TOTAL OWN RESOURCES + SOLD |
2,706 |
2,666 |
2,611 |
2,614 |
2,622 |
| TOTAL SOLD |
2,337 |
2,177 |
1,646 |
1,434 |
1,190 |
| Sales (Regulated) |
766 |
781 |
781 |
781 |
780 |
| Sales (Regulated) % |
28% |
29% |
30% |
30% |
30% |
| Sales (Free Market) |
1,571 |
1,396 |
865 |
653 |
410 |
| Sales (Free Market) % |
59% |
53% |
34% |
25% |
16% |
| Total Available |
368 |
488 |
964 |
1179 |
1430 |
| Total Available (%) |
13% |
18% |
36% |
45% |
54% |
| Avarege price of energy sold (R$) |
174.86 |
171.55 |
179.26 |
184.66 |
197.86 |
| Reference: March/24 |
| Note: Considers Assured Power updated by Ordinance No. 709/2022 for: FDA, Segredoand Salto Caxias. |
| (1) Includes Mauá and Baixo Iguaçu Power Plants (proportional to the stake in the project) and GPS 30% (ex-CCGF). Does not include Elejor and Foz do Chopim. |
| (2) GPS 70% (quota regime). |
| (3) Does not include Voltália Wind Complex. |
| (3) The GPS CCGF RAG is not considered in the calculation of average prices. |
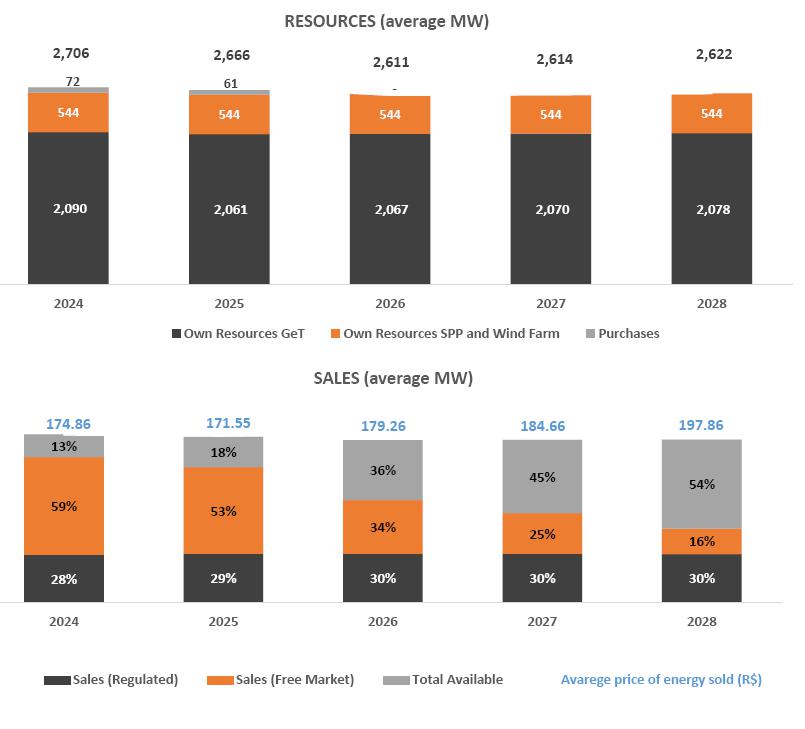
Comments:
1- Excluding losses and internal consumption.
2- Considering the GFs of wind SPEs constant for all periods.
3- Considering the Sales of wind SPEs constant for all periods.
4- Considering energy purchases in each period.
5 - Prices updated according to the contractual readjustment index, from the reference dates until March/2024.
6 - The GPS CCGF RAG is not considered in the calculation of average prices.
7 - Average gross energy prices (with PIS/COFINS and without ICMS)
8- Considers Assured Power updated by Ordinance No. 709/2022 for: FDA, Segredo and Salto Caxias.
|
Exhibit III - ENERGY MARKET> WIND POWER PRICES
|
| |
|
|
|
|
|
| Wind Farms - Sold |
Auction ¹ |
Price (R$)² |
Amount
MW average/year |
Start ofSupply |
End of
Supply |
| São Bento Energia, Invest. e Part. S.A. |
|
|
|
|
|
| GE Boa Vista S.A. |
2º LFA
(08/26/2010) |
304.68 |
5.70 |
01.01.2013 |
12.31.2032 |
| GE Farol S.A. |
295.80 |
9.10 |
| GE Olho D’Água S.A. |
295.80 |
14.90 |
| GE São Bento do Norte S.A. |
295.80 |
14.00 |
| Copel Brisa Potiguar S.A. |
|
|
|
|
|
| Nova Asa Branca I Energias Renováveis S.A. |
2º LFA
(08/26/2010) |
298.96 |
13.20 |
01.01.2013 |
12.31.2032 |
| Nova Asa Branca II Energias Renováveis S.A. |
298.96 |
12.80 |
| Nova Asa Branca III Energias Renováveis S.A. |
298.96 |
12.50 |
| Nova Eurus IV Energias Renováveis S.A. |
298.96 |
13.70 |
| Santa Maria Energias Renováveis S.A. |
4º LER
(08/18/2011) |
210.69 |
15.70 |
07.01.2014 |
06.30.2034 |
| Santa Helena Energias Renováveis S.A. |
210.69 |
16.00 |
| Ventos de Santo Uriel S.A. |
209.06 |
9.00 |
| Cutia |
|
|
|
|
|
| UEE Cutia S.A. |
6º LER
(10/31/2014) |
247.83 |
9.60 |
10.01.2017 |
09.30.2037 |
| UEE Esperança do Nordeste S.A. |
247.83 |
9.10 |
| UEE Guajiru S.A. |
247.83 |
8.30 |
| UEE Jangada S.A. |
247.83 |
10.30 |
| UEE Maria Helena S.A. |
247.83 |
12.00 |
| UEE Paraíso dos Ventos do Nordeste S.A. |
247.83 |
10.60 |
| UEE Potiguar S.A. |
247.83 |
11.30 |
| Bento Miguel |
|
|
|
|
|
| CGE São Bento do Norte I S.A. |
20ª LEN
(11/28/2014) |
234.75 |
9.70 |
01.01.2019 |
12.31.2038 |
| CGE São Bento do Norte II S.A. |
234.75 |
10.00 |
| CGE São Bento do Norte III S.A. |
234.75 |
9.60 |
| CGE São Miguel I S.A. |
234.75 |
8.70 |
| CGE São Miguel II S.A. |
234.75 |
8.40 |
| CGE São Miguel III S.A. |
234.75 |
8.40 |
| Vilas |
|
|
|
|
|
| Vila Ceará I (Antiga Vila Paraíba IV) |
28ª LEN
(08/31/2018) |
126.22 |
8.20 |
01.01.2024 |
12.31.2043 |
| Vila Maranhão I |
126.22 |
8.30 |
| Vila Maranhão II |
126.22 |
8.30 |
| Vila Maranhão III (Antiga Vila Paraíba III) |
126.22 |
8.20 |
| Vila Mato Grosso (Antiga Vila Alagoas III) |
29ª LEN
(06/28/2019) |
105.29 |
3.30 |
01.01.2023 |
12.31.2042 |
| Jandaira |
|
|
|
|
|
| Jandaira I |
30ª LEN
(10/18/2019) |
128.77 |
1.60 |
01.01.2025 |
12.31.2044 |
| Jandaira II |
128.77 |
4.10 |
| Jandaira III |
128.77 |
4.40 |
| Jandaira IV |
128.77 |
4.30 |
| Aventura |
|
|
|
|
|
| Aventura II |
26º LEN
(20/12/2017) |
136.12 |
11.70 |
01.01.2023 |
12.31.2042 |
| Aventura III |
136.12 |
12.80 |
| Aventura IV |
136.12 |
14.10 |
| Aventura V |
136.12 |
15.00 |
| Santa Rosa & Mundo Novo |
|
|
|
|
|
| Santa Rosa & Mundo Novo I |
26º LEN
(20/12/2017) |
138.93 |
16.50 |
01.01.2023 |
12.31.2042 |
| Santa Rosa & Mundo Novo II |
138.93 |
17.00 |
| Santa Rosa & Mundo Novo III |
138.93 |
18.00 |
| Santa Rosa & Mundo Novo IV |
138.93 |
7.50 |
| Santa Rosa & Mundo Novo V |
138.93 |
8.10 |
| Voltália3 |
|
|
|
|
|
| Carnaúbas |
04ª LER
(08/18/2011) |
204.37 |
13.10 |
07.01.2014 |
06.30.2034 |
| Reduto |
204.37 |
13.90 |
| Santo Cristo |
204.37 |
14.80 |
| São João |
204.37 |
14.30 |
| ¹LFA - Alternative Sources Auction/LER - Reserve Energy Auction/LEN - New Energy Auction. |
| ² Price updated by IPCA until mar/24 (Reference apr/24). Source: CCEE |
| 3 Values presented refer to 100% of the Complex. Copel has a 49% stake in the project. |
|
Exhibit III - ENERGY MARKET> ENERGY FLOW
|
| |
|
|
|
|
|
|
|
|
|
|
|
GWh |
| Energy Flow |
COPEL DIS |
COPEL GET
+ FDA + BELA VISTA |
WIND POWER |
COPEL COM |
ELIMINATIONS |
CONSOLIDATED |
| 1Q24 |
1Q23 |
1Q24 |
1Q23 |
1Q24 |
1Q23 |
1Q24 |
1Q23 |
1Q24 |
1Q23 |
1Q24 |
1Q23 |
| Own Generation |
|
|
5,998 |
5,498 |
641 |
833 |
|
|
|
|
6,639 |
6,331 |
| Purchased energy |
6,150 |
6,137 |
86 |
47 |
158 |
106 |
6,042 |
5,893 |
4,094 |
3,775 |
8,342 |
8,408 |
| Copel Mercado Livre |
|
|
|
|
154 |
|
|
|
154 |
0 |
0 |
0 |
| Companies of the group |
64 |
55 |
|
|
|
106 |
3,876 |
3,614 |
3,940 |
3,775 |
0 |
0 |
| Itaipu |
1,134 |
1,174 |
|
|
|
|
|
|
|
|
1,134 |
1,174 |
| Auction – CCEAR |
3,390 |
3,358 |
|
|
|
|
|
|
|
|
3,390 |
3,358 |
| CCEE (MCP) |
182 |
0 |
|
|
|
|
|
|
|
|
182 |
0 |
| Angra |
213 |
215 |
|
|
|
|
|
|
|
|
213 |
215 |
| CCGF |
1,048 |
1,216 |
|
|
|
|
|
|
|
|
1,048 |
1,216 |
| Proinfa |
106 |
101 |
|
|
|
|
|
|
|
|
106 |
101 |
| Other (1) |
13 |
18 |
|
|
4 |
0 |
2,166 |
2,269 |
|
|
2,183 |
2,287 |
| Elejor |
|
|
|
|
|
|
|
10 |
|
|
0 |
10 |
| Dona Francisca |
|
|
33 |
33 |
|
|
|
|
|
|
33 |
33 |
| MRE Receipt |
|
|
53 |
14 |
|
|
|
|
|
|
53 |
14 |
| Avaiable |
6,150 |
6,137 |
6,084 |
5,545 |
799 |
939 |
6,042 |
5,893 |
4,094 |
3,775 |
14,981 |
14,739 |
| Captive Market |
5,753 |
5,150 |
|
|
|
|
|
|
|
|
5,753 |
5,150 |
| Concessionaires (2) |
24 |
22 |
|
|
|
|
|
|
|
|
24 |
22 |
| CCEE concessionaire supply (3) |
|
|
46 |
47 |
|
|
|
|
|
|
46 |
47 |
| CCEE (MCSD EN Assignments) (4) |
35 |
48 |
|
|
|
|
|
|
|
|
35 |
48 |
| CCEE (MVE) (5) |
0 |
0 |
|
|
|
|
|
|
|
|
0 |
0 |
| CCEE (MCP) (6) |
47 |
435 |
199 |
313 |
77 |
127 |
67 |
146 |
|
|
390 |
1,021 |
| Free Customers |
|
|
|
|
|
|
2,608 |
2,927 |
|
|
2,608 |
2,927 |
| Bilateral Agreements |
|
|
4 |
106 |
121 |
131 |
3,213 |
2,820 |
|
106 |
3,338 |
2,951 |
| Auction – CCEAR (7) |
|
|
586 |
569 |
568 |
480 |
|
|
|
|
1,154 |
1049 |
| MRE assignment (8) |
|
|
1,427 |
985 |
|
|
|
|
|
|
1,427 |
985 |
| CER (9) |
|
|
|
|
236 |
226 |
|
|
|
|
236 |
226 |
| Copel Mercado Livre |
|
|
3,788 |
3,492 |
88 |
122 |
|
|
3,876 |
3,614 |
0 |
0 |
| Companies of the group |
|
|
34 |
33 |
31 |
23 |
154 |
|
218 |
55 |
1 |
1 |
| Losses and Differences (10) |
291 |
482 |
|
|
-322 |
-170 |
|
|
|
|
-31 |
312 |
| |
|
|
|
|
|
|
|
|
|
|
|
|
| (1) Others: Energy purchased by Copel Comercialização. Includes MCSD EM Assignments of Copel Distribuição (purchase) |
| (2) Energy supply to concessionaires and licensees with their own market below 500GWh/year |
| (3) Supply of energy to CCEE's agent distributor, through a Regulated Bilateral Contract Agreement - CBR |
| (4) Assignments MCSD EN - Contractual assignments to other distributors through the New Energy Surplus and Deficit Compensation Mechanism |
| (5) CCEE (MVE): Financial settlement of energy surpluses from the distributor to the free market through the Surplus Sale Mechanism |
| (6) CCEE (MCP): Electric Energy Commercialization Chamber (Spot Market). |
| (7) CCEAR: Energy Trading Agreement in the Regulated Environment. |
| (8) MRE: Energy Reallocation Mechanism. |
| (9) CER: Reserve Energy Contract. |
| (10) Considers the effects of Mini and Micro Distributed Generation (MMGD). |
| (11) CG: Submarket Center of Gravity (difference between billed and received energy at the CG). |
| It does not consider the energy produced by UTE Araucária sold on the spot market (MCP). |
|
Exhibit III - ENERGY MARKET> ENERGY FLOW
|
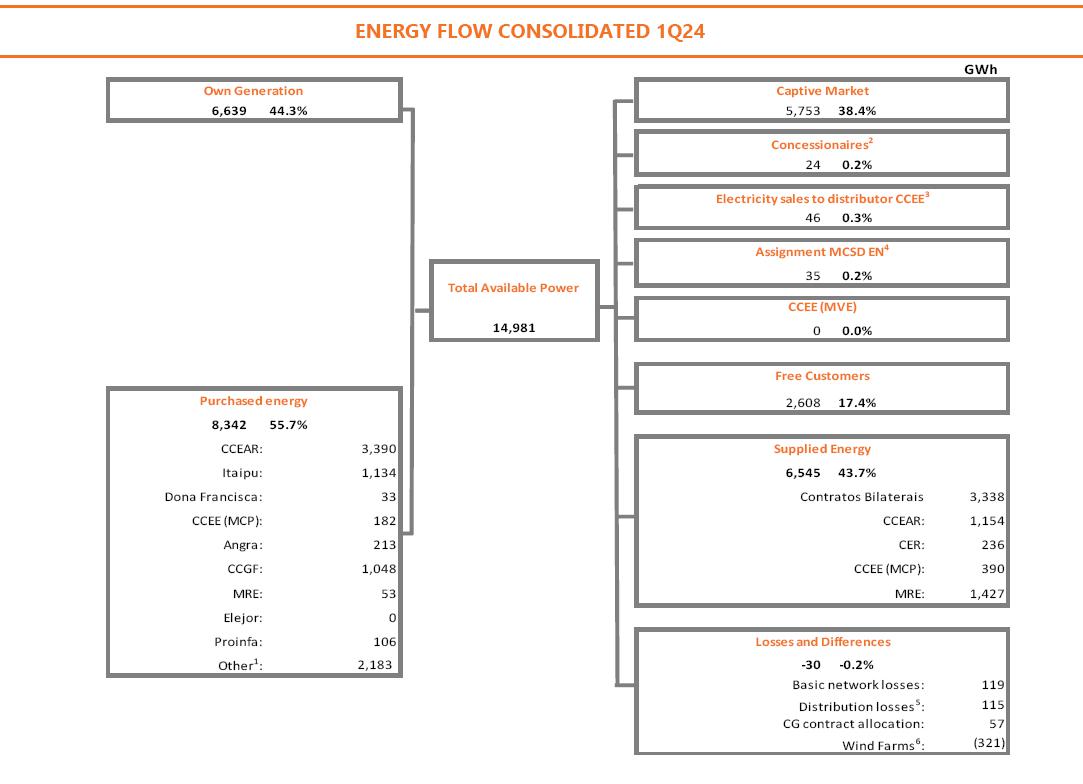
| Notes: |
| CCEAR: Energy Purchase Agreements in the Regulated Market. |
| CER: Reserve Energy Agreements. |
| MRE: Energy Reallocation Mechanism. |
| CCEE (MCP): Electric Power Trade Chamber (Short-term market). |
| CG: Center of gravity of the Submarket (difference between billed and energy received from CG). |
| ¹ Other: Energy purchased by Copel Comercialização and Copel Distribuição |
| 2 Electricity sales to concessionaries and licensees with own market of less than 500GWh/year |
| 3 Eletricity sales to the agent distributor of CCEE through a Regulated Bilateral Contract - CBR |
| 4 Assignments MCSD EN - Contractual assignments to other distributors through the Mechanism for Compensation of Surpluses and Deficits (MCSD) |
| 5 Considers the effect of Distributed Mini and Microgeneration (MMGD) |
| 6 Considers losses and the volume of energy not delivered, referring to availability contracts, which provide for subsequent reimbursement. |
| It does not consider the energy produced by TPP Araucária sold in the MCP (Short Term Market) or through bilateral contracts. |
| |
|
Exhibit IV - OPERATIONAL DATA> INDICATORS SUMMARY
|
| MANAGEMENT |
|
|
|
|
|
|
| Copel Staff List |
2019 |
2020 |
2021 |
2022 |
2023 |
mar-24 |
| Geração e Transmissão |
1,620 |
1,533 |
1,523 |
1,487 |
1,477 |
1,445 |
| Distribuição |
4,964 |
4,641 |
4,430 |
4,257 |
4,203 |
4,126 |
| Telecomunicações |
412 |
355 |
- |
- |
- |
0 |
| Holding |
61 |
96 |
169 |
84 |
83 |
80 |
| Comercialização |
38 |
42 |
44 |
47 |
41 |
43 |
| Serviços |
- |
- |
- |
217 |
- |
- |
| TOTAL |
7,095 |
6,667 |
6,166 |
6,092 |
5,804 |
5,694 |
| |
|
|
|
|
|
|
| Cotrolated Staff List |
2019 |
2020 |
2021 |
2022 |
2023 |
mar-24 |
| Compagás |
148 |
142 |
133 |
132 |
129 |
132 |
| UEG Araucária |
16 |
17 |
15 |
15 |
14 |
14 |
| Elejor |
7 |
7 |
7 |
7 |
7 |
7 |
| |
|
|
|
|
|
|
| GENERATION |
|
|
|
|
|
|
| Copel GET |
Amount |
Installed
Capacity (MW) |
Assured Power
(Average MW) |
| Hydroelectric |
18 |
|
4,868.5 |
|
2,067.9 |
|
| Thermoelectric |
1 |
|
20.0 |
|
17.7 |
|
| Wind |
43 |
|
1,130.2 |
|
561.3 |
|
Copel GET
(Interest) |
|
Proportional installed
capacity (MW) |
Proporcional Assured Power
(Average MW) |
| Hydroelectric |
3 |
|
299.6 |
|
155.2 |
|
| Thermoelectric |
1 |
|
294.8 |
|
162.6 |
|
| Total Copel GET |
|
|
6,613.1 |
|
2,964.7 |
|
| Other Interest Copel |
|
Proportional installed
capacity (MW) |
Proporcional Assured Power
(Average MW) |
| Hydroelectric |
5 |
|
201.3 |
|
109.7 |
|
| Thermoelectric |
1 |
|
98.3 |
|
54.2 |
|
| Wind |
4 |
|
53.2 |
|
28.0 |
|
| Solar |
1 |
|
1.1 |
|
- |
|
| Total Other Interest |
11 |
|
353.9 |
|
191.9 |
|
| TOTAL Copel Group |
|
|
6,967.0 |
|
3,156.6 |
|
| |
|
|
|
|
|
|
| TRANSMISSION |
|
|
|
|
|
|
| Copel GeT |
Amount |
|
APR (R$ million) |
| Transmission Lines (km) |
|
3,705 |
|
1,053.6 |
| Substation (amount) |
|
45 |
|
| Interest |
Amount |
|
Proporcional APR (R$ million) |
| Transmission Lines (km) |
|
5,980 |
|
512.6 |
| Substation (amount) |
|
8 |
|
| TOTAL |
TL |
9,685 |
|
1,566.2 |
| Substation |
53 |
|
| |
|
|
|
|
|
|
| DISTRIBUTION |
|
|
|
|
|
|
| Distribution lines (km) |
212,101 |
|
|
Captive customers |
5,118,793 |
|
| Substations |
394 |
|
|
Customers by distribution employee |
1,241 |
|
| Installed power substations (MVA) |
11,891 |
|
|
DEC (in hundredths of an hour and minute) |
8.21 |
|
| Municipalities served |
395 |
|
|
FEC (number of outages) |
5.37 |
|
| Locations served |
1,068 |
|
|
|
|
|
| |
|
|
|
|
|
|
| MERCADO LIVRE |
|
|
|
|
|
|
| Number of contracts |
1,487 |
|
|
|
|
|
| Energy sold (GWh) |
6,042 |
|
|
|
|
|
| |
|
|
|
|
|
|
|
Exhibit IV - OPERATIONAL DATA> GENERATION
|
| COPEL GET |
|
|
|
|
| |
Installed
Capacity (MW) |
Assured Power
(Average MW) |
Generation 1Q24
(GWh)* |
Concession Expires |
| Hydroelectric Power Plants |
4,868.5 |
2,067.9 |
6,040.2 |
|
| Large hydroelectric power plant (HPP) |
4,772.0 |
2,006.8 |
5,929.9 |
|
| Gov. Bento Munhoz da Rocha Netto (Foz do Areia)(5) |
1,676.0 |
575.3 |
1,726.8 |
12.21.2024 |
| Gov. Ney Aminthas de B. Braga (Segredo)(5) |
1,260.0 |
558.3 |
1,802.6 |
09.25.2032 |
| Gov. José Richa (Salto Caxias)(5) |
1,240.0 |
575.4 |
1,642.5 |
03.20.2033 |
| Gov. Parigot de Souza (1)(5) |
260.0 |
103.6 |
350.8 |
01.03.2053 |
| - Regime de Cotas (70%) |
182.0 |
72.5 |
245.6 |
| - Copel GeT(30%) |
78.0 |
31.1 |
105.3 |
| Colíder(5) |
300.0 |
178.1 |
365.0 |
01.30.2046 |
| Guaricana(5) |
36.0 |
16.1 |
42.1 |
07.21.2028 |
| Small hydroelectric power station (SHP) |
86.9 |
55.9 |
100.0 |
|
| Bela Vista(2) |
29.8 |
18.6 |
22.7 |
01.02.2041 |
| Cavernoso (5) |
1.3 |
1.0 |
0.3 |
06.23.2033 |
| Cavernoso II(5) |
19.0 |
10.6 |
16.0 |
12.06.2050 |
| Chaminé (5) |
18.0 |
11.6 |
28.7 |
08.02.2028 |
| Apucaraninha (5) |
10.0 |
6.7 |
15.9 |
01.27.2027 |
| Derivação do Rio Jordão (5) |
6.5 |
5.9 |
12.3 |
06.21.2032 |
| São Jorge (5) |
2.3 |
1.5 |
3.9 |
07.24.2026 |
| hydroelectric power plant (HPP) |
9.6 |
5.2 |
10.4 |
|
| Marumbi |
4.8 |
2.4 |
7.4 |
(6) |
| Chopim I |
2.0 |
1.5 |
1.2 |
(3) |
| Melissa |
1.0 |
0.6 |
0.2 |
(3) |
| Salto do Vau |
0.9 |
0.6 |
1.7 |
(3) |
| Pitangui |
0.9 |
0.1 |
- |
(3) |
| Thermal Power Plant |
20.0 |
17.7 |
3.0 |
|
| Figueira |
20.0 |
17.7 |
3.0 |
03.27.2019 |
| Wind Power Plants |
1,130.2 |
561.3 |
690.4 |
|
| Eólica de Palmas (4) |
2.5 |
0.4 |
0.6 |
09.29.2029 |
| São Bento Energia, Invest. e Part. S.A. |
94.0 |
38.1 |
58.4 |
|
| GE Boa Vista S.A. |
14.0 |
5.2 |
6.3 |
04.28.2046 |
| GE Farol S.A. |
20.0 |
8.8 |
12.1 |
04.20.2046 |
| GE Olho D’Água S.A. |
30.0 |
12.8 |
20.4 |
06.01.2046 |
| GE São Bento do Norte S.A. |
30.0 |
11.3 |
19.6 |
05.19.2046 |
| Copel Brisa Potiguar S.A. |
183.6 |
89.4 |
79.6 |
|
| Nova Asa Branca I Energias Renováveis S.A. |
27.0 |
12.1 |
11.9 |
04.25.2046 |
| Nova Asa Branca II Energias Renováveis S.A. |
27.0 |
11.9 |
10.6 |
05.31.2046 |
| Nova Asa Branca III Energias Renováveis S.A. |
27.0 |
12.3 |
8.7 |
05.31.2046 |
| Nova Eurus IV Energias Renováveis S.A. |
27.0 |
12.4 |
12.0 |
04.27.2046 |
| Santa Maria Energias Renováveis S.A. |
29.7 |
15.7 |
10.1 |
05.08.2047 |
| Santa Helena Energias Renováveis S.A. |
29.7 |
16.0 |
17.3 |
04.09.2047 |
| Ventos de Santo Uriel S.A. |
16.2 |
9.0 |
9.1 |
04.09.2047 |
| Complexo Eólico Cutia |
180.6 |
71.4 |
111.3 |
|
| UEE Cutia S.A. |
23.1 |
9.6 |
14.1 |
01.05.2042 |
| UEE Esperança do Nordeste S.A. |
27.3 |
9.1 |
14.3 |
05.11.2050 |
| UEE Guajiru S.A. |
21.0 |
8.3 |
11.3 |
01.05.2042 |
| UEE Jangada S.A. |
27.3 |
10.3 |
18.8 |
01.05.2042 |
| UEE Maria Helena S.A. |
27.3 |
12.0 |
17.1 |
01.05.2042 |
| UEE Paraíso dos Ventos do Nordeste S.A. |
27.3 |
10.6 |
17.6 |
05.11.2050 |
| UEE Potiguar S.A. |
27.3 |
11.5 |
18.0 |
05.11.2050 |
| Complexo Eólico Bento Miguel |
132.3 |
58.7 |
72.9 |
|
| CGE São Bento do Norte I S.A. |
23.1 |
10.1 |
13.7 |
08.04.2050 |
| CGE São Bento do Norte II S.A. |
23.1 |
10.8 |
13.4 |
08.04.2050 |
| CGE São Bento do Norte III S.A. |
23.1 |
10.2 |
13.9 |
08.04.2050 |
| CGE São Miguel I S.A. |
21.0 |
9.3 |
11.2 |
08.04.2050 |
| CGE São Miguel II S.A. |
21.0 |
9.1 |
10.4 |
08.04.2050 |
| CGE São Miguel III S.A. |
21.0 |
9.2 |
10.3 |
08.04.2050 |
| Complexo Eólico Vilas (8) |
186.7 |
98.6 |
114.7 |
|
| Vila Ceará I (Antiga Vila Paraíba IV) |
32.0 |
17.8 |
21.0 |
01.14.2054 |
| Vila Maranhão I |
32.0 |
17.8 |
20.8 |
01.11.2054 |
| Vila Maranhão II |
32.0 |
17.8 |
20.2 |
01.14.2054 |
| Vila Maranhão III (Antiga Vila Paraíba III) |
32.0 |
16.6 |
19.7 |
01.14.2054 |
| Vila Mato Grosso (Antiga Vila Alagoas III) |
58.9 |
28.6 |
33.1 |
12.06.2054 |
| Complexo Jandaira |
90.1 |
46.9 |
53.3 |
|
| Jandaira I |
10.4 |
5.6 |
7.7 |
04.02.2055 |
| Jandaira II |
24.3 |
12.3 |
15.1 |
04.02.2055 |
| Jandaira III |
27.7 |
14.8 |
16.9 |
04.02.2055 |
| Jandaira IV |
27.7 |
14.2 |
13.5 |
04.02.2055 |
| Aventura 9 |
105.0 |
65.0 |
84.5 |
|
| Aventura II |
21.0 |
13.1 |
16.9 |
06.05.2053 |
| Aventura III |
25.2 |
15.5 |
19.6 |
06.11.2053 |
| Aventura IV |
29.4 |
18.5 |
24.9 |
06.05.2053 |
| Aventura V |
29.4 |
17.9 |
23.0 |
06.05.2053 |
| Santa Rosa e Mundo Novo 9 |
155.4 |
92.8 |
115.2 |
|
| Santa Rosa e Mundo Novo I |
33.6 |
17.3 |
18.9 |
06.04.2053 |
| Santa Rosa e Mundo Novo II |
29.4 |
17.2 |
24.1 |
06.04.2053 |
| Santa Rosa e Mundo Novo III |
33.6 |
21.5 |
27.4 |
06.04.2053 |
| Santa Rosa e Mundo Novo IV |
33.6 |
21.0 |
26.5 |
06.01.2053 |
| Santa Rosa e Mundo Novo V |
25.2 |
15.8 |
18.3 |
06.01.2053 |
| TOTAL |
6,018.7 |
2,646.9 |
6,733.7 |
|
(1) RAG of R$160.9 million, updated by Aneel's Resolution No. 3,225, of July 18, 2023.
(2) In partial operation, entry into commercial operation of the fourth generating unit scheduled for 2022.
(3) Power plants exempted from concession, are only registered with ANEEL.
(4) Assured power considered the average wind generation.
(5) Extension of Grant according to REH 2919/2021, 2932/2021 and 3.242/2023.
(6) Under approval by ANEEL. |
(7) Assured Power updated by Ordinance N°709/2022 for: FDA, Segredo, Salto Caxias and GPS, effective from January/2023.
(8) Started up in test operation on 04/25/2022, according to ANEEL Dispatch No. 1047/2022. In commercial operation since 12/07/2022, by ANEEL order No. 2502/2022.
(9) Complexes Aventura and Santa Rosa & Novo Mundo joined the Company's portfolio in Jan/23.
* Considers internal consumption of generators and generation in commercial operation.
** Plant do not participate in the MRE. |
|
Exhibit IV - OPERATIONAL DATA> GENERATION
|
| INTEREST |
|
|
|
|
|
|
| Enterprise |
Partners |
Installed
Capacity (MW) |
Assured Power 1
(Average MW) |
Proportional installed capacity (MW) |
Proporcional Assured Power
(Average MW) |
Concession Expires |
| Hydroelectric Power Plants |
|
1,111.7 |
586.8 |
500.9 |
264.9 |
|
| Large hydroelectric power plant (HPP) |
|
1,076.5 |
561.5 |
486.2 |
254.2 |
|
HPP Gov. Jayme Canet Junior (Mauá) 6
(Consórcio Energético Cruzeiro do Sul) |
COPEL GeT - 51%
Eletrosul - 49% |
361.0 |
188.5 |
184.1 |
96.1 |
06.28.2049 |
HPP Baixo Iguaçu
(Consórcio Empreendedor Baixo Iguaçu) |
COPEL GeT - 30%
Geração Céu Azul - 70% |
350.2 |
172.4 |
105.1 |
51.7 |
12.03.2049 |
HPP Santa Clara
(Elejor) |
COPEL - 70%
Paineira Participações - 30% |
120.2 |
66.0 |
84.2 |
46.2 |
05.10.2040 |
HPP Fundão
(Elejor) |
COPEL - 70%
Paineira Participações - 30% |
120.2 |
62.1 |
84.1 |
43.5 |
06.11.2040 |
HPP Dona Francisca
(DFESA) |
COPEL - 23,03%
Gerdau - 51,82%
Celesc - 23,03%
Statkraft - 2,12% |
125.0 |
72.5 |
28.8 |
16.7 |
09.21.2037 |
| Small hydroelectric power station (SHP) |
|
29.1 |
20.4 |
10.4 |
7.3 |
|
SHP Arturo Andreoli 6
(Foz do Chopim) |
COPEL GeT - 35,77%
Silea Participações - 64,23% |
29.1 |
20.4 |
10.4 |
7.3 |
07.07.2034 |
| Hydroelectric Generating Centers (CGH) |
|
6.1 |
4.9 |
4.3 |
3.4 |
|
CGH Santa Clara I
(Elejor) |
COPEL - 70%
Paineira Participações - 30% |
3.6 |
2.8 |
2.5 |
2.0 |
(2) |
CGH Fundão I
(Elejor) |
COPEL - 70%
Paineira Participações - 30% |
2.5 |
2.1 |
1.7 |
1.5 |
(2) |
| Thermal Power Plant |
|
484.2 |
267.0 |
393.1 |
216.8 |
|
TPP Araucária 3
(UEG Araucária) |
COPEL - 20,3%
COPEL GeT - 60,9%
Petrobras - 18,8% |
484.2 |
267.0 |
393.1 |
216.8 |
12.23.2029 |
| Wind Power Plants |
|
108.0 |
57.1 |
52.9 |
28.0 |
|
Voltalia - São Miguel
do Gostoso (5 parques) |
COPEL- 49%
Voltalia-51% |
108.0 |
57.1 |
52.9 |
28.0 |
(4) |
| Solar |
|
2.3 |
- |
1.1 |
- |
|
| Solar Paraná 5 |
COPEL - 49% |
2.3 |
- |
1.1 |
- |
09.15.2046 |
| TOTAL |
|
1,706.2 |
910.9 |
948.0 |
509.7 |
|
| 1 Assured power updated by Ordinance No. 709/2022 of: HPP Mauá, Santa Clara, Fundão and Dona Francisca. |
| 2Elejor requested the reclassification of its Small Hydroelectric Power Plants - (SHPs) Fundão I and Santa Clara I to Hydroelectric Generating Centers (CGHs), as amended by Art. 8 of Law 9074/1995. This was formalized through ANEEL Authorizing Resolutions 14,744 and 14,745 of 06/20/2023, with the plants exempted from concession, having only registration with ANEEL. |
| 3Since February 1, 2014, the plant’s operation has been under the responsibility of UEGA. The Araucária TPP does not have availability agreements and operates under the merchant model. The most recent data from SIGA/ANEEL indicate aAssured power of 267 MW, however, there is no Assured power for the operation of the plant under the terms of MME Ordinance No. 64/2023. |
| 4 The Concession Expires of the wind farm concessions are respectively: Carnaúbas (04.09.2047), Reduto (04.16.2047), Santo Cristo (04.18.2047), São João (03.26.2047). |
| 5 Holding of 6 SCPs operating in the field of distributed generation (photovoltaic plants): Pharma Solar II, Pharma Solar III, Pharma Solar IV, in commercial operation, e Bandeirantes Solar I, Bandeirantes Solar II e Bandeirantes Solar III, in pre-operational. |
| 6Extension of Grant according to REH 3.242/2023. |
|
Exhibit IV - OPERATIONAL DATA > TRANSMISSION
|
| |
|
|
|
|
|
|
|
| Subsidiary / SPC |
Contract |
Enterprise |
TL |
|
APR ¹ (R$ milhões) |
Concession Expiration |
| Extension (km)2 |
Amount |
MVA |
| Copel GeT |
060/20013 |
Several |
2,129 |
35 |
12,815 |
665.7 |
01.01.2043 |
| Copel GeT |
075/20014 |
TL Bateias - Jaguariaiva |
138 |
- |
- |
16.8 |
08.17.2031 |
| Copel GeT |
006/2008 |
TL Bateias - Pilarzinho |
32 |
- |
- |
3.6 |
03.17.2038 |
| Copel GeT |
027/2009 |
TL Foz - Cascavel Oeste |
117 |
- |
- |
16.0 |
11.19.2039 |
| Copel GeT |
010/2010 |
TL Araraquara II — Taubaté |
334 |
- |
- |
43.6 |
10.06.2040 |
| Copel GeT |
015/2010 |
SE Cerquilho III |
- |
1 |
300 |
7.0 |
10.06.2040 |
| Copel GeT |
022/2012 |
TL Foz do Chopim - Salto Osório
LT Londrina - Figueira |
102 |
- |
- |
7.8 |
08.27.2042 |
| Copel GeT |
002/2013 |
TL Assis — Paraguaçu Paulista II |
83 |
1 |
150 |
12.2 |
02.25.2043 |
| Copel GeT |
005/2014 |
TL Bateias - Curitiba Norte |
31 |
1 |
300 |
12.9 |
01.29.2044 |
| Copel GeT |
021/2014 |
TL Foz do Chopim - Realeza |
52 |
1 |
300 |
13.0 |
09.05.2044 |
| Copel GeT |
022/2014 |
TL Assis – Londrina |
122 |
- |
- |
27.1 |
09.05.2044 |
| Copel GeT |
006/165 |
Lot E: TL Baixo Iguaçu - Realeza; TL Uberaba - Curitiba Centro; TL Curitiba Leste - Blumenau; SE Medianeira; SE Curitiba Centro; SE Andirá leste; Other Sections |
255 |
4 |
900 |
154.8 |
04.07.2046 |
Costa Oeste
Copel Get - 100% |
001/2012 |
TL Cascavel Norte - Cascavel Oeste
TL Cascavel Norte - Umuarama Sul
SE Umuarama Sul |
159 |
1 |
300 |
19.0 |
01.12.2042 |
Marumbi
Copel GeT - 100% |
008/2012 |
TL Curitiba - Curitiba Leste |
29 |
1 |
672 |
27.3 |
05.10.2042 |
Uirapuru Transmissora
Copel GeT - 100% |
002/20056 |
TL Ivaiporã - Londrina |
122 |
- |
- |
26.9 |
03.04.2035 |
| Subtotal Copel GeT 7 |
|
|
3,705 |
45 |
15,737 |
1,053.6 |
|
Caiuá Transmissora
Copel GeT - 49%
Elecnor - 51% |
007/2012 |
TL Guaíra - Umuarama Sul
TL Cascavel Norte - Cascavel Oeste
SE Santa Quitéria / SE Cascavel Norte |
142 |
2 |
700 |
16.4 |
05.10.2042 |
Integração Maranhense
Copel GeT - 49%
Elecnor - 51% |
011/2012 |
TL Açailandia - Miranda II |
365 |
- |
- |
24.7 |
05.10.2042 |
Matrinchã
Copel GeT - 49%
State Grid - 51% |
012/2012 |
TL Paranaíta - Ribeirãozinho |
2,033 |
4 |
800 |
133.7 |
05.10.2042 |
Guaraciaba
Copel GeT - 49%
State Grid - 51% |
013/2012 |
TL Ribeirãozinho - Marimbondo |
930 |
1 |
- |
69.0 |
05.10.2042 |
Paranaíba
Copel GeT - 24,5%
Furnas - 24,5%
State Grid - 51% |
007/2012 |
TL Barreiras II - Pirapora II |
967 |
- |
- |
44.5 |
05.02.2043 |
Cantareira
Copel GeT - 49%
Elecnor - 51% |
19/2014 |
TL Estreito - Fernão Dias |
656 |
- |
- |
68.1 |
09.05.2044 |
Mata de Santa Genebra
Copel GeT - 50,1%
Furnas - 49,9% |
001/14 |
TL Araraquara II - Bateias |
887 |
1 |
3,600 |
156.4 |
05.14.2044 |
| Subtotal SPCs 8 |
|
|
5,980 |
8 |
5,100 |
512.6 |
|
| Total |
|
|
9,685 |
53 |
20,837 |
1,566.2 |
|
1 Proportional to Copel's interest in the project. Values referring to the 2023/2024 cycle, effective from July 1, 2023, according to REH 3.216/2023 - Technical Note No. 39/2023 – STR/ANEEL, of December 30, 2023. Considers investments that came into operation until 03/31/2024.
² Considers double circuit sections (circuits that share the same transmission tower).
³ Contract renewed according to Law 12,783/13. The O&M portion is part of the RBSE, under the terms of the Law. It will be received until the end of the concession (Jan/2043). The value of the APR for the 2023-2024 cycle, excluding the RBSE, according to REH 3,216/2023, is R$ 146.1 million. This amount refers to additional RAP for reinforcements and improvements, in effect when REH 3,216/2023 was published.
4 As of 10.31.2018, the APR was reduced by 50%.
5 The construction of 38 km of sectioning lines was foreseen in the implementation of the Andirá Leste and Medianeira SEs, 2 km of which for Contract 060/2001 and 36 km for LTs that do not belong to Copel GeT, which, despite being included in the APR, in reason for the investment made, will not be added to Copel's assets.
6 As of 07/09/2021, the APR was reduced by 50%.
7 Consolidated Result.
8 Equity Income. |
|
Exhibit IV - OPERATIONAL DATA > DISTRIBUTION
|
| OPERATIONAL DATA |
|
|
|
|
|
|
| |
|
|
|
|
|
|
| Number of Consumers |
Locations served |
Cities served |
Voltage |
Number of Substations |
MVA |
Km of lines |
| 5,118,793 |
1,068 |
395 |
13,8 kV |
- |
- |
113,146 |
| 34,5 kV |
236 |
1,694 |
91,409 |
| 69 kV |
36 |
2,477 |
778 |
| 88 kV |
- |
5 |
- |
| 138 kV |
122 |
7,715 |
6,768 |
| |
|
|
|
394 |
11,891 |
212,101 |
| Consumer-to-employee ratio DIS |
2019 |
2020 |
2021 |
2022 |
2023 |
Mar-24 |
Captive Consumers |
4,713,240 |
4,835,852 |
4,926,608 |
5,011,555 |
5,098,006 |
5,118,793 |
| Copel Dis employees |
4,964 |
4,641 |
4,430 |
4,257 |
4,203 |
4,126 |
| Consum/Emp |
949 |
1,042 |
1,112 |
1,177 |
1,213 |
1,241 |
| |
|
|
|
|
|
|
| QUALITY OF SUPPLY |
|
|
|
|
|
|
| |
|
|
|
|
|
|
| |
Year |
DEC ¹
(hours) |
FEC ²
(outages) |
|
|
|
| |
2020 |
7.83 |
5.61 |
|
|
|
| |
2021 |
7.20 |
4.76 |
|
|
|
| |
2022 |
7.98 |
5.29 |
|
|
|
| |
2023 |
7.86 |
5.21 |
|
|
|
| |
Mar-24 |
8.21 |
5.37 |
|
|
|
¹DEC measured in hours and hundredths of an hour
²FEC expressed in number of interruptions and hundredths of a number of interruptions year to date
* Values of the last 12 months |
|
|
|
| Period |
Technical Loss |
Non-Technical Loss |
Total loss |
| Regulatory (1) |
Real (2) |
Regulatory (3) |
Calculated (4) |
Regulatory (5) |
Total (6) |
| Mar-20 |
6.05% |
5.98% |
4.70% |
2.80% |
8.14% |
7.29% |
| Mar-21 |
6.05% |
6.00% |
4.70% |
4.37% |
8.12% |
7.97% |
| Mar-22 |
5.79% |
5.77% |
4.47% |
4.13% |
7.68% |
7.54% |
| Mar-23 |
5.79% |
5.74% |
4.47% |
5.35% |
7.57% |
7.92% |
| Mar-24 |
5.79% |
5.72% |
4.47% |
3.15% |
7.81% |
7.21% |
| |
|
|
|
|
|
|
| (1) Percentage established in the tariff review; |
| (2) Technical loss calculated and reported monthly to Aneel; |
| (3) Percentage established in the tariff review; |
| (4) Difference between reported total losses and technical losses calculated as a percentage established in the review and the total injected energy, also reported monthly to Aneel; |
| (5) (Regulatory percentage of PNT x informed BT Market + technical losses calculated as a percentage established in the review and the total energy injected) / Injected energy; |
| (6) Total loss on injected energy. |
| NOTE: In the calculation of the distributor's total losses, energy losses inherent to the electric power system (technical losses), commercial losses (mainly due to fraud, theft) and differences related to the shift in the billing schedule and the effects of the portion of mini and micro generation distributed in the Company's network |
SIGNATURE
Pursuant to the requirements of the Securities
Exchange Act of 1934, the registrant has duly caused this report to be signed on its behalf by the undersigned, thereunto duly
authorized.
Date May 9, 2024
| COMPANHIA PARANAENSE DE ENERGIA – COPEL |
| |
|
|
| By: |
/S/
Daniel Pimentel Slaviero
|
|
| |
Daniel Pimentel Slaviero
Chief Executive Officer |
|
FORWARD-LOOKING STATEMENTS
This press release may contain forward-looking statements.
These statements are statements that are not historical facts, and are based on management's current view and estimates of future
economic circumstances, industry conditions, company performance and financial results. The words "anticipates", "believes",
"estimates", "expects", "plans" and similar expressions, as they relate to the company, are intended
to identify forward-looking statements. Statements regarding the declaration or payment of dividends, the implementation of principal
operating and financing strategies and capital expenditure plans, the direction of future operations and the factors or trends
affecting financial condition, liquidity or results of operations are examples of forward-looking statements. Such statements reflect
the current views of management and are subject to a number of risks and uncertainties. There is no guarantee that the expected
events, trends or results will actually occur. The statements are based on many assumptions and factors, including general economic
and market conditions, industry conditions, and operating factors. Any changes in such assumptions or factors could cause actual
results to differ materially from current expectations.
Companhia Paranaense de ... (NYSE:ELPC)
Historical Stock Chart
From Apr 2024 to May 2024

Companhia Paranaense de ... (NYSE:ELPC)
Historical Stock Chart
From May 2023 to May 2024
