| C O N F I D E N T I A L
33
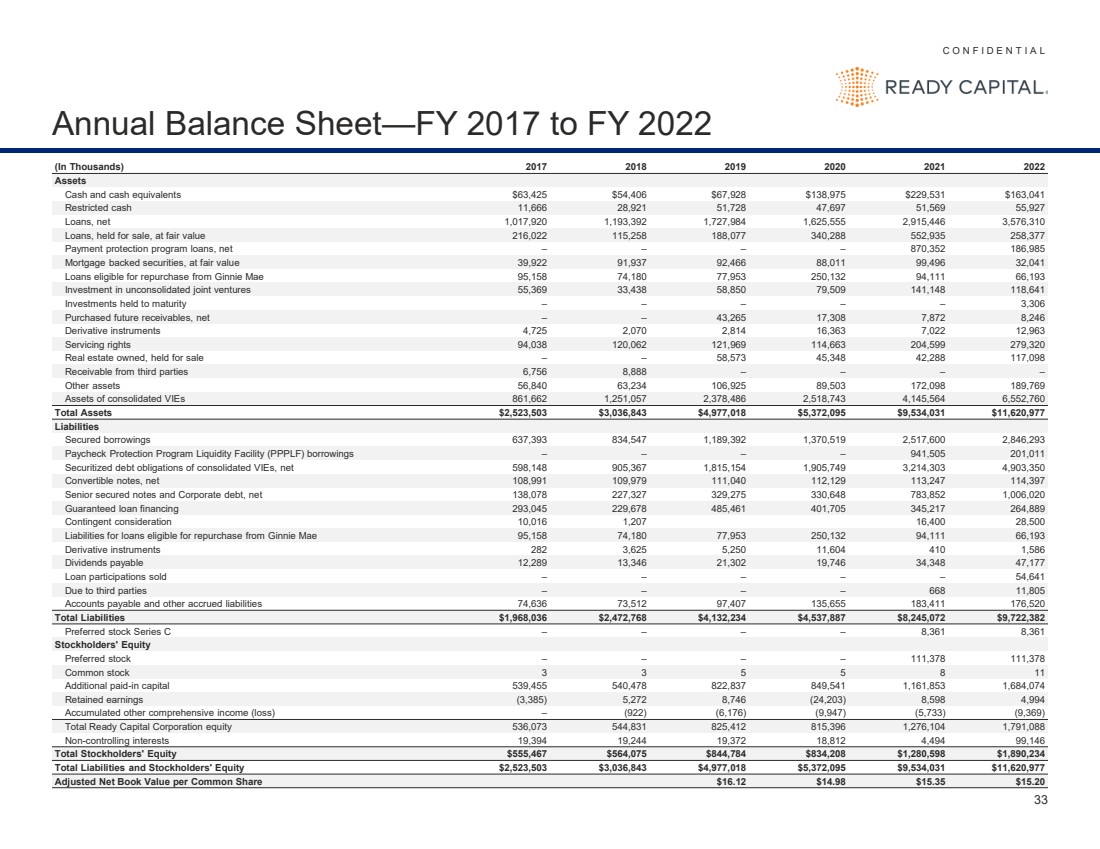
Annual Balance Sheet—FY 2017 to FY 2022
(In Thousands) 2017 2018 2019 2020 2021 2022
Assets
Cash and cash equivalents $63,425 $54,406 $67,928 $138,975 $229,531 $163,041
Restricted cash 11,666 28,921 51,728 47,697 51,569 55,927
Loans, net 1,017,920 1,193,392 1,727,984 1,625,555 2,915,446 3,576,310
Loans, held for sale, at fair value 216,022 115,258 188,077 340,288 552,935 258,377
Payment protection program loans, net – – – – 870,352 186,985
Mortgage backed securities, at fair value 39,922 91,937 92,466 88,011 99,496 32,041
Loans eligible for repurchase from Ginnie Mae 95,158 74,180 77,953 250,132 94,111 66,193
Investment in unconsolidated joint ventures 55,369 33,438 58,850 79,509 141,148 118,641
Investments held to maturity – – – – – 3,306
Purchased future receivables, net – – 43,265 17,308 7,872 8,246
Derivative instruments 4,725 2,070 2,814 16,363 7,022 12,963
Servicing rights 94,038 120,062 121,969 114,663 204,599 279,320
Real estate owned, held for sale – – 58,573 45,348 42,288 117,098
Receivable from third parties 6,756 8,888 – – – –
Other assets 56,840 63,234 106,925 89,503 172,098 189,769
Assets of consolidated VIEs 861,662 1,251,057 2,378,486 2,518,743 4,145,564 6,552,760
Total Assets $2,523,503 $3,036,843 $4,977,018 $5,372,095 $9,534,031 $11,620,977
Liabilities
Secured borrowings 637,393 834,547 1,189,392 1,370,519 2,517,600 2,846,293
Paycheck Protection Program Liquidity Facility (PPPLF) borrowings – – – – 941,505 201,011
Securitized debt obligations of consolidated VIEs, net 598,148 905,367 1,815,154 1,905,749 3,214,303 4,903,350
Convertible notes, net 108,991 109,979 111,040 112,129 113,247 114,397
Senior secured notes and Corporate debt, net 138,078 227,327 329,275 330,648 783,852 1,006,020
Guaranteed loan financing 293,045 229,678 485,461 401,705 345,217 264,889
Contingent consideration 10,016 1,207 16,400 28,500
Liabilities for loans eligible for repurchase from Ginnie Mae 95,158 74,180 77,953 250,132 94,111 66,193
Derivative instruments 282 3,625 5,250 11,604 410 1,586
Dividends payable 12,289 13,346 21,302 19,746 34,348 47,177
Loan participations sold – – – – – 54,641
Due to third parties – – – – 668 11,805
Accounts payable and other accrued liabilities 74,636 73,512 97,407 135,655 183,411 176,520
Total Liabilities $1,968,036 $2,472,768 $4,132,234 $4,537,887 $8,245,072 $9,722,382
Preferred stock Series C – – – – 8,361 8,361
Stockholders' Equity
Preferred stock – – – – 111,378 111,378
Common stock 3 3 5 5 8 11
Additional paid-in capital 539,455 540,478 822,837 849,541 1,161,853 1,684,074
Retained earnings (3,385) 5,272 8,746 (24,203) 8,598 4,994
Accumulated other comprehensive income (loss) – (922) (6,176) (9,947) (5,733) (9,369)
Total Ready Capital Corporation equity 536,073 544,831 825,412 815,396 1,276,104 1,791,088
Non-controlling interests 19,394 19,244 19,372 18,812 4,494 99,146
Total Stockholders' Equity $555,467 $564,075 $844,784 $834,208 $1,280,598 $1,890,234
Total Liabilities and Stockholders' Equity $2,523,503 $3,036,843 $4,977,018 $5,372,095 $9,534,031 $11,620,977
Adjusted Net Book Value per Common Share $16.12 $14.98 $15.35 $15.20 |