UNITED STATES
SECURITIES AND EXCHANGE COMMISSION
Washington, D.C. 20549
FORM 6-K
REPORT OF
FOREIGN PRIVATE ISSUER
PURSUANT TO RULE 13a-16 OR
15d-16
UNDER THE SECURITIES EXCHANGE ACT OF 1934
For the month of July 2023
Commission File Number: 001-35931
Constellium SE
(Translation of registrant’s name into English)
|
|
|
| Washington Plaza, |
|
300 East Lombard Street |
| 40-44 rue Washington |
|
Suite 1710 |
| 75008 Paris |
|
Baltimore, MD 21202 |
| France |
|
United States |
| (Head Office) |
|
|
(Address of principal executive offices)
Indicate by check mark whether the registrant files or will file annual reports under cover of Form 20-F or Form 40-F: Form 20-F ☒ Form 40-F ☐
Indicate by check mark if the registrant is submitting the Form 6-K in paper as permitted by Regulation S-T Rule 101(b)(1): Yes ☐ No ☒
Indicate by check mark if the
registrant is submitting the Form 6-K in paper as permitted by Regulation S-T Rule 101(b)(7): Yes ☐ No ☒
INFORMATION CONTAINED IN THIS FORM 6-K REPORT
Attached hereto as Exhibit 99.1 is a copy of the press release of Constellium SE (the “Company”), dated July 26, 2023, announcing its
financial results for the second quarter ended June 30, 2023.
Attached hereto as Exhibit 99.2 is a copy of a presentation of the Company, dated
July 26, 2023, summarizing its financial results for the second quarter ended June 30, 2023.
Exhibit Index
|
|
|
| No. |
|
Description |
|
|
| 99.1 |
|
Press Release issued by Constellium SE on July 26, 2023. |
|
|
| 99.2 |
|
Presentation posted by Constellium SE on July 26, 2023. |
The information contained in Exhibit 99.1 of this Form 6-K (except for the
second paragraph on page 2 containing certain quotes by the Chief Executive Officer, the section titled “Outlook”, and the quote contained in the third paragraph under “Recent Developments”), is incorporated by reference into any
offering circular or registration statement (or into any prospectus that forms a part thereof) filed by Constellium SE with the Securities and Exchange Commission. Exhibit 99.2 is not incorporated by reference.
SIGNATURE
Pursuant to the requirements of the Securities Exchange Act of 1934, the registrant has duly caused this report to be signed on its behalf by the undersigned,
thereunto duly authorized.
|
|
|
|
|
|
|
|
|
|
|
|
|
|
|
CONSTELLIUM SE
(Registrant) |
|
|
|
|
|
| July 26, 2023 |
|
|
|
|
|
By: |
|
/s/ Jack Guo |
|
|
|
|
|
|
Name: |
|
Jack Guo |
|
|
|
|
|
|
Title: |
|
Chief Financial Officer |
Exhibit 99.1

Constellium Reports Second Quarter and First Half 2023 Results
Paris, July 26, 2023 – Constellium SE (NYSE: CSTM) today reported results for the second quarter ended June 30, 2023.
Second quarter 2023 highlights:
| |
• |
|
Shipments of 398 thousand metric tons, down 6% compared to Q2 2022 |
| |
• |
|
Revenue of €2.0 billion, down 14% compared to Q2 2022 |
| |
• |
|
Value-Added Revenue (VAR) of €785 million, up 11% compared to Q2 2022
|
| |
• |
|
Net income of €32 million compared to a net loss of €32 million in Q2 2022
|
| |
• |
|
Adjusted EBITDA of €209 million, up 5% compared to Q2 2022 |
| |
• |
|
Cash from Operations of €133 million and Free Cash Flow of €68 million
|
First half 2023 highlights:
| |
• |
|
Shipments of 787 thousand metric tons, down 5% compared to H1 2022 |
| |
• |
|
Revenue of €3.9 billion, down 8% compared to H1 2022 |
| |
• |
|
VAR of €1.5 billion, up 13% compared to H1 2022 |
| |
• |
|
Net income of €54 million compared to net income of €147 million in H1 2022
|
| |
• |
|
Adjusted EBITDA of €374 million, up 2% compared to H1 2022 |
| |
• |
|
Cash from Operations of €167 million and Free Cash Flow of €34 million |
| |
• |
|
Net debt / LTM Adjusted EBITDA of 2.7x at June 30, 2023 |
Jean-Marc Germain, Constellium’s Chief Executive Officer said, “I am very pleased with the results our team delivered in the second quarter,
including record VAR and record Adjusted EBITDA. Demand remained strong across several end markets during the quarter, and our team continued to execute very well despite significant inflationary pressures. A&T reported record quarterly Adjusted
EBITDA supported by continued strength in aerospace demand. The recovery in automotive continued with higher shipments in both rolled and extruded products. Packaging shipments were down in the quarter as demand remained below prior year levels, and
we continued to experience weakness in most industrial markets, especially in Europe. Free Cash Flow generation in the second quarter was strong at €68 million and we reduced our leverage to 2.7x.”


“We announced in June and recently completed the redemption of $50 million of our 2026 Senior
Notes, which further strengthens our balance sheet. Also, in July we announced the sale of our soft alloy extrusion business in Germany for a total cash consideration of €48.8 million,” Mr. Germain continued.
Mr. Germain concluded, “Based on our strong performance in the first half of this year and our current outlook for the second half, which assumes no
major deterioration on the macroeconomic or geopolitical fronts, we are raising our guidance and now expect Adjusted EBITDA of €700 million to €720 million and Free Cash Flow in excess of €150 million in 2023. We also
remain confident in our ability to deliver on our long-term target of Adjusted EBITDA over €800 million in 2025. Our focus is on executing our strategy, driving operational performance, generating Free Cash Flow, achieving our ESG
objectives and increasing shareholder value.”
Group Summary
|
|
|
|
|
|
|
|
|
|
|
|
|
|
|
|
|
|
|
|
|
|
|
|
|
| |
|
Q2
2023 |
|
|
Q2
2022 |
|
|
Var. |
|
|
YTD
2023 |
|
|
YTD
2022 |
|
|
Var. |
|
| Shipments (k metric tons) |
|
|
398 |
|
|
|
424 |
|
|
|
(6 |
)% |
|
|
787 |
|
|
|
825 |
|
|
|
(5 |
)% |
| Revenue (€ millions) |
|
|
1,950 |
|
|
|
2,275 |
|
|
|
(14 |
)% |
|
|
3,906 |
|
|
|
4,254 |
|
|
|
(8 |
)% |
| VAR (€ millions) |
|
|
785 |
|
|
|
704 |
|
|
|
11 |
% |
|
|
1,539 |
|
|
|
1,356 |
|
|
|
13 |
% |
| Net income (€ millions) |
|
|
32 |
|
|
|
(32 |
) |
|
|
n.m. |
|
|
|
54 |
|
|
|
147 |
|
|
|
n.m. |
|
| Adjusted EBITDA (€ millions) |
|
|
209 |
|
|
|
198 |
|
|
|
5 |
% |
|
|
374 |
|
|
|
365 |
|
|
|
2 |
% |
| Adjusted EBITDA per metric ton (€) |
|
|
525 |
|
|
|
468 |
|
|
|
12 |
% |
|
|
476 |
|
|
|
443 |
|
|
|
7 |
% |
The difference between the sum of reported segment revenue and total group revenue includes revenue from certain non-core activities and inter-segment eliminations. The difference between the sum of reported segment Adjusted EBITDA and the Group Adjusted EBITDA is related to Holdings and Corporate.
For the second quarter of 2023, shipments of 398 thousand metric tons decreased 6% compared to the second quarter of last year due to lower shipments in
the P&ARP and AS&I segments. Revenue of €2.0 billion decreased 14% compared to the second quarter of the prior year primarily due to lower shipments and lower metal prices, partially offset by improved price and mix. VAR of
€785 million increased 11% compared to the second quarter of the prior year primarily due to improved price and mix, partially offset by lower shipments and unfavorable metal costs. Net income of €32 million increased
€64 million compared to a net loss of €32 million in the second quarter of 2022. Adjusted EBITDA of €209 million increased 5% compared to the second quarter of last year due to stronger results in our A&T segment,
partially offset by weaker results in our P&ARP and AS&I segments.
2
For the first half of 2023, shipments of 787 thousand metric tons decreased 5% compared to the first
half of 2022 mostly due to lower shipments in the P&ARP segment. Revenue of €3.9 billion decreased 8% compared to the first half of 2022 primarily due to lower shipments and lower metal prices, partially offset by improved price and
mix. VAR of €1.5 billion increased 13% compared to the first half of 2022 primarily due to improved price and mix, partially offset by lower shipments and unfavorable metal costs. Net income of €54 million decreased
€93 million compared to net income of €147 million in the first half of 2022. Adjusted EBITDA of €374 million increased 2% compared to the first half of 2022 as stronger results in our A&T segment were partially
offset by weaker results in our P&ARP segment.
Results by Segment
Packaging & Automotive Rolled Products (P&ARP)
|
|
|
|
|
|
|
|
|
|
|
|
|
|
|
|
|
|
|
|
|
|
|
|
|
| |
|
Q2
2023 |
|
|
Q2
2022 |
|
|
Var. |
|
|
YTD
2023 |
|
|
YTD
2022 |
|
|
Var. |
|
| Shipments (k metric tons) |
|
|
272 |
|
|
|
292 |
|
|
|
(7 |
)% |
|
|
531 |
|
|
|
568 |
|
|
|
(7 |
)% |
| Revenue (€ millions) |
|
|
1,049 |
|
|
|
1,348 |
|
|
|
(22 |
)% |
|
|
2,079 |
|
|
|
2,516 |
|
|
|
(17 |
)% |
| Adjusted EBITDA (€ millions) |
|
|
79 |
|
|
|
95 |
|
|
|
(17 |
)% |
|
|
134 |
|
|
|
177 |
|
|
|
(24 |
)% |
| Adjusted EBITDA per metric ton (€) |
|
|
291 |
|
|
|
327 |
|
|
|
(11 |
)% |
|
|
253 |
|
|
|
312 |
|
|
|
(19 |
)% |
For the second quarter of 2023, Adjusted EBITDA decreased 17% compared to the second quarter of 2022 as a result of lower
shipments and higher operating costs mainly due to inflation, operating challenges at our Muscle Shoals facility and unfavorable metal costs, partially offset by improved price and mix. Shipments of 272 thousand metric tons decreased 7%
compared to the second quarter of the prior year due to lower shipments of packaging and specialty rolled products, partially offset by higher shipments of automotive rolled products. Revenue of €1.0 billion decreased 22% compared to the
second quarter of 2022 primarily due to lower shipments and lower metal prices, partially offset by improved price and mix.
For the first half of 2023,
Adjusted EBITDA of €134 million decreased 24% compared to the first half of 2022 as a result of lower shipments and higher operating costs mainly due to inflation, operating challenges at our Muscle Shoals facility and unfavorable metal
costs, partially offset by improved price and mix. Shipments of 531 thousand metric tons decreased 7% compared to the first half of 2022 due to lower shipments of packaging and specialty rolled products, partially offset by higher shipments of
automotive rolled products. Revenue of €2.1 billion decreased 17% compared to the first half of 2022 primarily due to lower shipments and lower metal prices, partially offset by improved price and mix.
3
Aerospace & Transportation (A&T)
|
|
|
|
|
|
|
|
|
|
|
|
|
|
|
|
|
|
|
|
|
|
|
|
|
| |
|
Q2
2023 |
|
|
Q2
2022 |
|
|
Var. |
|
|
YTD
2023 |
|
|
YTD
2022 |
|
|
Var. |
|
| Shipments (k metric tons) |
|
|
60 |
|
|
|
60 |
|
|
|
0 |
% |
|
|
118 |
|
|
|
115 |
|
|
|
2 |
% |
| Revenue (€ millions) |
|
|
464 |
|
|
|
461 |
|
|
|
1 |
% |
|
|
916 |
|
|
|
846 |
|
|
|
8 |
% |
| Adjusted EBITDA (€ millions) |
|
|
96 |
|
|
|
63 |
|
|
|
53 |
% |
|
|
169 |
|
|
|
116 |
|
|
|
46 |
% |
| Adjusted EBITDA per metric ton (€) |
|
|
1,613 |
|
|
|
1,056 |
|
|
|
53 |
% |
|
|
1,418 |
|
|
|
1,010 |
|
|
|
40 |
% |
For the second quarter of 2023, Adjusted EBITDA increased 53% compared to the second quarter of 2022 primarily due to improved
price and mix, partially offset by higher operating costs mainly due to inflation and increased activity levels. Shipments of 60 thousand metric tons were stable compared to the second quarter of the prior year on higher shipments of aerospace
rolled products offset by lower shipments of transportation, industry and defense (TID) rolled products. Revenue of €464 million was relatively stable compared to the second quarter of 2022 primarily due to improved price and mix mostly
offset by lower metal prices.
For the first half of 2023, Adjusted EBITDA of €169 million increased 46% compared to the first half of 2022
primarily due to higher shipments and improved price and mix, partially offset by higher operating costs mainly due to inflation and increased activity levels. Shipments of 118 thousand metric tons increased 2% compared to the first half of
2022 on higher shipments of aerospace rolled products, partially offset by lower shipments of TID rolled products. Revenue of €916 million increased 8% compared to the first half of 2022 primarily due to higher shipments and improved price
and mix, partially offset by lower metal prices.
Automotive Structures & Industry (AS&I)
|
|
|
|
|
|
|
|
|
|
|
|
|
|
|
|
|
|
|
|
|
|
|
|
|
| |
|
Q2
2023 |
|
|
Q2
2022 |
|
|
Var. |
|
|
YTD
2023 |
|
|
YTD
2022 |
|
|
Var. |
|
| Shipments (k metric tons) |
|
|
66 |
|
|
|
72 |
|
|
|
(8 |
)% |
|
|
138 |
|
|
|
142 |
|
|
|
(3 |
)% |
| Revenue (€ millions) |
|
|
443 |
|
|
|
501 |
|
|
|
(12 |
)% |
|
|
926 |
|
|
|
960 |
|
|
|
(4 |
)% |
| Adjusted EBITDA (€ millions) |
|
|
39 |
|
|
|
46 |
|
|
|
(15 |
)% |
|
|
82 |
|
|
|
83 |
|
|
|
(1 |
)% |
| Adjusted EBITDA per metric ton (€) |
|
|
597 |
|
|
|
641 |
|
|
|
(7 |
)% |
|
|
598 |
|
|
|
581 |
|
|
|
3 |
% |
For the second quarter of 2023, Adjusted EBITDA decreased 15% compared to the second quarter of 2022 primarily due to lower
shipments and higher operating costs mainly due to inflation, partially offset by improved price and mix. Shipments of 66 thousand metric tons decreased 8% compared to the second quarter of the prior year due to lower other extruded product
shipments, partially offset by higher shipments of automotive extruded products.
4
Revenue of €443 million decreased 12% compared to the second quarter of 2022 primarily due to lower
shipments and lower metal prices, partially offset by improved price and mix.
For the first half of 2023, Adjusted EBITDA of €82 million was
relatively stable compared to the first half of 2022 primarily due to lower shipments and higher operating costs mainly due to inflation, mostly offset by improved price and mix. Shipments of 138 thousand metric tons decreased 3% compared to
the first half of 2022 due to lower other extruded product shipments, partially offset by higher shipments of automotive extruded products. Revenue of €926 million decreased 4% compared to the first half of 2022 primarily due to lower
shipments and lower metal prices, partially offset by improved price and mix.
Net Income
For the second quarter of 2023, net income of €32 million compares to a net loss of €32 million in the second quarter of the prior year.
The increase in net income is primarily related to favorable changes in gains and losses on derivatives mostly related to our hedging positions, partially offset by higher tax expense.
For the first half of 2023, net income of €54 million compares to net income of €147 million in the first half of the prior year. The
decrease in net income is primarily related to lower gross profit and unfavorable changes in gains and losses on derivatives mostly related to our hedging positions, partially offset by lower tax expense.
Cash Flow
Free Cash Flow was €34 million in
the first half of 2023 compared to €86 million in the first half of the prior year. The change was primarily due to increased capital expenditures and an unfavorable change in working capital, partially offset by lower cash taxes.
Cash flows from operating activities were €167 million for the first half of 2023 compared to cash flows from operating activities of
€169 million in the first half of the prior year. Constellium decreased derecognized factored receivables by €2 million for the first half of 2023 compared to an increase of €10 million in the first half of the prior
year.
Cash flows used in investing activities were €133 million for the first half of 2023 compared to cash flows used in investing activities
of €83 million in the first half of the prior year.
Cash flows used in financing activities were €19 million for the first half of
2023 compared to cash flows used in financing activities of €79 million in the first half of the prior year. In the first half of 2022, Constellium drew on the Pan-U.S. ABL due 2026 and used the
proceeds and cash on the balance sheet to repay the €180 million PGE French Facility due 2022 and the CHF 15 million Swiss Facility due 2025.
5
Liquidity and Net Debt
Liquidity at June 30, 2023 was €752 million, comprised of €178 million of cash and cash equivalents and €574 million
available under our committed lending facilities and factoring arrangements.
Net debt was €1,850 million at June 30, 2023 compared to
€1,891 million at December 31, 2022.
Outlook
Based on our current outlook, we expect Adjusted EBITDA in the range of €700 million to €720 and Free Cash Flow in excess of
€150 million in 2023.
We are not able to provide a reconciliation of this Adjusted EBITDA guidance to net income, the comparable GAAP
measure, because certain items that are excluded from Adjusted EBITDA cannot be reasonably predicted or are not in our control. In particular, we are unable to forecast the timing or magnitude of realized and unrealized gains and losses on
derivative instruments, metal lag, impairment or restructuring charges, or taxes without unreasonable efforts, and these items could significantly impact, either individually or in the aggregate, net income in the future.
Recent Developments
On July 17, 2023, Constellium
SE signed a binding agreement for the sale of Constellium Extrusions Deutschland GmbH for a total cash consideration of €48.8 million.
On July
20, 2023, Constellium SE redeemed $50 million of the $300 million outstanding aggregate principal amount of its 5.875% Senior Notes due 2026.
Ingrid Joerg has been appointed Executive Vice President & Chief Operating Officer (COO) effective September 1, 2023. As COO of the Company,
Ms. Joerg will operationally head Constellium’s three business units, driving sustainable growth, operational efficiencies and world class safety performance. Ms. Joerg has served as the President of Constellium’s A&T
business unit since June 2015. Mr. Germain said, “I am very pleased to announce that I have appointed Ingrid to this new and exciting role, which will allow us to continue to strengthen our organizational structure and focus. In her new
role, Ingrid will continue to work closely with me in the coming years to drive further value creation for the Company.”
Forward-looking
statements
Certain statements contained in this press release may constitute forward-looking statements within the meaning of the Private Securities
Litigation Reform Act of 1995. This press release may contain “forward-looking statements” with respect to our business, results of operations and financial condition, and our expectations or beliefs concerning future events and
conditions. You can identify forward-looking statements because they contain words such as, but not limited to,
6
“believes,” “expects,” “may,” “should,” “approximately,”
“anticipates,” “estimates,” “intends,” “plans,” “targets,” likely,” “will,” “would,” “could” and similar expressions (or the negative of these terminologies or
expressions). All forward-looking statements involve risks and uncertainties. Many risks and uncertainties are inherent in our industry and markets, while others are more specific to our business and operations. These risks and uncertainties
include, but are not limited to: market competition; economic downturn; disruption to business operations, including the length and magnitude of disruption resulting from the global COVID-19 pandemic; the
Russian war on Ukraine; the inability to meet customer demand and quality requirements; the loss of key customers, suppliers or other business relationships; supply disruptions; excessive inflation; the capacity and effectiveness of our hedging
policy activities; the loss of key employees; levels of indebtedness which could limit our operating flexibility and opportunities; and other risk factors set forth under the heading “Risk Factors” in our Annual Report on Form 20-F, and as described from time to time in subsequent reports filed with the U.S. Securities and Exchange Commission. The occurrence of the events described and the achievement of the expected results depend on
many events, some or all of which are not predictable or within our control. Consequently, actual results may differ materially from the forward-looking statements contained in this press release. We undertake no obligation to update or revise any
forward-looking statement as a result of new information, future events or otherwise, except as required by law.
About Constellium
Constellium (NYSE: CSTM) is a global sector leader that develops innovative, value-added aluminium products for a broad scope of markets and applications,
including packaging, automotive and aerospace. Constellium generated €8.1 billion of revenue in 2022.
Constellium’s earnings materials for
the second quarter ended June 30, 2023 are also available on the company’s website (www.constellium.com).
7
CONSOLIDATED INCOME STATEMENT (UNAUDITED)
|
|
|
|
|
|
|
|
|
|
|
|
|
|
|
|
|
| |
|
Three months ended June 30, |
|
|
Six months ended June 30, |
|
| (in millions of Euros) |
|
2023 |
|
|
2022 |
|
|
2023 |
|
|
2022 |
|
| Revenue |
|
|
1,950 |
|
|
|
2,275 |
|
|
|
3,906 |
|
|
|
4,254 |
|
| Cost of sales |
|
|
(1,737 |
) |
|
|
(2,060 |
) |
|
|
(3,532 |
) |
|
|
(3,822 |
) |
|
|
|
|
|
|
|
|
|
|
|
|
|
|
|
|
|
| Gross profit |
|
|
213 |
|
|
|
215 |
|
|
|
374 |
|
|
|
432 |
|
|
|
|
|
|
|
|
|
|
|
|
|
|
|
|
|
|
| Selling and administrative expenses |
|
|
(80 |
) |
|
|
(75 |
) |
|
|
(151 |
) |
|
|
(143 |
) |
| Research and development expenses |
|
|
(13 |
) |
|
|
(10 |
) |
|
|
(26 |
) |
|
|
(21 |
) |
| Other gains and losses - net |
|
|
(41 |
) |
|
|
(134 |
) |
|
|
(56 |
) |
|
|
(24 |
) |
|
|
|
|
|
|
|
|
|
|
|
|
|
|
|
|
|
| Income / (loss) from operations |
|
|
79 |
|
|
|
(4 |
) |
|
|
141 |
|
|
|
244 |
|
|
|
|
|
|
|
|
|
|
|
|
|
|
|
|
|
|
| Finance costs - net |
|
|
(35 |
) |
|
|
(32 |
) |
|
|
(70 |
) |
|
|
(62 |
) |
|
|
|
|
|
|
|
|
|
|
|
|
|
|
|
|
|
| Income / (loss) before tax |
|
|
44 |
|
|
|
(36 |
) |
|
|
71 |
|
|
|
182 |
|
|
|
|
|
|
|
|
|
|
|
|
|
|
|
|
|
|
| Income tax (expense) / benefit |
|
|
(12 |
) |
|
|
4 |
|
|
|
(17 |
) |
|
|
(35 |
) |
|
|
|
|
|
|
|
|
|
|
|
|
|
|
|
|
|
| Net income / (loss) |
|
|
32 |
|
|
|
(32 |
) |
|
|
54 |
|
|
|
147 |
|
|
|
|
|
|
|
|
|
|
|
|
|
|
|
|
|
|
| Net income / (loss) attributable to: |
|
|
|
|
|
|
|
|
|
|
|
|
|
|
|
|
| Equity holders of Constellium |
|
|
31 |
|
|
|
(34 |
) |
|
|
51 |
|
|
|
143 |
|
| Non-controlling interests |
|
|
1 |
|
|
|
2 |
|
|
|
3 |
|
|
|
4 |
|
|
|
|
|
|
|
|
|
|
|
|
|
|
|
|
|
|
| Net income / (loss) |
|
|
32 |
|
|
|
(32 |
) |
|
|
54 |
|
|
|
147 |
|
|
|
|
|
|
|
|
|
|
|
|
|
|
|
|
|
|
| Earnings per share attributable to the equity holders of Constellium, (in Euros) |
|
|
|
|
|
|
|
|
|
|
|
|
|
|
|
|
| Basic |
|
|
0.21 |
|
|
|
(0.24 |
) |
|
|
0.35 |
|
|
|
1.00 |
|
| Diluted |
|
|
0.21 |
|
|
|
(0.24 |
) |
|
|
0.34 |
|
|
|
0.97 |
|
| Weighted average number of shares, (in thousands) |
|
|
|
|
|
|
|
|
|
|
|
|
|
|
|
|
| Basic |
|
|
146,543 |
|
|
|
144,186 |
|
|
|
145,429 |
|
|
|
142,939 |
|
| Diluted |
|
|
148,191 |
|
|
|
144,186 |
|
|
|
148,191 |
|
|
|
147,184 |
|
|
|
|
|
|
|
|
|
|
|
|
|
|
|
|
|
|
8
CONSOLIDATED STATEMENT OF COMPREHENSIVE INCOME / (LOSS) (UNAUDITED)
|
|
|
|
|
|
|
|
|
|
|
|
|
|
|
|
|
| |
|
Three months ended June 30, |
|
|
Six months ended June 30, |
|
| (in millions of Euros) |
|
2023 |
|
|
2022 |
|
|
2023 |
|
|
2022 |
|
| Net income / (loss) |
|
|
32 |
|
|
|
(32 |
) |
|
|
54 |
|
|
|
147 |
|
|
|
|
|
|
|
|
|
|
|
|
|
|
|
|
|
|
| Other comprehensive income / (loss) |
|
|
|
|
|
|
|
|
|
|
|
|
|
|
|
|
| Items that will not be reclassified subsequently to the consolidated income
statement |
|
|
|
|
|
|
|
|
|
|
|
|
|
|
|
|
| Remeasurement on post-employment benefit obligations |
|
|
5 |
|
|
|
79 |
|
|
|
4 |
|
|
|
155 |
|
| Income tax on remeasurement on post-employment benefit obligations |
|
|
(3 |
) |
|
|
(17 |
) |
|
|
(2 |
) |
|
|
(30 |
) |
| Items that may be reclassified subsequently to the consolidated income statement |
|
|
|
|
|
|
|
|
|
|
|
|
|
|
|
|
| Cash flow hedges |
|
|
1 |
|
|
|
(13 |
) |
|
|
4 |
|
|
|
(15 |
) |
| Income tax on cash flow hedges |
|
|
— |
|
|
|
3 |
|
|
|
(1 |
) |
|
|
4 |
|
| Currency translation differences |
|
|
— |
|
|
|
31 |
|
|
|
(13 |
) |
|
|
42 |
|
|
|
|
|
|
|
|
|
|
|
|
|
|
|
|
|
|
| Other comprehensive income / (loss) |
|
|
3 |
|
|
|
83 |
|
|
|
(8 |
) |
|
|
156 |
|
|
|
|
|
|
|
|
|
|
|
|
|
|
|
|
|
|
| Total comprehensive income |
|
|
35 |
|
|
|
51 |
|
|
|
46 |
|
|
|
303 |
|
|
|
|
|
|
|
|
|
|
|
|
|
|
|
|
|
|
| Attributable to: |
|
|
|
|
|
|
|
|
|
|
|
|
|
|
|
|
| Equity holders of Constellium |
|
|
34 |
|
|
|
49 |
|
|
|
44 |
|
|
|
299 |
|
| Non-controlling interests |
|
|
1 |
|
|
|
2 |
|
|
|
2 |
|
|
|
4 |
|
|
|
|
|
|
|
|
|
|
|
|
|
|
|
|
|
|
| Total comprehensive income |
|
|
35 |
|
|
|
51 |
|
|
|
46 |
|
|
|
303 |
|
|
|
|
|
|
|
|
|
|
|
|
|
|
|
|
|
|
9
CONSOLIDATED STATEMENT OF FINANCIAL POSITION (UNAUDITED)
|
|
|
|
|
|
|
|
|
| (in millions of Euros) |
|
At June 30, 2023 |
|
|
At December 31, 2022 |
|
| Assets Current assets |
|
|
|
|
|
|
|
|
| Cash and cash equivalents |
|
|
178 |
|
|
|
166 |
|
| Trade receivables and other |
|
|
765 |
|
|
|
539 |
|
| Inventories |
|
|
1,149 |
|
|
|
1,320 |
|
| Other financial assets |
|
|
22 |
|
|
|
31 |
|
|
|
|
|
|
|
|
|
|
|
|
|
2,114 |
|
|
|
2,056 |
|
|
|
|
|
|
|
|
|
|
| Non-current assets |
|
|
|
|
|
|
|
|
| Property, plant and equipment |
|
|
1,993 |
|
|
|
2,017 |
|
| Goodwill |
|
|
470 |
|
|
|
478 |
|
| Intangible assets |
|
|
50 |
|
|
|
54 |
|
| Deferred tax assets |
|
|
238 |
|
|
|
271 |
|
| Trade receivables and other |
|
|
35 |
|
|
|
43 |
|
| Other financial assets |
|
|
4 |
|
|
|
8 |
|
|
|
|
|
|
|
|
|
|
|
|
|
2,790 |
|
|
|
2,871 |
|
|
|
|
|
|
|
|
|
|
| Assets of disposal group classified as held for sale |
|
|
45 |
|
|
|
14 |
|
|
|
|
|
|
|
|
|
|
| Total Assets |
|
|
4,949 |
|
|
|
4,941 |
|
|
|
|
|
|
|
|
|
|
| Liabilities |
|
|
|
|
|
|
|
|
| Current liabilities |
|
|
|
|
|
|
|
|
| Trade payables and other |
|
|
1,461 |
|
|
|
1,467 |
|
| Borrowings |
|
|
197 |
|
|
|
148 |
|
| Other financial liabilities |
|
|
54 |
|
|
|
41 |
|
| Income tax payable |
|
|
18 |
|
|
|
16 |
|
| Provisions |
|
|
20 |
|
|
|
21 |
|
|
|
|
|
|
|
|
|
|
|
|
|
1,750 |
|
|
|
1,693 |
|
|
|
|
|
|
|
|
|
|
| Non-current liabilities |
|
|
|
|
|
|
|
|
| Trade payables and other |
|
|
52 |
|
|
|
43 |
|
| Borrowings |
|
|
1,831 |
|
|
|
1,908 |
|
| Other financial liabilities |
|
|
11 |
|
|
|
14 |
|
| Pension and other post-employment benefit obligations |
|
|
393 |
|
|
|
403 |
|
| Provisions |
|
|
89 |
|
|
|
90 |
|
| Deferred tax liabilities |
|
|
4 |
|
|
|
28 |
|
|
|
|
|
|
|
|
|
|
|
|
|
2,380 |
|
|
|
2,486 |
|
|
|
|
|
|
|
|
|
|
| Liabilities of disposal group classified as held for sale |
|
|
13 |
|
|
|
10 |
|
|
|
|
|
|
|
|
|
|
| Total Liabilities |
|
|
4,143 |
|
|
|
4,189 |
|
|
|
|
|
|
|
|
|
|
| Equity |
|
|
|
|
|
|
|
|
| Share capital |
|
|
3 |
|
|
|
3 |
|
| Share premium |
|
|
420 |
|
|
|
420 |
|
| Retained earnings and other reserves |
|
|
362 |
|
|
|
308 |
|
|
|
|
|
|
|
|
|
|
| Equity attributable to equity holders of Constellium |
|
|
785 |
|
|
|
731 |
|
| Non-controlling interests |
|
|
21 |
|
|
|
21 |
|
|
|
|
|
|
|
|
|
|
| Total Equity |
|
|
806 |
|
|
|
752 |
|
|
|
|
|
|
|
|
|
|
| Total Equity and Liabilities |
|
|
4,949 |
|
|
|
4,941 |
|
|
|
|
|
|
|
|
|
|
10
CONSOLIDATED STATEMENT OF CHANGES IN EQUITY (UNAUDITED)
|
|
|
|
|
|
|
|
|
|
|
|
|
|
|
|
|
|
|
|
|
|
|
|
|
|
|
|
|
|
|
|
|
|
|
|
|
|
|
|
|
| (in millions of Euros) |
|
Share
capital |
|
|
Share
premium |
|
|
Re-
measure
ment |
|
|
Cash
flow
hedges |
|
|
Foreign
currency
translation
reserve |
|
|
Other
reserves |
|
|
Retained
earnings |
|
|
Total |
|
|
Non-
controlling
interests |
|
|
Total
equity |
|
| At January 1, 2023 |
|
|
3 |
|
|
|
420 |
|
|
|
28 |
|
|
|
(10 |
) |
|
|
41 |
|
|
|
101 |
|
|
|
148 |
|
|
|
731 |
|
|
|
21 |
|
|
|
752 |
|
| Net income |
|
|
— |
|
|
|
— |
|
|
|
— |
|
|
|
— |
|
|
|
— |
|
|
|
— |
|
|
|
51 |
|
|
|
51 |
|
|
|
3 |
|
|
|
54 |
|
| Other comprehensive income / (loss) |
|
|
— |
|
|
|
— |
|
|
|
2 |
|
|
|
3 |
|
|
|
(12 |
) |
|
|
— |
|
|
|
— |
|
|
|
(7 |
) |
|
|
(1 |
) |
|
|
(8 |
) |
|
|
|
|
|
|
|
|
|
|
|
|
|
|
|
|
|
|
|
|
|
|
|
|
|
|
|
|
|
|
|
|
|
|
|
|
|
|
|
|
|
| Total comprehensive income / (loss) |
|
|
— |
|
|
|
— |
|
|
|
2 |
|
|
|
3 |
|
|
|
(12 |
) |
|
|
— |
|
|
|
51 |
|
|
|
44 |
|
|
|
2 |
|
|
|
46 |
|
|
|
|
|
|
|
|
|
|
|
|
|
|
|
|
|
|
|
|
|
|
|
|
|
|
|
|
|
|
|
|
|
|
|
|
|
|
|
|
|
|
| Share-based compensation |
|
|
— |
|
|
|
— |
|
|
|
— |
|
|
|
— |
|
|
|
— |
|
|
|
10 |
|
|
|
— |
|
|
|
10 |
|
|
|
— |
|
|
|
10 |
|
| Transactions with non-controlling interests |
|
|
— |
|
|
|
— |
|
|
|
— |
|
|
|
— |
|
|
|
— |
|
|
|
— |
|
|
|
— |
|
|
|
— |
|
|
|
(2 |
) |
|
|
(2 |
) |
|
|
|
|
|
|
|
|
|
|
|
|
|
|
|
|
|
|
|
|
|
|
|
|
|
|
|
|
|
|
|
|
|
|
|
|
|
|
|
|
|
| At June 30, 2023 |
|
|
3 |
|
|
|
420 |
|
|
|
30 |
|
|
|
(7 |
) |
|
|
29 |
|
|
|
111 |
|
|
|
199 |
|
|
|
785 |
|
|
|
21 |
|
|
|
806 |
|
|
|
|
|
|
|
|
|
|
|
|
|
|
|
|
|
|
|
|
|
|
|
|
|
|
|
|
|
|
|
|
|
|
|
|
|
|
|
|
|
|
|
|
|
|
|
|
|
|
|
|
|
|
|
|
|
|
|
|
|
|
|
|
|
|
|
|
|
|
|
|
|
|
|
|
|
|
|
|
|
|
|
| (in millions of Euros) |
|
Share
capital |
|
|
Share
premium |
|
|
Re-
measure
ment |
|
|
Cash
flow
hedges |
|
|
Foreign
currency
translation
reserve |
|
|
Other
reserves |
|
|
Retained
(deficit) /
earnings |
|
|
Total |
|
|
Non-
controlling
interests |
|
|
Total
equity |
|
| At January 1, 2022 |
|
|
3 |
|
|
|
420 |
|
|
|
(94 |
) |
|
|
(4 |
) |
|
|
19 |
|
|
|
83 |
|
|
|
(153 |
) |
|
|
274 |
|
|
|
17 |
|
|
|
291 |
|
| Net income |
|
|
— |
|
|
|
— |
|
|
|
— |
|
|
|
— |
|
|
|
— |
|
|
|
— |
|
|
|
143 |
|
|
|
143 |
|
|
|
4 |
|
|
|
147 |
|
| Other comprehensive income / (loss) |
|
|
— |
|
|
|
— |
|
|
|
125 |
|
|
|
(11 |
) |
|
|
42 |
|
|
|
— |
|
|
|
— |
|
|
|
156 |
|
|
|
— |
|
|
|
156 |
|
|
|
|
|
|
|
|
|
|
|
|
|
|
|
|
|
|
|
|
|
|
|
|
|
|
|
|
|
|
|
|
|
|
|
|
|
|
|
|
|
|
| Total comprehensive income / (loss) |
|
|
— |
|
|
|
— |
|
|
|
125 |
|
|
|
(11 |
) |
|
|
42 |
|
|
|
— |
|
|
|
143 |
|
|
|
299 |
|
|
|
4 |
|
|
|
303 |
|
|
|
|
|
|
|
|
|
|
|
|
|
|
|
|
|
|
|
|
|
|
|
|
|
|
|
|
|
|
|
|
|
|
|
|
|
|
|
|
|
|
| Share-based compensation |
|
|
— |
|
|
|
— |
|
|
|
— |
|
|
|
— |
|
|
|
— |
|
|
|
9 |
|
|
|
— |
|
|
|
9 |
|
|
|
— |
|
|
|
9 |
|
| Transactions with non-controlling interests |
|
|
— |
|
|
|
— |
|
|
|
— |
|
|
|
— |
|
|
|
— |
|
|
|
— |
|
|
|
— |
|
|
|
— |
|
|
|
— |
|
|
|
— |
|
|
|
|
|
|
|
|
|
|
|
|
|
|
|
|
|
|
|
|
|
|
|
|
|
|
|
|
|
|
|
|
|
|
|
|
|
|
|
|
|
|
| At June 30, 2022 |
|
|
3 |
|
|
|
420 |
|
|
|
31 |
|
|
|
(15 |
) |
|
|
61 |
|
|
|
92 |
|
|
|
(10 |
) |
|
|
582 |
|
|
|
21 |
|
|
|
603 |
|
|
|
|
|
|
|
|
|
|
|
|
|
|
|
|
|
|
|
|
|
|
|
|
|
|
|
|
|
|
|
|
|
|
|
|
|
|
|
|
|
|
11
CONSOLIDATED STATEMENT OF CASH FLOWS (UNAUDITED)
|
|
|
|
|
|
|
|
|
|
|
|
|
|
|
|
|
| |
|
Three months ended June 30, |
|
|
Six months ended June 30, |
|
| (in millions of Euros) |
|
2023 |
|
|
2022 |
|
|
2023 |
|
|
2022 |
|
| Net income / (loss) |
|
|
32 |
|
|
|
(32 |
) |
|
|
54 |
|
|
|
147 |
|
| Adjustments |
|
|
|
|
|
|
|
|
|
|
|
|
|
|
|
|
| Depreciation and amortization |
|
|
72 |
|
|
|
70 |
|
|
|
144 |
|
|
|
136 |
|
| Pension and other post-employment benefits service costs |
|
|
5 |
|
|
|
6 |
|
|
|
11 |
|
|
|
11 |
|
| Finance costs - net |
|
|
35 |
|
|
|
32 |
|
|
|
70 |
|
|
|
62 |
|
| Income tax expense / (benefit) |
|
|
12 |
|
|
|
(4 |
) |
|
|
17 |
|
|
|
35 |
|
| Unrealized losses on derivatives - net and from remeasurement of monetary assets and liabilities -
net |
|
|
20 |
|
|
|
143 |
|
|
|
28 |
|
|
|
85 |
|
| Losses on disposal |
|
|
— |
|
|
|
— |
|
|
|
6 |
|
|
|
1 |
|
| Other - net |
|
|
7 |
|
|
|
4 |
|
|
|
10 |
|
|
|
8 |
|
| Change in working capital |
|
|
|
|
|
|
|
|
|
|
|
|
|
|
|
|
| Inventories |
|
|
72 |
|
|
|
— |
|
|
|
150 |
|
|
|
(256 |
) |
| Trade receivables |
|
|
(7 |
) |
|
|
(77 |
) |
|
|
(224 |
) |
|
|
(287 |
) |
| Trade payables |
|
|
(98 |
) |
|
|
5 |
|
|
|
(14 |
) |
|
|
325 |
|
| Other |
|
|
23 |
|
|
|
20 |
|
|
|
6 |
|
|
|
4 |
|
| Change in provisions |
|
|
(1 |
) |
|
|
(2 |
) |
|
|
(2 |
) |
|
|
(4 |
) |
| Pension and other post-employment benefits paid |
|
|
(9 |
) |
|
|
(10 |
) |
|
|
(19 |
) |
|
|
(21 |
) |
| Interest paid |
|
|
(29 |
) |
|
|
(25 |
) |
|
|
(63 |
) |
|
|
(54 |
) |
| Income tax paid |
|
|
(1 |
) |
|
|
(19 |
) |
|
|
(7 |
) |
|
|
(23 |
) |
|
|
|
|
|
|
|
|
|
|
|
|
|
|
|
|
|
| Net cash flows from operating activities |
|
|
133 |
|
|
|
111 |
|
|
|
167 |
|
|
|
169 |
|
|
|
|
|
|
|
|
|
|
|
|
|
|
|
|
|
|
| Purchases of property, plant and equipment |
|
|
(65 |
) |
|
|
(51 |
) |
|
|
(134 |
) |
|
|
(84 |
) |
| Property, plant and equipment grants received |
|
|
— |
|
|
|
— |
|
|
|
1 |
|
|
|
1 |
|
|
|
|
|
|
|
|
|
|
|
|
|
|
|
|
|
|
| Net cash flows used in investing activities |
|
|
(65 |
) |
|
|
(51 |
) |
|
|
(133 |
) |
|
|
(83 |
) |
|
|
|
|
|
|
|
|
|
|
|
|
|
|
|
|
|
| Repayments of long-term borrowings |
|
|
(2 |
) |
|
|
(183 |
) |
|
|
(5 |
) |
|
|
(186 |
) |
| Net change in revolving credit facilities and short-term borrowings |
|
|
(66 |
) |
|
|
124 |
|
|
|
7 |
|
|
|
124 |
|
| Lease repayments |
|
|
(9 |
) |
|
|
(9 |
) |
|
|
(16 |
) |
|
|
(20 |
) |
| Transactions with non-controlling interests |
|
|
(3 |
) |
|
|
(2 |
) |
|
|
(3 |
) |
|
|
(2 |
) |
| Other financing activities |
|
|
— |
|
|
|
5 |
|
|
|
(2 |
) |
|
|
5 |
|
|
|
|
|
|
|
|
|
|
|
|
|
|
|
|
|
|
| Net cash flows used in financing activities |
|
|
(80 |
) |
|
|
(65 |
) |
|
|
(19 |
) |
|
|
(79 |
) |
|
|
|
|
|
|
|
|
|
|
|
|
|
|
|
|
|
| Net (decrease) / increase in cash and cash equivalent |
|
|
(12 |
) |
|
|
(5 |
) |
|
|
15 |
|
|
|
7 |
|
| Cash and cash equivalents - beginning of period |
|
|
193 |
|
|
|
160 |
|
|
|
166 |
|
|
|
147 |
|
| Transfer of cash and cash equivalents classified from / (to) assets classified as held for
sale |
|
|
(2 |
) |
|
|
— |
|
|
|
(1 |
) |
|
|
— |
|
| Effect of exchange rate changes on cash and cash equivalents |
|
|
(1 |
) |
|
|
1 |
|
|
|
(2 |
) |
|
|
2 |
|
|
|
|
|
|
|
|
|
|
|
|
|
|
|
|
|
|
| Cash and cash equivalents - end of period |
|
|
178 |
|
|
|
156 |
|
|
|
178 |
|
|
|
156 |
|
|
|
|
|
|
|
|
|
|
|
|
|
|
|
|
|
|
12
SEGMENT ADJUSTED EBITDA
|
|
|
|
|
|
|
|
|
|
|
|
|
|
|
|
|
| |
|
Three months ended June 30, |
|
|
Six months ended June 30, |
|
| (in millions of Euros) |
|
2023 |
|
|
2022 |
|
|
2023 |
|
|
2022 |
|
| P&ARP |
|
|
79 |
|
|
|
95 |
|
|
|
134 |
|
|
|
177 |
|
| A&T |
|
|
96 |
|
|
|
63 |
|
|
|
169 |
|
|
|
116 |
|
| AS&I |
|
|
39 |
|
|
|
46 |
|
|
|
82 |
|
|
|
83 |
|
| Holdings and Corporate |
|
|
(5 |
) |
|
|
(6 |
) |
|
|
(11 |
) |
|
|
(11 |
) |
|
|
|
|
|
|
|
|
|
|
|
|
|
|
|
|
|
| Total |
|
|
209 |
|
|
|
198 |
|
|
|
374 |
|
|
|
365 |
|
|
|
|
|
|
|
|
|
|
|
|
|
|
|
|
|
|
SHIPMENTS AND REVENUE BY PRODUCT LINE
|
|
|
|
|
|
|
|
|
|
|
|
|
|
|
|
|
| |
|
Three months ended June 30, |
|
|
Six months ended June 30, |
|
| (in k metric tons) |
|
2023 |
|
|
2022 |
|
|
2023 |
|
|
2022 |
|
| Packaging rolled products |
|
|
194 |
|
|
|
221 |
|
|
|
377 |
|
|
|
427 |
|
| Automotive rolled products |
|
|
71 |
|
|
|
61 |
|
|
|
141 |
|
|
|
120 |
|
| Specialty and other thin-rolled products |
|
|
7 |
|
|
|
10 |
|
|
|
13 |
|
|
|
21 |
|
| Aerospace rolled products |
|
|
26 |
|
|
|
20 |
|
|
|
51 |
|
|
|
36 |
|
| Transportation, industry, defense and other rolled products |
|
|
34 |
|
|
|
40 |
|
|
|
67 |
|
|
|
79 |
|
| Automotive extruded products |
|
|
32 |
|
|
|
30 |
|
|
|
66 |
|
|
|
60 |
|
| Other extruded products |
|
|
34 |
|
|
|
42 |
|
|
|
72 |
|
|
|
82 |
|
|
|
|
|
|
|
|
|
|
|
|
|
|
|
|
|
|
| Total shipments |
|
|
398 |
|
|
|
424 |
|
|
|
787 |
|
|
|
825 |
|
|
|
|
|
|
|
|
|
|
|
|
|
|
|
|
|
|
|
|
|
|
|
| (in millions of Euros) |
|
|
|
|
|
|
|
|
|
|
|
|
| Packaging rolled products |
|
|
699 |
|
|
|
985 |
|
|
|
1,384 |
|
|
|
1,837 |
|
| Automotive rolled products |
|
|
312 |
|
|
|
308 |
|
|
|
616 |
|
|
|
571 |
|
| Specialty and other thin-rolled products |
|
|
38 |
|
|
|
55 |
|
|
|
79 |
|
|
|
108 |
|
| Aerospace rolled products |
|
|
271 |
|
|
|
183 |
|
|
|
524 |
|
|
|
326 |
|
| Transportation, industry, defense and other rolled products |
|
|
192 |
|
|
|
278 |
|
|
|
391 |
|
|
|
520 |
|
| Automotive extruded products |
|
|
250 |
|
|
|
247 |
|
|
|
510 |
|
|
|
473 |
|
| Other extruded products |
|
|
193 |
|
|
|
254 |
|
|
|
416 |
|
|
|
487 |
|
| Other and inter-segment eliminations |
|
|
(5 |
) |
|
|
(35 |
) |
|
|
(14 |
) |
|
|
(68 |
) |
|
|
|
|
|
|
|
|
|
|
|
|
|
|
|
|
|
| Total revenue |
|
|
1,950 |
|
|
|
2,275 |
|
|
|
3,906 |
|
|
|
4,254 |
|
|
|
|
|
|
|
|
|
|
|
|
|
|
|
|
|
|
13
NON-GAAP MEASURES
Reconciliation of Revenue to VAR (a non-GAAP measure)
|
|
|
|
|
|
|
|
|
|
|
|
|
|
|
|
|
| |
|
Three months ended June 30, |
|
|
Six months ended June 30, |
|
| (in millions of Euros) |
|
2023 |
|
|
2022 |
|
|
2023 |
|
|
2022 |
|
| Revenue |
|
|
1,950 |
|
|
|
2,275 |
|
|
|
3,906 |
|
|
|
4,254 |
|
| Hedged cost of alloyed metal |
|
|
(1,188 |
) |
|
|
(1,550 |
) |
|
|
(2,398 |
) |
|
|
(2,777 |
) |
| Revenue from incidental activities |
|
|
(7 |
) |
|
|
(5 |
) |
|
|
(14 |
) |
|
|
(11 |
) |
| Metal price lag |
|
|
30 |
|
|
|
(16 |
) |
|
|
45 |
|
|
|
(110 |
) |
|
|
|
|
|
|
|
|
|
|
|
|
|
|
|
|
|
| VAR |
|
|
785 |
|
|
|
704 |
|
|
|
1,539 |
|
|
|
1,356 |
|
|
|
|
|
|
|
|
|
|
|
|
|
|
|
|
|
|
Reconciliation of net income to Adjusted EBITDA (a non-GAAP measure)
|
|
|
|
|
|
|
|
|
|
|
|
|
|
|
|
|
| |
|
Three months ended June 30, |
|
|
Six months ended June 30, |
|
| (in millions of Euros) |
|
2023 |
|
|
2022 |
|
|
2023 |
|
|
2022 |
|
| Net income / (loss) |
|
|
32 |
|
|
|
(32 |
) |
|
|
54 |
|
|
|
147 |
|
| Income tax expense / (benefit) |
|
|
12 |
|
|
|
(4 |
) |
|
|
17 |
|
|
|
35 |
|
|
|
|
|
|
|
|
|
|
|
|
|
|
|
|
|
|
| Income / (loss) before tax |
|
|
44 |
|
|
|
(36 |
) |
|
|
71 |
|
|
|
182 |
|
| Finance costs - net |
|
|
35 |
|
|
|
32 |
|
|
|
70 |
|
|
|
62 |
|
|
|
|
|
|
|
|
|
|
|
|
|
|
|
|
|
|
| Income / (loss) from operations |
|
|
79 |
|
|
|
(4 |
) |
|
|
141 |
|
|
|
244 |
|
| Depreciation and amortization |
|
|
72 |
|
|
|
70 |
|
|
|
144 |
|
|
|
136 |
|
| Unrealized losses on derivatives |
|
|
20 |
|
|
|
141 |
|
|
|
28 |
|
|
|
84 |
|
| Unrealized exchange losses from the remeasurement of monetary assets and |
|
|
1 |
|
|
|
2 |
|
|
|
— |
|
|
|
1 |
|
| liabilities - net |
|
|
|
|
|
|
|
|
|
|
|
|
|
|
|
|
| Share based compensation costs |
|
|
7 |
|
|
|
5 |
|
|
|
10 |
|
|
|
9 |
|
| Metal price lag (A) |
|
|
30 |
|
|
|
(16 |
) |
|
|
45 |
|
|
|
(110 |
) |
| Losses on disposal |
|
|
— |
|
|
|
— |
|
|
|
6 |
|
|
|
1 |
|
|
|
|
|
|
|
|
|
|
|
|
|
|
|
|
|
|
| Adjusted EBITDA |
|
|
209 |
|
|
|
198 |
|
|
|
374 |
|
|
|
365 |
|
|
|
|
|
|
|
|
|
|
|
|
|
|
|
|
|
|
| (A) |
Metal price lag represents the financial impact of the timing difference between when aluminium prices included
within Constellium's Revenue are established and when aluminium purchase prices included in Cost of sales are established. The Group accounts for inventory using a weighted average price basis and this adjustment aims to remove the effect of
volatility in LME prices. The calculation of the Group metal price lag adjustment is based on an internal standardized methodology calculated at each of Constellium’s manufacturing sites and is primarily calculated as the average value of
product recorded in inventory, which approximates the spot price in the market, less the average value transferred out of inventory, which is the weighted average of the metal element of cost of sales, based on the quantity sold in the year.
|
14
Reconciliation of net cash flows from operating activities to Free Cash Flow (a non-GAAP measure)
|
|
|
|
|
|
|
|
|
|
|
|
|
|
|
|
|
| |
|
Three months ended June 30, |
|
|
Six months ended June 30, |
|
| (in millions of Euros) |
|
2023 |
|
|
2022 |
|
|
2023 |
|
|
2022 |
|
| Net cash flows from operating activities |
|
|
133 |
|
|
|
111 |
|
|
|
167 |
|
|
|
169 |
|
| Purchases of property, plant and equipment, net of grants received |
|
|
(65 |
) |
|
|
(51 |
) |
|
|
(133 |
) |
|
|
(83 |
) |
|
|
|
|
|
|
|
|
|
|
|
|
|
|
|
|
|
| Free Cash Flow |
|
|
68 |
|
|
|
60 |
|
|
|
34 |
|
|
|
86 |
|
|
|
|
|
|
|
|
|
|
|
|
|
|
|
|
|
|
Reconciliation of borrowings to Net debt (a non-GAAP measure)
|
|
|
|
|
|
|
|
|
| (in millions of Euros) |
|
At June 30, 2023 |
|
|
At December 31, 2022 |
|
| Borrowings |
|
|
2,028 |
|
|
|
2,056 |
|
| Fair value of net debt derivatives, net of margin calls |
|
|
— |
|
|
|
1 |
|
| Cash and cash equivalents |
|
|
(178 |
) |
|
|
(166 |
) |
|
|
|
|
|
|
|
|
|
| Net debt |
|
|
1,850 |
|
|
|
1,891 |
|
|
|
|
|
|
|
|
|
|
15
Non-GAAP measures
In addition to the results reported in accordance with International Financial Reporting Standards (“IFRS”), this press release includes information
regarding certain financial measures which are not prepared in accordance with IFRS (“non-GAAP measures”). The non-GAAP measures used in this press release
are: VAR, Adjusted EBITDA, Adjusted EBITDA per metric ton, Free Cash Flow and Net debt. Reconciliations to the most directly comparable IFRS financial measures are presented in the schedules to this press release. We believe these non- GAAP measures
are important supplemental measures of our operating and financial performance. By providing these measures, together with the reconciliations, we believe we are enhancing investors’ understanding of our business, our results of operations and
our financial position, as well as assisting investors in evaluating the extent to which we are executing our strategic initiatives. However, these non-GAAP financial measures supplement our IFRS disclosures
and should not be considered an alternative to the IFRS measures and may not be comparable to similarly titled measures of other companies.
Value-Added
Revenue (“VAR”) is defined as revenue, excluding revenue from incidental activities, minus cost of metal which includes, cost of aluminium adjusted for metal lag, cost of other alloying metals, freight out costs, and realized gains and
losses from hedging. Management believes that VAR is a useful measure of our activity as it eliminates the impact of metal costs from our revenue and reflects the value-added elements of our activity. VAR eliminates the impact of metal price
fluctuations which are not under our control and which we generally pass-through to our customers and facilitates comparisons from period to period. VAR is not a presentation made in accordance with IFRS and should not be considered as an
alternative to revenue determined in accordance with IFRS.
In considering the financial performance of the business, management and our chief operational
decision maker, as defined by IFRS, analyze the primary financial performance measure of Adjusted EBITDA in all of our business segments. The most directly comparable IFRS measure to Adjusted EBITDA is our net income or loss for the period. We
believe Adjusted EBITDA, as defined below, is useful to investors and is used by our management for measuring profitability because it excludes the impact of certain non-cash charges, such as depreciation,
amortization, impairment and unrealized gains and losses on derivatives as well as items that do not impact the day-to-day operations and that management in many cases
does not directly control or influence. Therefore, such adjustments eliminate items which have less bearing on our core operating performance.
Adjusted
EBITDA measures are frequently used by securities analysts, investors and other interested parties in their evaluation of Constellium and in comparison to other companies, many of which present an Adjusted EBITDA-related performance measure when
reporting their results.
16
Adjusted EBITDA is defined as income / (loss) from continuing operations before income taxes, results from
joint ventures, net finance costs, other expenses and depreciation and amortization as adjusted to exclude restructuring costs, impairment charges, unrealized gains or losses on derivatives and on foreign exchange differences on transactions which
do not qualify for hedge accounting, metal price lag, share based compensation expense, effects of certain purchase accounting adjustments, start-up and development costs or acquisition, integration and
separation costs, certain incremental costs and other exceptional, unusual or generally non-recurring items.
Adjusted EBITDA is the measure of
performance used by management in evaluating our operating performance, in preparing internal forecasts and budgets necessary for managing our business and, specifically in relation to the exclusion of the effect of favorable or unfavorable metal
price lag, this measure allows management and the investor to assess operating results and trends without the impact of our accounting for inventories. We use the weighted average cost method in accordance with IFRS which leads to the purchase price
paid for metal impacting our cost of goods sold and therefore profitability in the period subsequent to when the related sales price impacts our revenues. Management believes this measure also provides additional information used by our lending
facilities providers with respect to the ongoing performance of our underlying business activities. Historically, we have used Adjusted EBITDA in calculating our compliance with financial covenants under certain of our loan facilities.
Adjusted EBITDA is not a presentation made in accordance with IFRS, is not a measure of financial condition, liquidity or profitability and should not be
considered as an alternative to profit or loss for the period, revenues or operating cash flows determined in accordance with IFRS.
Free Cash Flow is
defined as net cash flow from operating activities less capital expenditure, net of grants received. Management believes that Free Cash Flow is a useful measure of the net cash flow generated or used by the business as it takes into account both the
cash generated or consumed by operating activities, including working capital, and the capital expenditure requirements of the business. However, Free Cash Flow is not a presentation made in accordance with IFRS and should not be considered as an
alternative to operating cash flows determined in accordance with IFRS. Free Cash Flow has certain inherent limitations, including the fact that it does not represent residual cash flows available for discretionary spending, notably because it does
not reflect principal repayments required in connection with our debt or capital lease obligations.
Net debt is defined as borrowings plus or minus the
fair value of cross currency basis swaps net of margin calls less cash and cash equivalents and cash pledged for the issuance of guarantees. Management believes that Net debt is a useful measure of indebtedness because it takes into account the cash
and cash equivalent balances held by the Company as well as the total external debt of the Company. Net debt is not a presentation made in accordance with IFRS, and should not be considered as an alternative to borrowings determined in accordance
with IFRS.
17
Exhibit 99.2 Second Quarter 2023 Earnings Call July 26, 2023
Forward-Looking Statements Certain statements contained in this
presentation may constitute forward-looking statements within the meaning of the Private Securities Litigation Reform Act of 1995. This presentation may contain “forward-looking statements” with respect to our business, results of
operations and financial condition, and our expectations or beliefs concerning future events and conditions. You can identify forward- looking statements because they contain words such as, but not limited to, “believes,”
“expects,” “may,” “should,” “approximately,” “anticipates,” “estimates,” “intends,” “plans,” “targets,” likely,” “will,”
“would,” “could” and similar expressions (or the negative of these terminologies or expressions). All forward-looking statements involve risks and uncertainties. Many risks and uncertainties are inherent in our industry and
markets, while others are more specific to our business and operations. These risks and uncertainties include, but are not limited to: market competition; economic downturn; disruption to business operations; the Russian war on Ukraine; the
inability to meet customer demand and quality requirements; the loss of key customers, suppliers or other business relationships; supply disruptions; excessive inflation; the capacity and effectiveness of our hedging policy activities; the loss of
key employees; levels of indebtedness which could limit our operating flexibility and opportunities; and other risk factors set forth under the heading “Risk Factors” in our Annual Report on Form 20-F, and as described from time to time
in subsequent reports filed with the U.S. Securities and Exchange Commission. The occurrence of the events described and the achievement of the expected results depend on many events, some or all of which are not predictable or within our control.
Consequently, actual results may differ materially from the forward-looking statements contained in this press release. We undertake no obligation to update or revise any forward-looking statement as a result of new information, future events or
otherwise, except as required by law. Second Quarter 2023 – Earnings Call 2
Non-GAAP Measures This presentation includes information regarding
certain non-GAAP financial measures, including VAR, Adjusted EBITDA, Adjusted EBITDA per metric ton, Free Cash Flow and Net debt. These measures are presented because management uses this information to monitor and evaluate financial results and
trends and believes this information to also be useful for investors. Adjusted EBITDA measures are frequently used by securities analysts, investors and other interested parties in their evaluation of Constellium and in comparison to other
companies, many of which present an adjusted EBITDA-related performance measure when reporting their results. VAR, Adjusted EBITDA, Adjusted EBITDA per Metric Ton, Free Cash Flow and Net debt are not presentations made in accordance with IFRS and
may not be comparable to similarly titled measures of other companies. These non-GAAP financial measures supplement our IFRS disclosures and should not be considered an alternative to the IFRS measures. This presentation provides a reconciliation of
non-GAAP financial measures to the most directly comparable GAAP financial measures. We are not able to provide a reconciliation of Adjusted EBITDA guidance to net income, the comparable GAAP measure, because certain items that are excluded from
Adjusted EBITDA cannot be reasonably predicted or are not in our control. In particular, we are unable to forecast the timing or magnitude of realized and unrealized gains and losses on derivative instruments, metal lag, impairment or restructuring
charges, or taxes without unreasonable efforts, and these items could significantly impact, either individually or in the aggregate, our net income in the future. Second Quarter 2023 – Earnings Call 3
Jean-Marc Germain Chief Executive Officer

Q2 2023 Highlights Adjusted EBITDA Bridge (1) Ø Safety: YTD
recordable case rate of 1.9 € in millions Ø Shipments: 398kt (-6% YoY) Ø Revenue: €2.0 billion (-14% YoY) +5% Ø Value-Added Revenue: €785 million (+11% YoY) Ø Net income: €32 million Ø Record Adjusted
EBITDA: €209 million (+ 5% YoY) Ø Record Adjusted EBITDA in A&T Net Debt / LTM Adjusted EBITDA Ø Cash from Operations: €133 million Down 0.3x Ø Free Cash Flow: €68 million Ø Leverage: 2.7x at June 30, 2023
Ø Announced sale of our soft alloy extrusion business in Germany for cash consideration of €48.8 million (1) Recordable case rate measures the number of fatalities, serious injuries, lost-time injuries, restricted work injuries, or
medical treatments per one million hours worked. Very strong Q2 results despite significant inflationary headwinds Second Quarter 2023 – Earnings Call 5

Jack Guo Chief Financial Officer
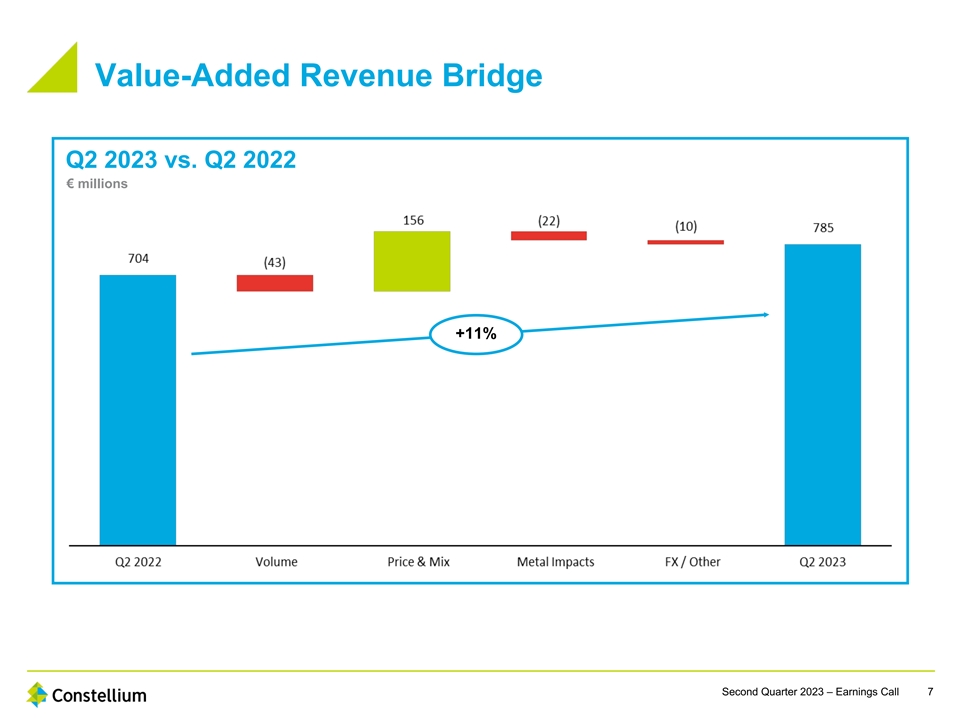
Value-Added Revenue Bridge Q2 2023 vs. Q2 2022 € millions +11%
Second Quarter 2023 – Earnings Call 7
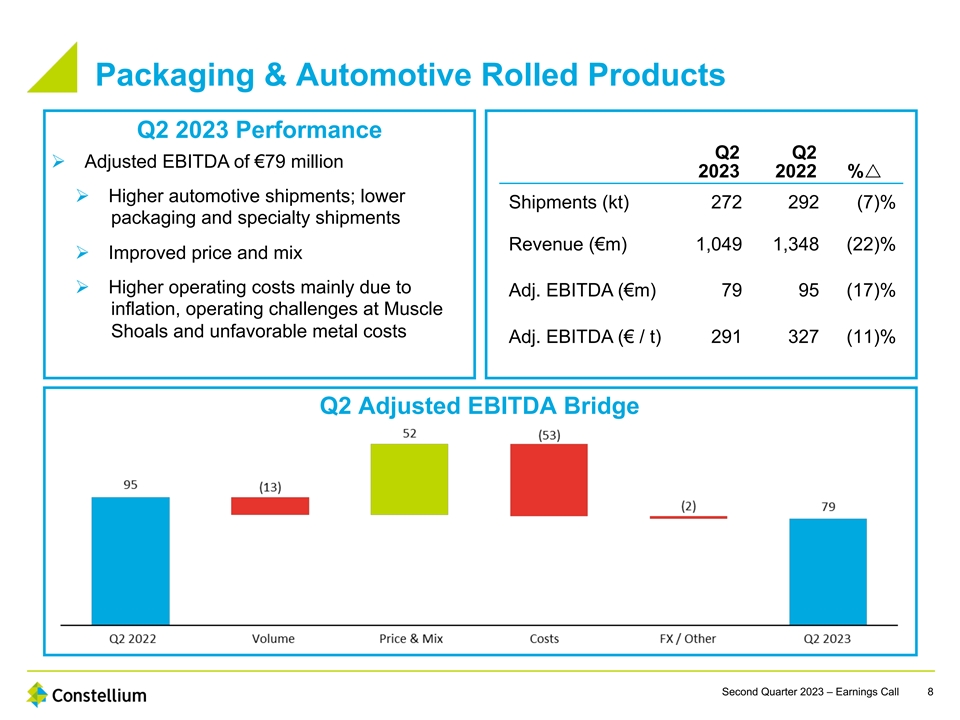
Packaging & Automotive Rolled Products Q2 2023 Performance Q2 Q2
Ø Adjusted EBITDA of €79 million 2023 2022 %r Ø Higher automotive shipments; lower Shipments (kt) 272 292 ( 7) % packaging and specialty shipments Revenue (€m) 1,049 1,348 ( 22)% Ø Improved price and mix Ø Higher
operating costs mainly due to Adj. EBITDA (€m) 79 95 (17) % inflation, operating challenges at Muscle Shoals and unfavorable metal costs Adj. EBITDA (€ / t) 291 327 ( 11)% Q2 Adjusted EBITDA Bridge Second Quarter 2023 – Earnings
Call 8
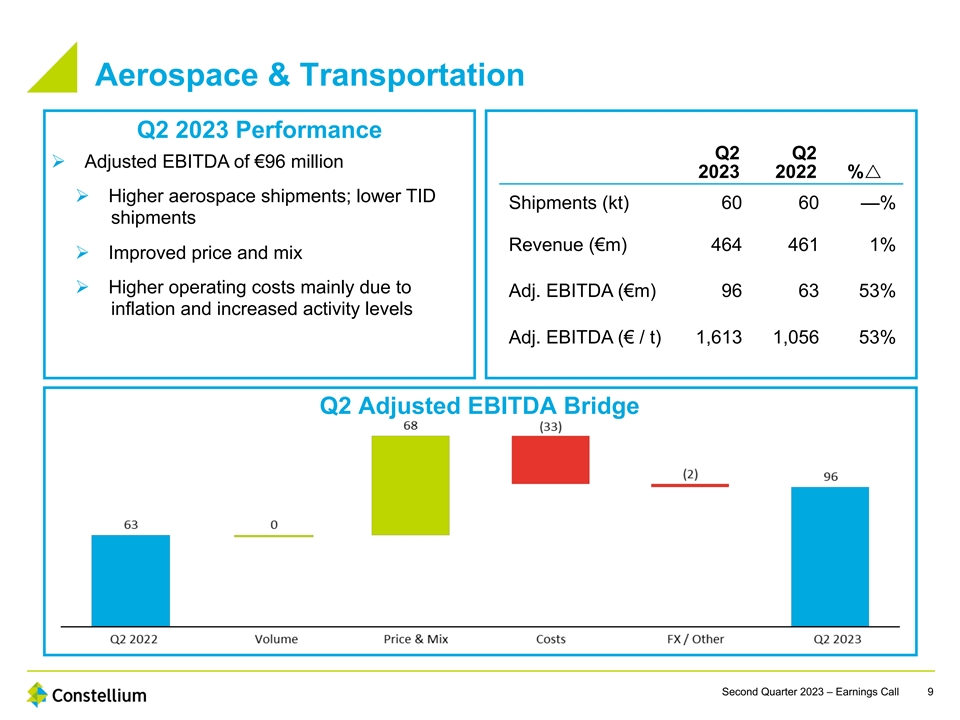
Aerospace & Transportation Q2 2023 Performance Q2 Q2 Ø Adjusted
EBITDA of €96 million 2023 2022 %r Ø Higher aerospace shipments; lower TID Shipments (kt) 60 60 — % shipments Revenue (€m) 464 461 1 % Ø Improved price and mix Ø Higher operating costs mainly due to Adj. EBITDA
(€m) 96 63 53% inflation and increased activity levels Adj. EBITDA (€ / t) 1,613 1,056 53 % Q2 Adjusted EBITDA Bridge Second Quarter 2023 – Earnings Call 9
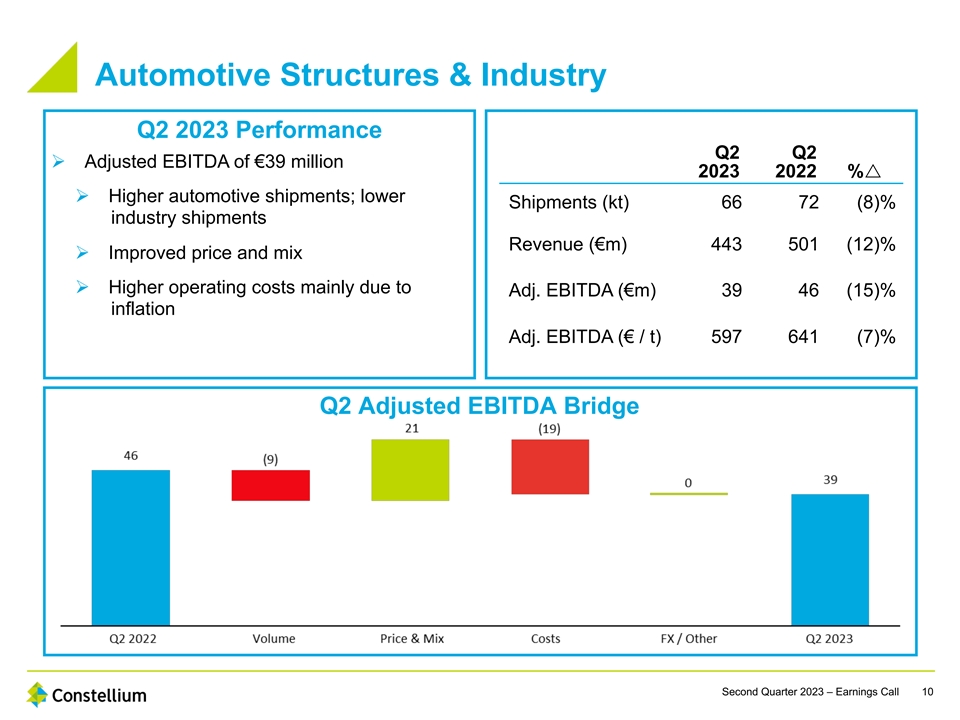
Automotive Structures & Industry Q2 2023 Performance Q2 Q2 Ø
Adjusted EBITDA of €39 million 2023 2022 %r Ø Higher automotive shipments; lower Shipments (kt) 66 72 (8)% industry shipments Revenue (€m) 443 501 (12) % Ø Improved price and mix Ø Higher operating costs mainly due to Adj.
EBITDA (€m) 39 46 ( 15)% inflation Adj. EBITDA (€ / t) 597 641 ( 7) % Q2 Adjusted EBITDA Bridge Second Quarter 2023 – Earnings Call 10
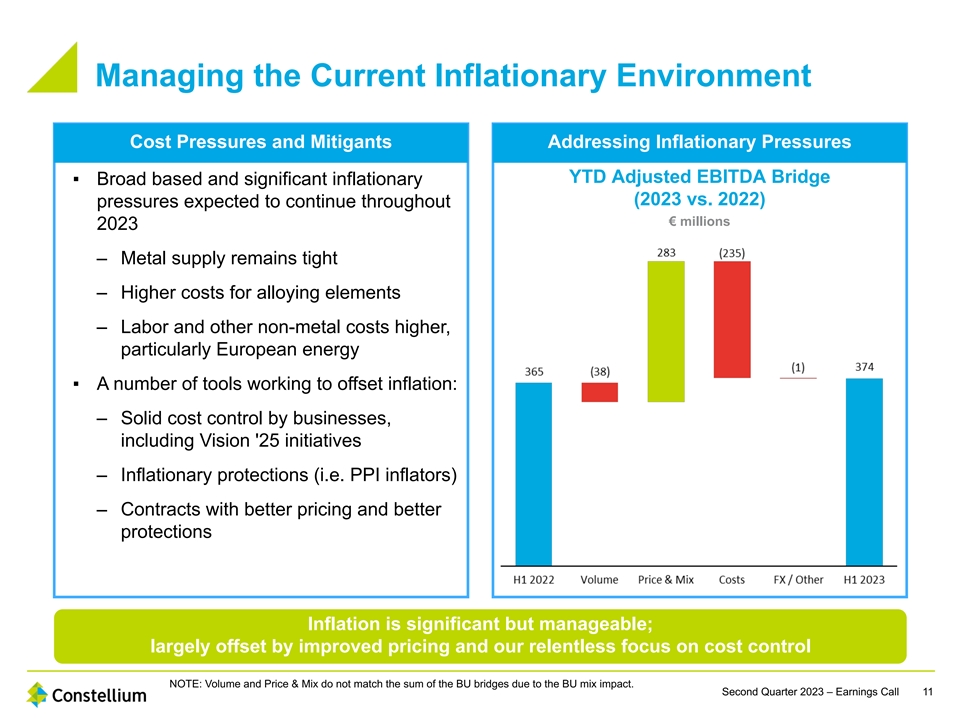
Managing the Current Inflationary Environment Cost Pressures and
Mitigants Addressing Inflationary Pressures YTD Adjusted EBITDA Bridge ▪ Broad based and significant inflationary (2023 vs. 2022) pressures expected to continue throughout € millions 2023 – Metal supply remains tight – Higher
costs for alloying elements – Labor and other non-metal costs higher, particularly European energy ▪ A number of tools working to offset inflation: – Solid cost control by businesses, including Vision '25 initiatives –
Inflationary protections (i.e. PPI inflators) – Contracts with better pricing and better protections Inflation is significant but manageable; largely offset by improved pricing and our relentless focus on cost control NOTE: Volume and Price
& Mix do not match the sum of the BU bridges due to the BU mix impact. Second Quarter 2023 – Earnings Call 11
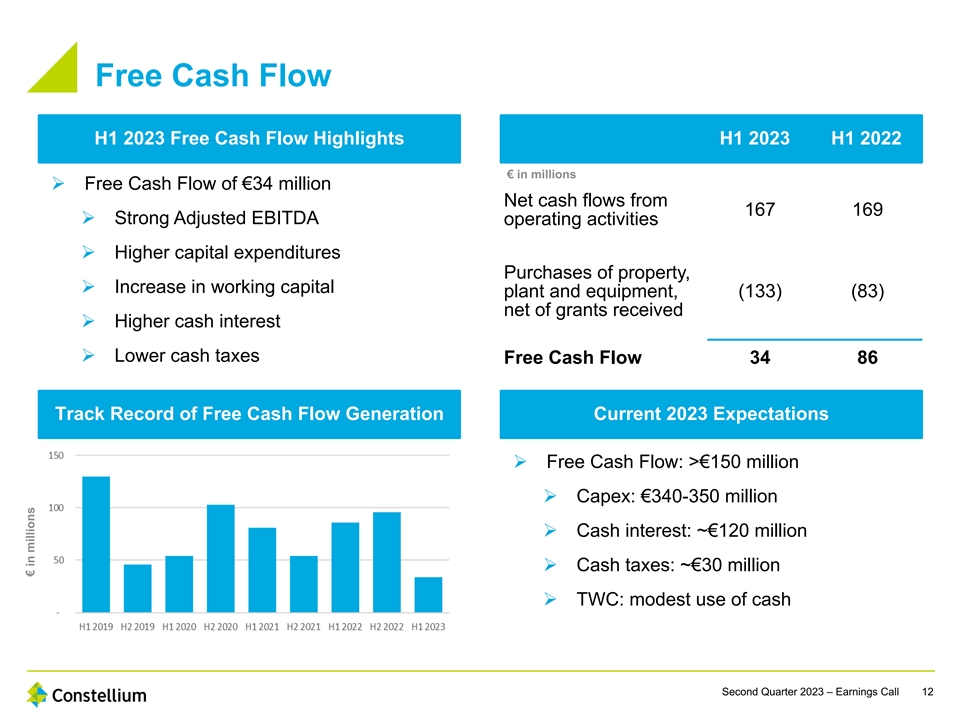
Free Cash Flow H1 2023 Free Cash Flow Highlights H1 2023 H1 2022
€ in millions Ø Free Cash Flow of €34 million Net cash flows from 167 169 Ø Strong Adjusted EBITDA operating activities Ø Higher capital expenditures Purchases of property, Ø Increase in working capital plant and
equipment, (133) (83) net of grants received Ø Higher cash interest Ø Lower cash taxes Free Cash Flow 34 86 Track Record of Free Cash Flow Generation Current 2023 Expectations Ø Free Cash Flow: >€150 million Ø Capex:
€340-350 million Ø Cash interest: ~€120 million Ø Cash taxes: ~€30 million Ø TWC: modest use of cash Second Quarter 2023 – Earnings Call 12 € in millions

Net Debt and Liquidity Net Debt and Leverage Debt / Liquidity
Highlights € in millions Ø Leverage at 2.7x, a multi-year low Ø Balance sheet approaching target leverage of 2.5x; long-term target leverage range of 1.5x to 2.5x Ø Completed redemption of $50 million of 2026 bonds in July 2023
Ø No near-term bond maturities Ø Strong liquidity position Leverage: Net Debt / LTM Adjusted EBITDA (1) Maturity Profile Liquidity € in millions € in millions Strong balance sheet and improved financial flexibility give us
confidence to manage varying business conditions (1) See Borrowings Table in the Appendix for more details. Second Quarter 2023 – Earnings Call 13

Jean-Marc Germain Chief Executive Officer
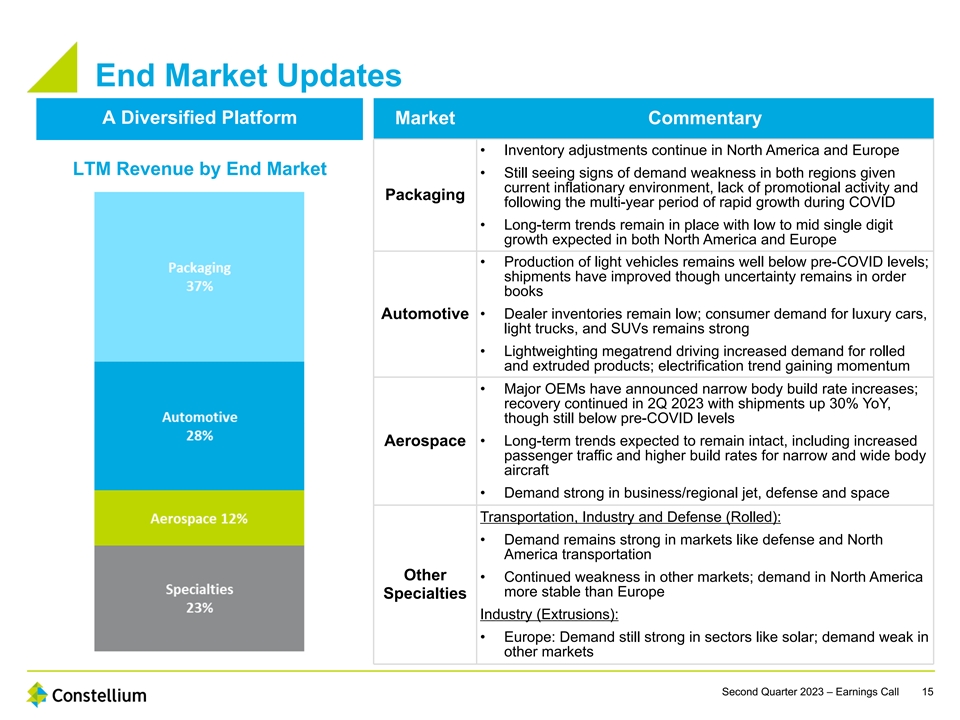
End Market Updates A Diversified Platform Market Commentary •
Inventory adjustments continue in North America and Europe LTM Revenue by End Market • Still seeing signs of demand weakness in both regions given current inflationary environment, lack of promotional activity and Packaging following the
multi-year period of rapid growth during COVID • Long-term trends remain in place with low to mid single digit growth expected in both North America and Europe • Production of light vehicles remains well below pre-COVID levels; shipments
have improved though uncertainty remains in order books Automotive • Dealer inventories remain low; consumer demand for luxury cars, light trucks, and SUVs remains strong • Lightweighting megatrend driving increased demand for rolled and
extruded products; electrification trend gaining momentum • Major OEMs have announced narrow body build rate increases; recovery continued in 2Q 2023 with shipments up 30% YoY, though still below pre-COVID levels • Long-term trends
expected to remain intact, including increased Aerospace passenger traffic and higher build rates for narrow and wide body aircraft • Demand strong in business/regional jet, defense and space Transportation, Industry and Defense (Rolled):
• Demand remains strong in markets like defense and North America transportation Other • Continued weakness in other markets; demand in North America more stable than Europe Specialties Industry (Extrusions): • Europe: Demand still
strong in sectors like solar; demand weak in other markets Second Quarter 2023 – Earnings Call 15
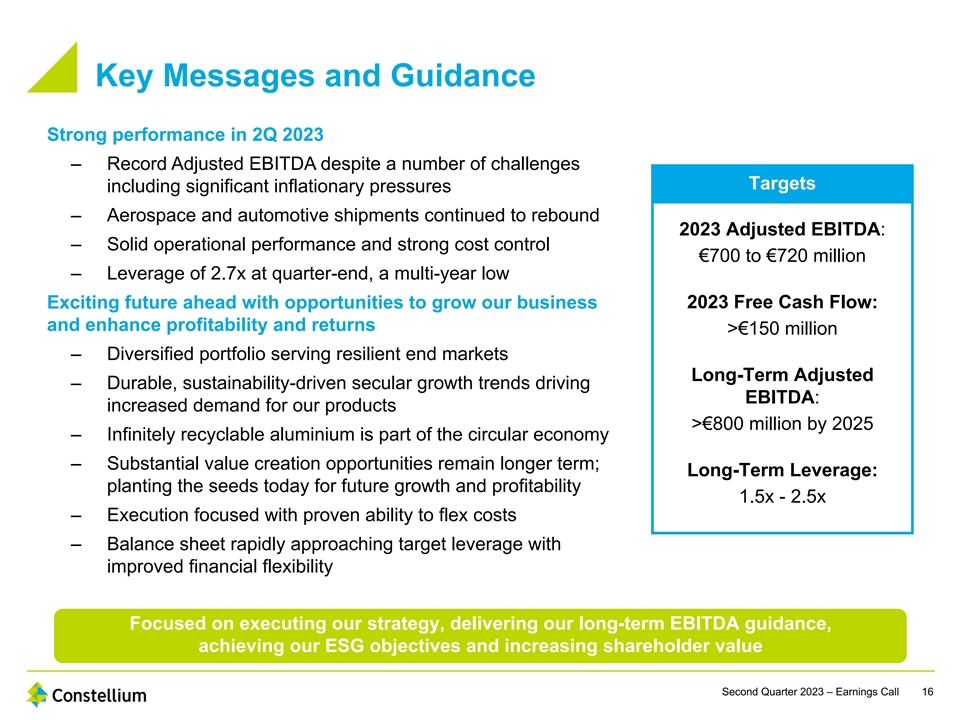
Key Messages and Guidance Strong performance in 2Q 2023 – Record
Adjusted EBITDA despite a number of challenges Targets including significant inflationary pressures – Aerospace and automotive shipments continued to rebound 2023 Adjusted EBITDA: – Solid operational performance and strong cost control
€700 to €720 million – Leverage of 2.7x at quarter-end, a multi-year low 2023 Free Cash Flow: Exciting future ahead with opportunities to grow our business and enhance profitability and returns >€150 million –
Diversified portfolio serving resilient end markets Long-Term Adjusted – Durable, sustainability-driven secular growth trends driving EBITDA: increased demand for our products >€800 million by 2025 – Infinitely recyclable
aluminium is part of the circular economy – Substantial value creation opportunities remain longer term; Long-Term Leverage: planting the seeds today for future growth and profitability 1.5x - 2.5x – Execution focused with proven ability
to flex costs – Balance sheet rapidly approaching target leverage with improved financial flexibility Focused on executing our strategy, delivering our long-term EBITDA guidance, achieving our ESG objectives and increasing shareholder value
Second Quarter 2023 – Earnings Call 16
Appendix Second Quarter 2023 – Earnings Call 17
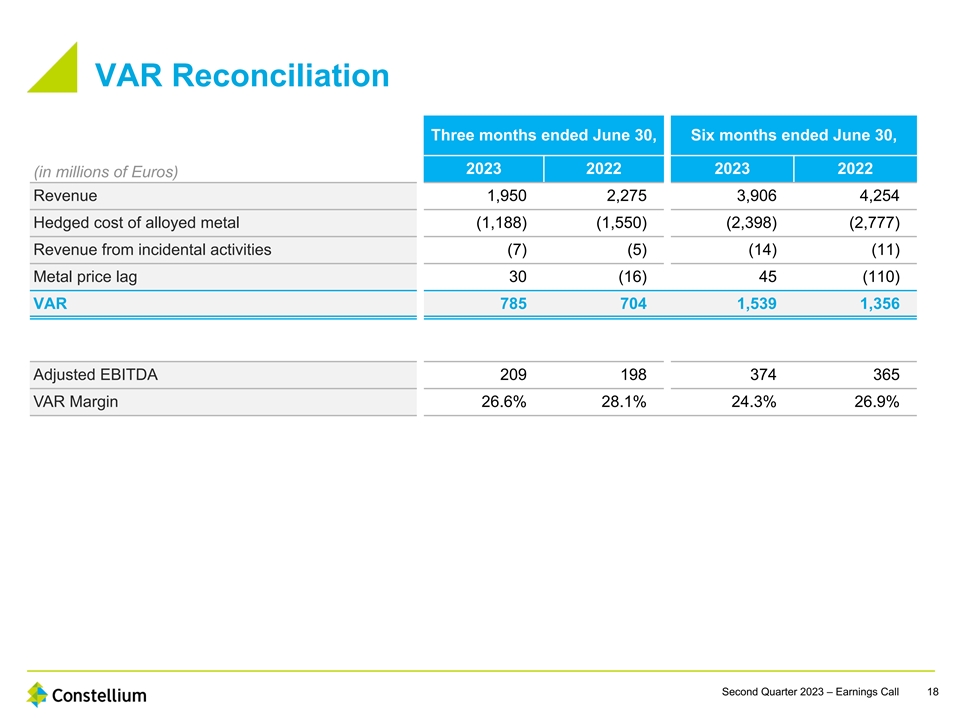
VAR Reconciliation Three months ended June 30, Six months ended June
30, 2023 2022 2023 2022 (in millions of Euros) Revenue 1,950 2,275 3,906 4,254 Hedged cost of alloyed metal (1,188) (1,550) (2,398) (2,777) Revenue from incidental activities (7) (5) (14) (11) Metal price lag 30 (16) 45 (110) VAR 785 704 1,539 1,356
Adjusted EBITDA 209 198 374 365 VAR Margin 2 6.6% 2 8.1 % 24.3% 2 6.9% Second Quarter 2023 – Earnings Call 18
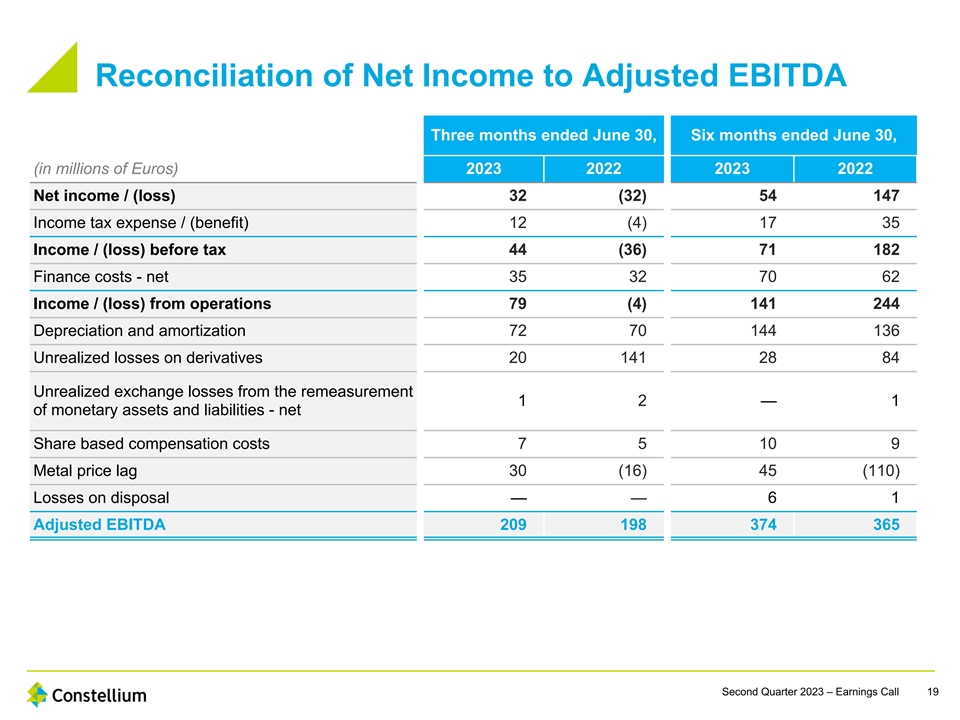
Reconciliation of Net Income to Adjusted EBITDA Three months ended June
30, Six months ended June 30, (in millions of Euros) 2023 2022 2023 2022 Net income / (loss) 32 (32) 54 147 Income tax expense / (benefit) 12 (4) 17 35 Income / (loss) before tax 44 (36) 71 182 Finance costs - net 35 32 70 62 Income / (loss) from
operations 79 (4) 141 244 Depreciation and amortization 72 70 144 136 Unrealized losses on derivatives 20 141 28 84 Unrealized exchange losses from the remeasurement 1 2 — 1 of monetary assets and liabilities - net Share based compensation
costs 7 5 10 9 Metal price lag 30 (16) 45 (110) Losses on disposal — — 6 1 Adjusted EBITDA 209 198 374 365 Second Quarter 2023 – Earnings Call 19
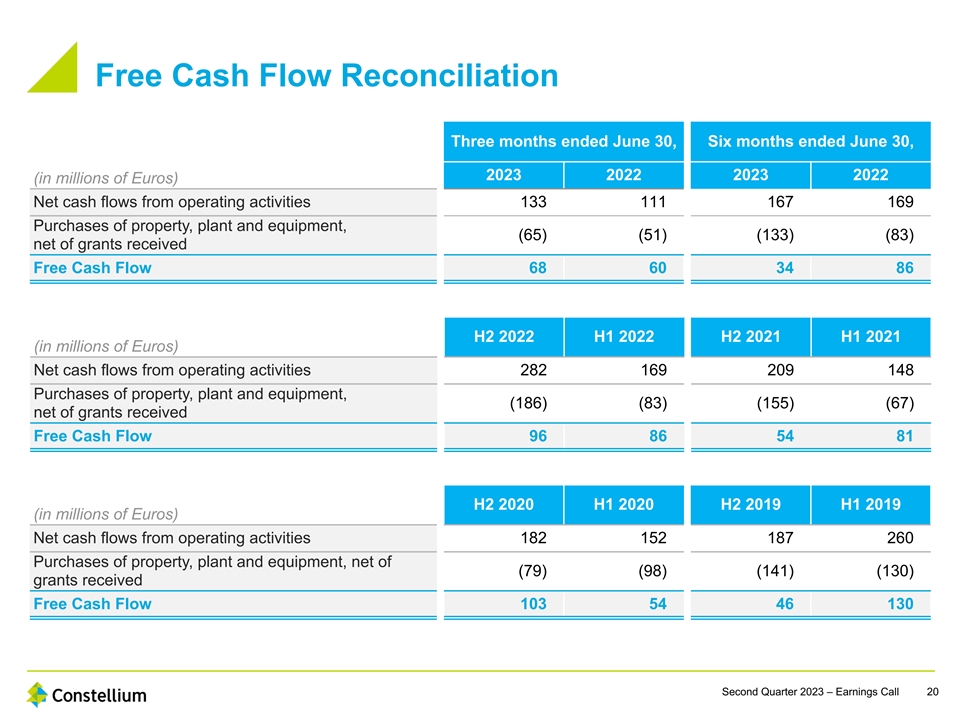
Free Cash Flow Reconciliation Three months ended June 30, Six months
ended June 30, 2023 2022 2023 2022 (in millions of Euros) Net cash flows from operating activities 133 111 167 169 Purchases of property, plant and equipment, (65) (51) (133) (83) net of grants received Free Cash Flow 68 60 34 86 H2 2022 H1 2022 H2
2021 H1 2021 (in millions of Euros) Net cash flows from operating activities 282 169 209 148 Purchases of property, plant and equipment, (186) (83) (155) (67) net of grants received Free Cash Flow 96 86 54 81 H2 2020 H1 2020 H2 2019 H1 2019 (in
millions of Euros) Net cash flows from operating activities 182 152 187 260 Purchases of property, plant and equipment, net of (79) (98) (141) (130) grants received Free Cash Flow 103 54 46 130 Second Quarter 2023 – Earnings Call 20
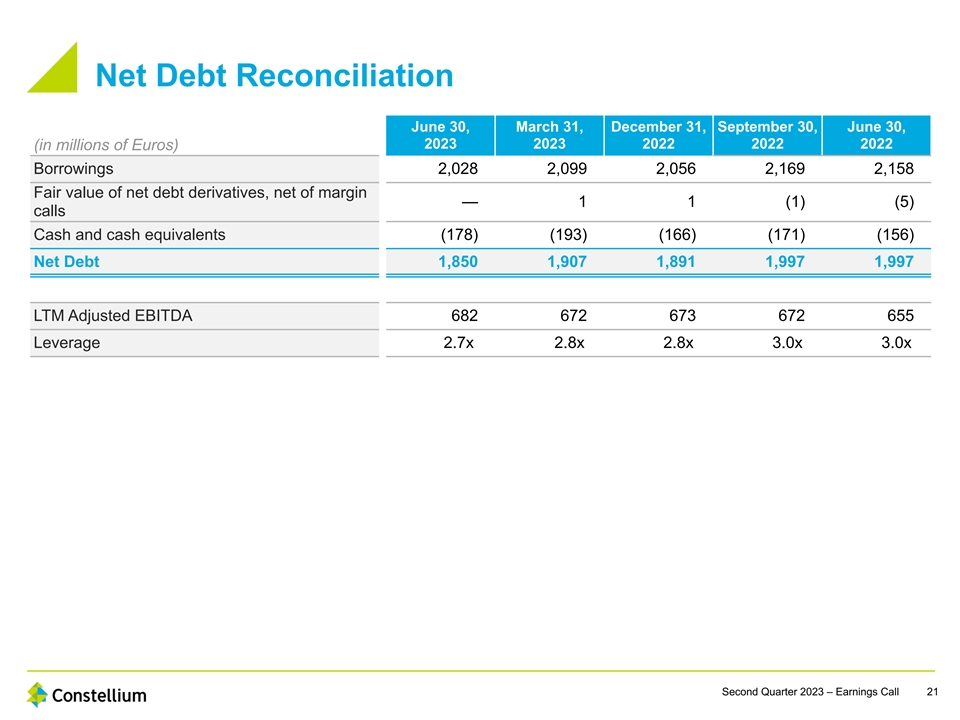
Net Debt Reconciliation June 30, March 31, December 31, September 30,
June 30, 2023 2023 2022 2022 2022 (in millions of Euros) Borrowings 2,028 2,099 2,056 2,169 2,158 Fair value of net debt derivatives, net of margin — 1 1 (1) (5) calls Cash and cash equivalents (178) (193) (166) (171) (156) Net Debt 1,850
1,907 1,891 1,997 1,997 LTM Adjusted EBITDA 682 672 673 672 655 Leverage 2.7x 2.8x 2.8x 3.0x 3.0x Second Quarter 2023 – Earnings Call 21

Reconciliation of Net Income to Adjusted EBITDA Twelve months ended
June 30, March 31, December 31, September 30, June 30, (in millions of Euros) 2023 2023 2022 2022 2022 Net income 215 151 308 285 253 Income tax (benefit) / expense (123) (139) (105) (100) 57 Income before tax 92 12 203 185 310 Finance costs - net
139 136 131 139 137 Income from operations 231 148 334 324 447 Depreciation and amortization 295 293 287 281 275 Restructuring costs 1 1 1 — — Unrealized (gains) / losses on derivatives (10) 111 46 97 93 Unrealized exchange losses /
(gains) from the — 1 1 2 1 remeasurement of monetary assets and liabilities - net (Gains) / losses on pension plan amendments (47) (47) (47) 30 30 Share based compensation costs 19 17 18 17 17 Metal price lag 184 139 29 (83) (212) Losses on
disposals 9 9 4 4 4 Adjusted EBITDA 682 672 673 672 655 Second Quarter 2023 – Earnings Call 22
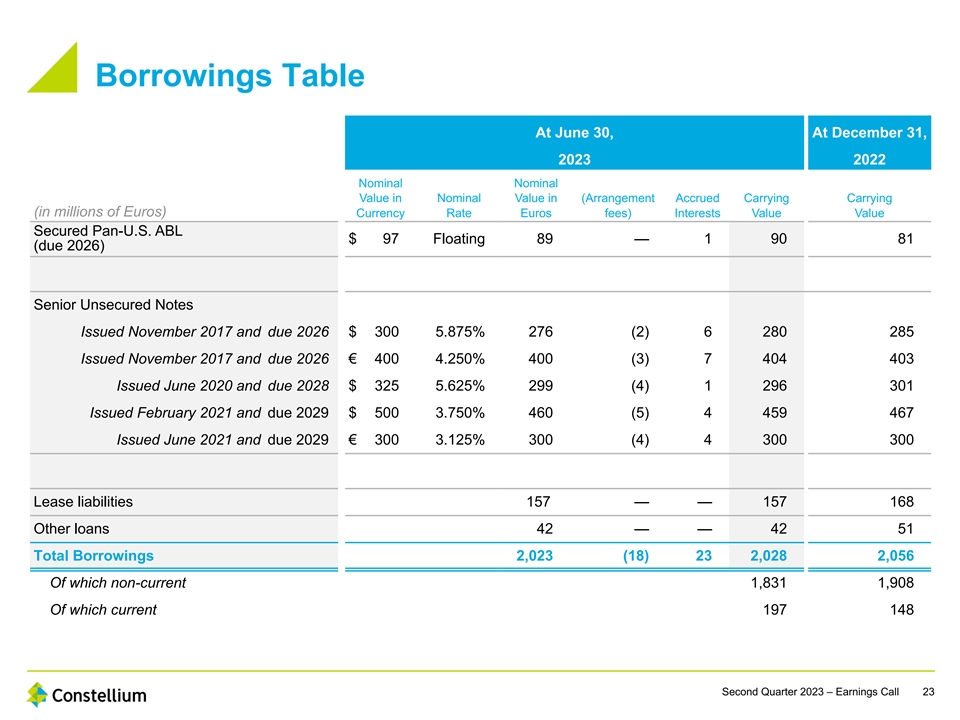
Borrowings Table At June 30, At December 31, 2023 2022 Nominal Nominal
Value in Nominal Value in (Arrangement Accrued Carrying Carrying (in millions of Euros) Currency Rate Euros fees) Interests Value Value Secured Pan-U.S. ABL $ 97 Floating 89 — 1 90 81 (due 2026) Senior Unsecured Notes Issued November 2017 and
due 2026 $ 300 5.875% 276 (2) 6 280 285 Issued November 2017 and due 2026 € 400 4.250% 400 (3) 7 404 403 Issued June 2020 and due 2028 $ 325 5.625% 299 (4) 1 296 301 Issued February 2021 and due 2029 $ 500 3.750% 460 (5) 4 459 467 Issued June
2021 and due 2029 € 300 3.125% 300 (4) 4 300 300 Lease liabilities 157 — — 157 168 Other loans 42 — — 42 51 Total Borrowings 2,023 (18) 23 2,028 2,056 Of which non-current 1,831 1,908 Of which current 197 148 Second
Quarter 2023 – Earnings Call 23
Constellium (NYSE:CSTM)
Historical Stock Chart
From May 2024 to Jun 2024

Constellium (NYSE:CSTM)
Historical Stock Chart
From Jun 2023 to Jun 2024
