false
0001883984
0001883984
2024-03-04
2024-03-04
iso4217:USD
xbrli:shares
iso4217:USD
xbrli:shares
UNITED STATES
SECURITIES AND EXCHANGE COMMISSION
WASHINGTON, D.C. 20549
FORM 8-K
CURRENT REPORT
PURSUANT TO SECTION 13 OR 15(d)
OF THE SECURITIES EXCHANGE ACT OF 1934
Date of Report (Date of earliest event reported):
March 4, 2024
ALTERNUS CLEAN ENERGY, INC.
(Exact name of registrant as specified in its charter)
| Delaware |
|
001-41306 |
|
87-1431377 |
(State or other jurisdiction
of Incorporation) |
|
(Commission File Number) |
|
(IRS Employer
Identification Number) |
|
360 Kingsley Park Drive, Suite 250
Fort Mill, South Carolina |
|
29715 |
| (Address of registrant’s principal executive office) |
|
(Zip code) |
(800) 581-1531
(Registrant’s telephone number, including
area code)
N/A
(Former name or former address, if changed since
last report)
Check the appropriate box below if the Form 8-K filing is intended
to simultaneously satisfy the filing obligation of the registrant under any of the following provisions (see General Instruction A.2.
below):
| ☐ |
Written communications pursuant to Rule 425 under the Securities Act (17 CFR 230.425) |
| |
|
| ☐ |
Soliciting material pursuant to Rule 14a-12 under the Exchange Act (17 CFR 240.14a-12) |
| |
|
| ☐ |
Pre-commencement communications pursuant to Rule 14d-2(b) under the Exchange Act (17 CFR 240.14d-2(b)) |
| |
|
| ☐ |
Pre-commencement communications pursuant to Rule 13e-4(c) under the Exchange Act (17 CFR 240.13e-4(c)) |
Securities registered pursuant to Section 12(b) of
the Act:
| Title of each class |
|
Trading symbol(s) |
|
Name of each exchange on which registered |
| Common Stock, par value $0.0001 per share |
|
ALCE |
|
The Nasdaq Stock Market LLC |
Indicate by check mark whether the registrant is an emerging growth
company as defined in Rule 405 of the Securities Act of 1933 (§230.405 of this chapter) or Rule 12b-2 of the Securities
Exchange Act of 1934 (§240.12b-2 of this chapter).
Emerging growth company ☒
If an emerging growth company, indicate by check mark if the registrant
has elected not to use the extended transition period for complying with any new or revised financial accounting standards provided pursuant
to Section 13(a) of the Exchange Act.
Item 7.01. Regulation FD Disclosure.
Alternus Clean Energy, Inc. (the “Company”)
presented certain information (the “Investor Presentation”) to investors on March 4, 2024. A graph color change was
made on slide 10 to the investor presentation attached as Exhibit 99.1 to the Company’s Current Report on Form 8-K filed on January
31, 2024 in order to correctly identify the way our European projects are funded. A copy of the amended Investor Presentation is attached
hereto as Exhibit 99.1 and incorporated herein by reference. The presentation will also be available on Alternus’ website at https://alternusce.com/investors-welcome/.
Forward Looking Statements
All statements contained in this Current Report
on Form 8-K other than statements of historical facts, including any information on the Company’s plans or future financial or operating
performance and other statements that express the Company’s management’s expectations or estimates of future performance,
constitute forward-looking statements. Forward-looking statements may be identified by the use of words such as “anticipate,”
“believe,” “continue,” “could,” “estimate,” “expect,” “intend,”
“may,” “might,” “plan,” “possible,” “potential,” “predict,” “project,”
“should,” “would” and similar expressions, as they relate to the Company or its management team. Such forward-looking
statements are based on the beliefs of management, as well as assumptions made by, and information currently available to, the Company’s
management. Such statements are based on a number of estimates and assumptions that are subject to significant business, economic and
competitive uncertainties, many of which are beyond the control of the Company. The Company cautions that such forward-looking statements
involve known and unknown risks and other factors that may cause the actual financial results, performance or achievements of the Company
to differ materially from the Company’s estimated future results, performance or achievements expressed or implied by the forward-looking
statements. These statements should not be relied upon as representing the Company’s assessments of any date after the date of this
Current Report on Form 8-K. The Company undertakes no obligation to update these statements for revisions or changes after the date of
this release, except as required by law.
Item 9.01. Financial Statements and Exhibits.
(d) Exhibits.
SIGNATURES
Pursuant to the requirements of the Securities Exchange Act of 1934,
the Registrant has duly caused this report to be signed on its behalf by the undersigned hereunto duly authorized.
| Date: March 5, 2024 |
ALTERNUS CLEAN ENERGY, INC. |
| |
|
|
| |
By: |
/s/ Vincent Browne |
| |
Name: |
Vincent Browne |
| |
Title: |
Chief Executive Officer and
Chairman of the Board of Directors |
2
Exhibit 99.1

SCALING A UTILITY - SCALE TRANSATLANTIC CLEAN ENERGY IPP January 2024
Disclaimer Safe Harbor Disclaimer for Forward - Looking Statements This presentation has been prepared by management of Alternus Clean Energy, Inc . (f/k/a/ Clean Earth Acquisition Corp . , and together with its subsidiaries, collectively “Alternus” or the “Company”) and does not constitute a prospectus, and should under no circumstances be understood as an offer to sell or the solicitation of an offer to buy securities, nor will there be any sale of securities in any state or jurisdiction in which such offer, solicitation or sale would be unlawful prior to registration or qualification under the securities laws of such state or jurisdiction . No offer of securities shall be made except by means of a prospectus meeting the requirements of Section 10 of the Securities Act of 1933 , as amended, or any applicable exemptions therefrom . Certain information contained herein has been derived from sources prepared by third parties . While such information is believed to be reliable for the purposes used herein, none of Alternus or its respective affiliates, directors, officers, employees, shareholders or agents makes any representation or warranty with respect to the accuracy of such information . Forward Looking Statements Certain statements in this Presentation may constitute “forward - looking statements” within the meaning of the Section 27 A of the Securities Act and Section 21 E of the Exchange Act that are based on beliefs and assumptions and on information currently available to Alternus . Certain statements included in this document that are not historical facts are forward - looking statements for purposes of the safe harbor provisions under the United States Private Securities Litigation Reform Act of 1995 . Some of the statements contained in this document, including information incorporated by reference, discuss future expectations, plans or prospects, or state other forward looking information words such as “intends”, “believes”, "expects," "anticipates,", "plans," "estimates," "should," "likely" or similar expressions reflecting something other than historical fact are intended to identify forward - looking statements but are not the exclusive means of identifying such statements . Forward - looking statements should not be read as a guarantee of future performance or results and will not necessarily be accurate indications of the times at, or by, which such performance or results will be achieved, if at all . Such statements include, but are not limited to, statements about the benefits to the value of Alternus's stock . Such forward looking statements are based upon the current beliefs and expectations of Alternus's management and are inherently subject to significant business, economic, and competitive uncertainties and contingencies, many of which are difficult to predict and generally beyond the control of Alternus . Actual results may differ materially from the results anticipated in these forward - looking statements . Factors, among others, that could cause actual results to differ materially from the anticipated results or other expectations expressed in the forward - looking statements include and are not limited to : the impact of reduction, modification or elimination of government subsidies and economic incentives (including, but not limited to, with respect to solar parks) ; the impact of decreases in spot market prices for electricity ; dependence on acquisitions for growth in Alternus’ business and inherent risks relating to acquisitions and Alternus’ ability to manage its growth and changing business ; risks relating to developing and managing renewable solar projects ; risks relating to PV plant quality and performance ; risks relating to planning permissions for solar parks and government regulation ; Alternus’ need for significant financial resources (including, but not limited to, for growth in its business) ; the need for financing in order to maintain future profitability ; lack of any assurance or guarantee that Alternus can raise capital or meet its funding needs ; Alternus’ limited operating history ; risks relating to operating internationally, including currency risks and legal, compliance and execution risks of operating internationally ; the outcome of any potential litigation, government and regulatory proceedings, investigations or inquiries ; a financial or liquidity crisis ; the risk of global and regional economic downturns ; the projected financial information, anticipated growth rate, and market opportunity of Alternus ; various environmental requirements ; retention or recruitment of executive and senior management and other key employees ; the ability of the Company to maintain an effective system of internal controls over financial reporting ; the ability of the Company to manage its growth effectively ; the ability of the Company to achieve and maintain profitability in the future ; the ability of the Company to access sources of capital to finance operations and growth ; the success of strategic relationships with third parties ; the effects of inflation, and changes in interest rates ; an economic slowdown, recession or contraction of the global economy ; a financial or liquidity crisis ; geopolitical factors, including, but not limited to, the Russian invasion of Ukraine, global supply chain concerns ; the status of debt and equity markets (including market volatility and uncertainty) ; general business and economic conditions ; the performance of financial markets and interest rates ; the ability to obtain government approvals ; and possible delays in government approvals . These factors are further stated, but are not limited to, as are (a) set forth in the sections entitled “Cautionary Note Regarding Forward - Looking Statements” and “Risk Factors” in the Company’s Form S - 1 filed on January 19 , 2024 , and under similar headings in subsequent filings with the SEC, and (b) associated with companies like the Company that operate in the energy industry . Nothing in this Presentation should be regarded as a representation that any forward - looking statement set forth herein, or the results of any forward - looking statement, will be achieved . You should not place undue reliance on forward - looking statements in this Presentation, which speak only as of the date they are made and are qualified in their entirety by reference to the cautionary statements herein . The Company does not undertake or accept any duty to release publicly any updates or revisions to any forward - looking statement herein to reflect any change in its expectations or in the events, conditions or circumstances on which any such statement is based . This Presentation does not purport to summarize all of the conditions, risks and other attributes of an investment in the Company . Interpretation of guidance of federal programs described herein is subject to further interpretation, guidance and change, and, as such, should only be interpreted with the assistance of a qualified professional . 2
Disclaimer (continued) 3 Financial Information ; Non - GAAP Financial Measures This Presentation includes certain financial measures not presented in accordance with generally accepted accounting principles (“GAAP”) including, but not limited to, EBITDA and EBITDA Margin . These non - GAAP financial measures are not measures of financial performance in accordance with GAAP and may exclude items that are significant in understanding and assessing Alternus’ financial results . Therefore, these measures should not be considered in isolation or as an alternative to net income, cash flows from operations or other measures of profitability, liquidity or performance under GAAP . You should be aware that the presentation of these measures may not be comparable to similarly - titled measures used by other companies . Alternus believe these non - GAAP measures provide useful information to management and investors regarding certain financial and business trends relating to Alternus’ financial condition and results of operations . Alternus believe that the use of these non - GAAP financial measures provides an additional tool for investors to use in evaluating ongoing operating results and trends in and in comparing Alternus’ financial results with other similar companies, many of which present similar non - GAAP financial measures to investors . These non - GAAP financial measures are subject to inherent limitations as they reflect the exercise of judgments by management about which expense and income are excluded or included in determining these non - GAAP financial measures . This Presentation also includes certain projections of non - GAAP financial measures . Due to the high variability and difficulty in making accurate forecasts and projections of some of the information excluded from these projected measures, together with some of the excluded information not being ascertainable or accessible, Alternus is unable to quantify certain amounts that would be required to be included in the most directly comparable GAAP financial measures without unreasonable effort . Consequently, no disclosure of estimated comparable GAAP measures is included, and no reconciliation of the forward - looking non - GAAP financial measures is included . Certain monetary amounts, percentages and other figures included in this Presentation have been subject to rounding adjustments . Certain other amounts that appear in this Presentation may not sum due to rounding . Use of Projections Independent auditors have audited, reviewed, compiled or performed any procedures with respect to the projections for the purpose of their inclusion in this Presentation, and accordingly, they did not express an opinion or provide any other form of assurance with respect thereto for the purpose of this Presentation . These projections should not be relied upon as being necessarily indicative of future results . The assumptions and estimates underlying the prospective financial information are inherently uncertain and are subject to a wide variety of significant business, economic and competitive risks and uncertainties that could cause actual results to differ materially from those contained in the prospective financial information . Accordingly, there can be no assurance that the prospective results are indicative of the future performance of Alternus or that actual results will not differ materially from those presented in the prospective financial information . Inclusion of the prospective financial information in this Presentation should not be regarded as a representation by any person that the results contained in the prospective financial information will be achieved . Industry and Market Data This Presentation includes certain information and statistics obtained from third - party sources . Alternus has not independently verified the accuracy or completeness of any such third - party information . Management estimates are derived from publicly available information released by independent industry analysts and other third - party sources, as well as data from the Company's internal research, and are based on assumptions made by the Company upon reviewing such data, and the Company's experience in, and knowledge of, such industry and markets, which the Company believes to be reasonable . In addition, projections, assumptions and estimates of the future performance of the industry in which the Company operates, and the Company's future performance are necessarily subject to uncertainty and risk due to a variety of factors, including those described above . These and other factors could cause results to differ materially from those expressed in the estimates made by independent parties and by the Company . Industry publications, research, surveys and studies generally state that the information they contain has been obtained from sources believed to be reliable, but that the accuracy and completeness of such information is not guaranteed . Forecasts and other forward - looking information obtained from these sources are subject to the same qualifications and uncertainties as the other forward - looking statements in this presentation . Trademarks This Presentation contains trademarks, trade names and copyrights of Alternus, and other companies, which are the property of their respective owners . Additional Information about the Company and Where to Find It You are encouraged to read the Company’s reports and other documents filed with the SEC . Such reports and other documents may be obtained free of charge at the SEC’s website at www . sec . gov .
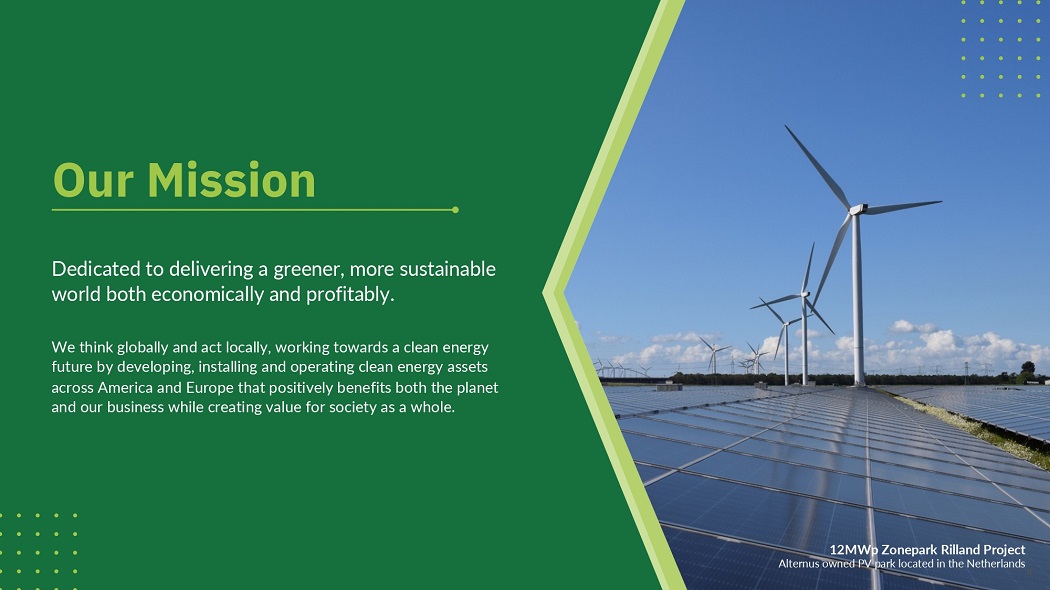
Our Mission Dedicated to delivering a greener, more sustainable world both economically and profitably. We think globally and act locally, working towards a clean energy future by developing, installing and operating clean energy assets across America and Europe that positively benefits both the planet and our business while creating value for society as a whole. 12MWp Zonepark Rilland Project Alternus owned PV park located in the Netherlands 4
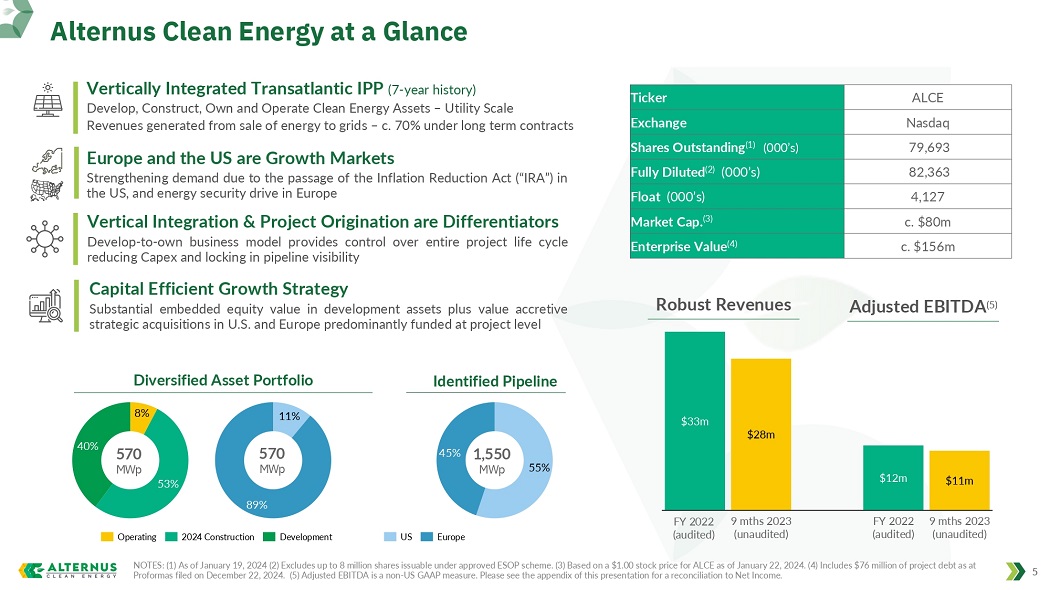
8% 53% 40% Alternus Clean Energy at a Glance NOTES: (1) As of January 19, 2024 (2) Excludes up to 8 million shares issuable under approved ESOP scheme. (3) Based on a $1. 00 stock price for ALCE as of January 22, 2024. (4) Includes $76 million of project debt as at Proformas filed on December 22, 2024. (5) Adjusted EBITDA is a non - US GAAP measure. Please see the appendix of this presentatio n for a reconciliation to Net Income. 5 Vertically Integrated Transatlantic IPP ( 7 - year history) Develop, Construct, Own and Operate Clean Energy Assets – Utility Scale Revenues generated from sale of energy to grids – c. 70% under long term contracts Europe and the US are Growth Markets Strengthening demand due to the passage of the Inflation Reduction Act (“IRA”) in the US, and energy security drive in Europe Vertical Integration & Project Origination are Differentiators Develop - to - own business model provides control over entire project life cycle reducing Capex and locking in pipeline visibility Capital Efficient Growth Strategy Substantial embedded equity value in development assets plus value accretive strategic acquisitions in U . S . and Europe predominantly funded at project level 570 MWp Robust Revenues ALCE Ticker Nasdaq Exchange 79,693 Shares Outstanding (1) (000’s) 82,363 Fully Diluted (2) (000’s) 4,127 Float (000’s) c. $80m Market Cap. (3) c. $156m Enterprise Value (4) Operating 2024 Construction Development $33m $28m $12m $11m 9 mths 2023 (unaudited) FY 2022 (audited) 9 mths 2023 (unaudited) Adjusted EBITDA (5) Diversified Asset Portfolio 11% 89% US Europe Identified Pipeline 55% 45% 1,550 MWp 570 MWp FY 2022 (audited)

Diversified Market Presence 6 Current Operational portfolio of 44MWp across Romania in Europe and Tennessee in the US. Total Identified Project Pipeline of 1.5 GWp split into Organic Development and Strategic Acquisition projects across America and Europe. Currently over 500 MWp of Organic Development projects in pre - construction and late - stage development.
ALTERNUS BUSINESS OVERVIEW
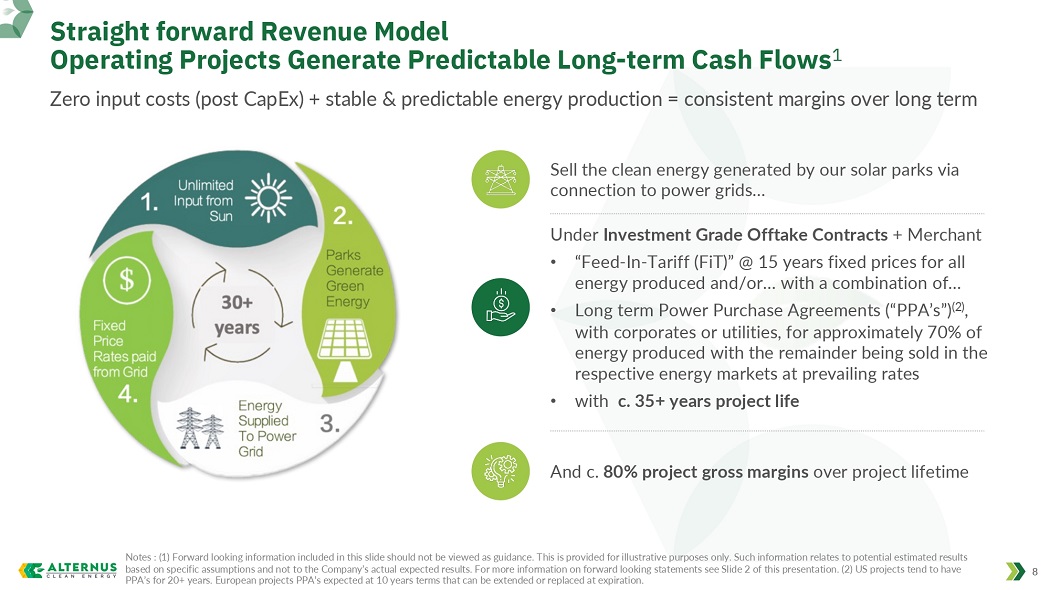
Straight forward Revenue Model Operating Projects Generate Predictable Long - term Cash Flows 1 Zero input costs (post CapEx ) + stable & predictable energy production = consistent margins over long term Notes : (1) Forward looking information included in this slide should not be viewed as guidance. This is provided for illustr ati ve purposes only. Such information relates to potential estimated results based on specific assumptions and not to the Company’s actual expected results. For more information on forward looking state men ts see Slide 2 of this presentation. (2) US projects tend to have PPA’s for 20+ years. European projects PPA’s expected at 10 years terms that can be extended or replaced at expiration. 8 Under Investment Grade Offtake Contracts + Merchant • “Feed - In - Tariff ( FiT )” @ 15 years fixed prices for all energy produced and/or… with a combination of… • Long term Power Purchase Agreements (“PPA’s”) (2) , with corporates or utilities, for approximately 70% of energy produced with the remainder being sold in the respective energy markets at prevailing rates • with c. 35+ years project life And c. 80% project gross margins over project lifetime Sell the clean energy generated by our solar parks via connection to power grids…
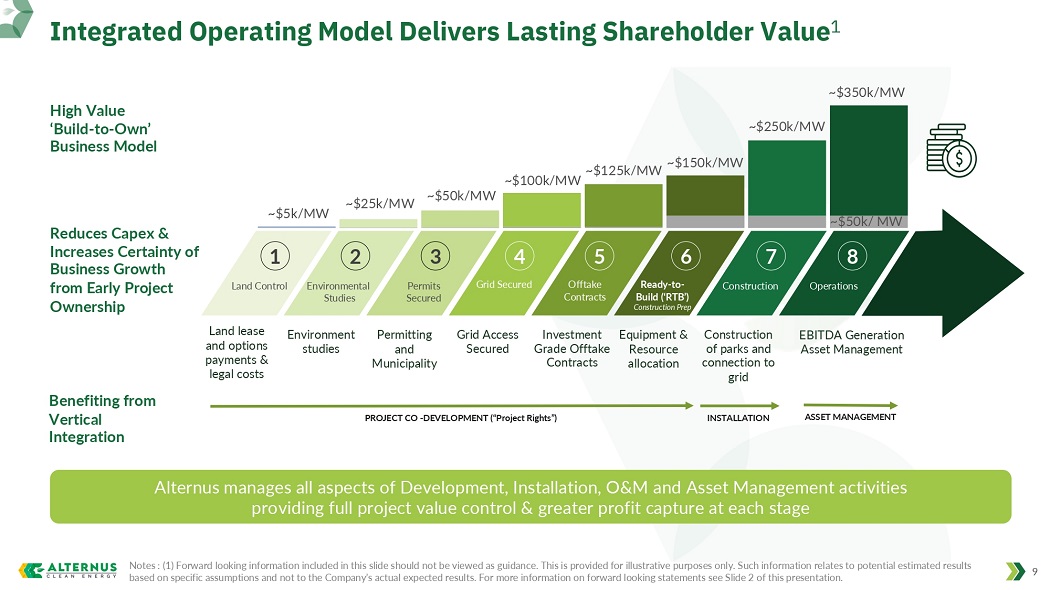
Integrated Operating Model Delivers Lasting Shareholder Value 1 Notes : (1) Forward looking information included in this slide should not be viewed as guidance. This is provided for illustr ati ve purposes only. Such information relates to potential estimated results based on specific assumptions and not to the Company’s actual expected results. For more information on forward looking state men ts see Slide 2 of this presentation. 9 High Value ‘Build - to - Own’ Business Model Reduces Capex & Increases Certainty of Business Growth from Early Project Ownership Benefiting from Vertical Integration Alternus manages all aspects of Development, Installation, O&M and Asset Management activities providing full project value control & greater profit capture at each stage PROJECT CO - DEVELOPMENT (“Project Rights”) INSTALLATION ~ $25k/MW ~ $50k/MW ~ $100k/MW ~ $5k/MW ~ $150k/MW ~ $250k/MW ~ $350k/MW ~ $125k/MW Land Control Environmental Studies Permits Secured Grid Secured Offtake Contracts Ready - to - Build (‘RTB’) Construction Prep Construction Land lease and options payments & legal costs Environment studies Permitting and Municipality Grid Access Secured Investment Grade Offtake Contracts Equipment & Resource allocation ASSET MANAGEMENT Construction of parks and connection to grid Operations EBITDA Generation Asset Management 4 5 6 7 3 2 1 8 ~$50k/ MW
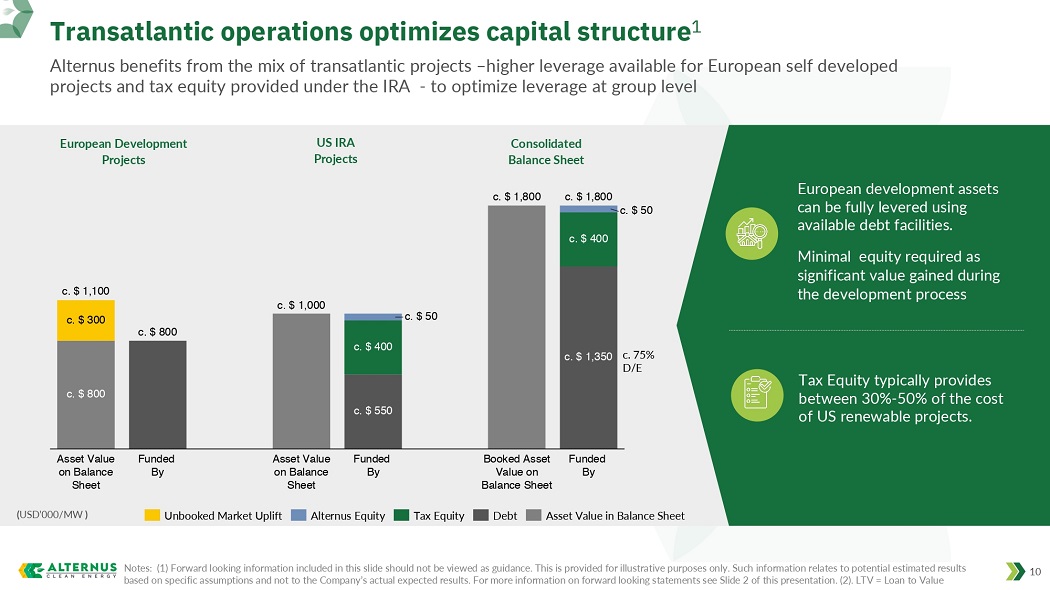
Transatlantic operations optimizes capital structure 1 10 c. $ 800 c. $ 800 c. $ 1,000 c. $ 550 c. $ 1,800 c. $ 1,350 c. $ 300 c. $ 400 c. $ 400 c. $ 50 c. $ 50 Asset Value on Balance Sheet Funded By Asset Value on Balance Sheet Funded By Funded By c. $ 1,100 c. $ 1,800 Booked Asset Value on Balance Sheet Tax Equity Debt Alternus Equity Asset Value in Balance Sheet Unbooked Market Uplift European Development Projects US IRA Projects Consolidated Balance Sheet Tax Equity typically provides between 30% - 50% of the cost of US renewable projects. European development assets can be fully levered using available debt facilities. Minimal equity required as significant value gained during the development process ( USD’000/MW ) Alternus benefits from the mix of transatlantic projects – higher leverage available for European self developed projects and tax equity provided under the IRA - to optimize leverage at group level c. 75% D/E Notes: (1) Forward looking information included in this slide should not be viewed as guidance. This is provided for illustr ati ve purposes only. Such information relates to potential estimated results based on specific assumptions and not to the Company’s actual expected results. For more information on forward looking state men ts see Slide 2 of this presentation. (2). LTV = Loan to Value
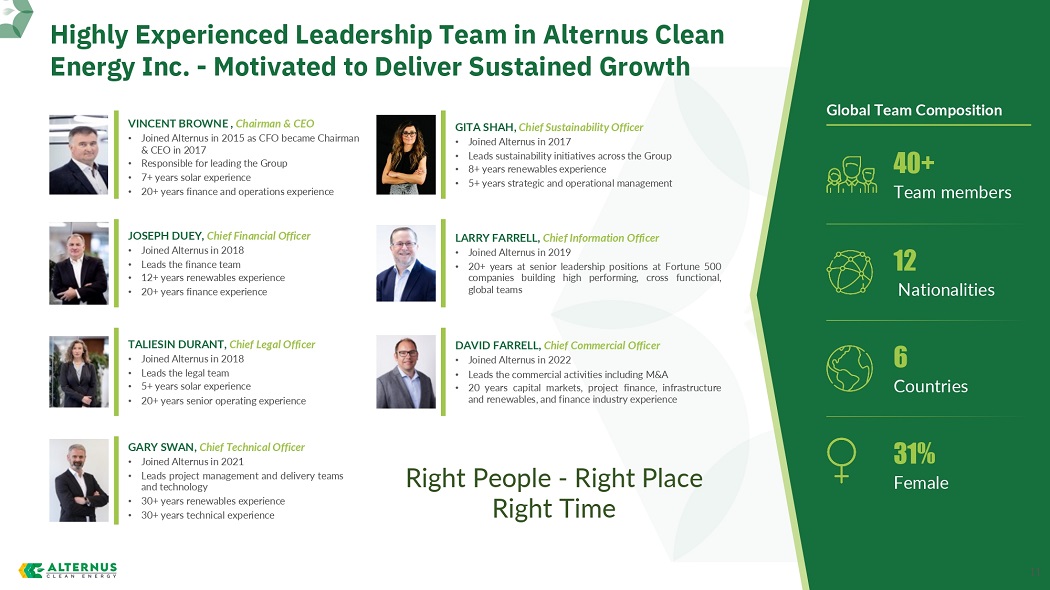
Highly Experienced Leadership Team in Alternus Clean Energy Inc. - Motivated to Deliver Sustained Growth 11 GITA SHAH, Chief Sustainability Officer • Joined Alternus in 2017 • Leads sustainability initiatives across the Group • 8 + years renewables experience • 5 + years strategic and operational management VINCENT BROWNE , Chairman & CEO • Joined Alternus in 2015 as CFO became Chairman & CEO in 2017 • Responsible for leading the Group • 7 + years solar experience • 20 + years finance and operations experience JOSEPH DUEY, Chief Financial Officer • Joined Alternus in 2018 • Leads the finance team • 12 + years renewables experience • 20 + years finance experience LARRY FARRELL, Chief Information Officer • Joined Alternus in 2019 • 20 + years at senior leadership positions at Fortune 500 companies building high performing, cross functional, global teams TALIESIN DURANT, Chief Legal Officer • Joined Alternus in 2018 • Leads the legal team • 5 + years solar experience • 20 + years senior operating experience DAVID FARRELL, Chief Commercial Officer • Joined Alternus in 2022 • Leads the commercial activities including M&A • 20 years capital markets, project finance, infrastructure and renewables, and finance industry experience GARY SWAN, Chief Technical Officer • Joined Alternus in 2021 • Leads project management and delivery teams and technology • 30 + years renewables experience • 30 + years technical experience 40+ Team members 12 Nationalities 6 Countries 31% Female Global Team Composition Right People - Right Place Right Time
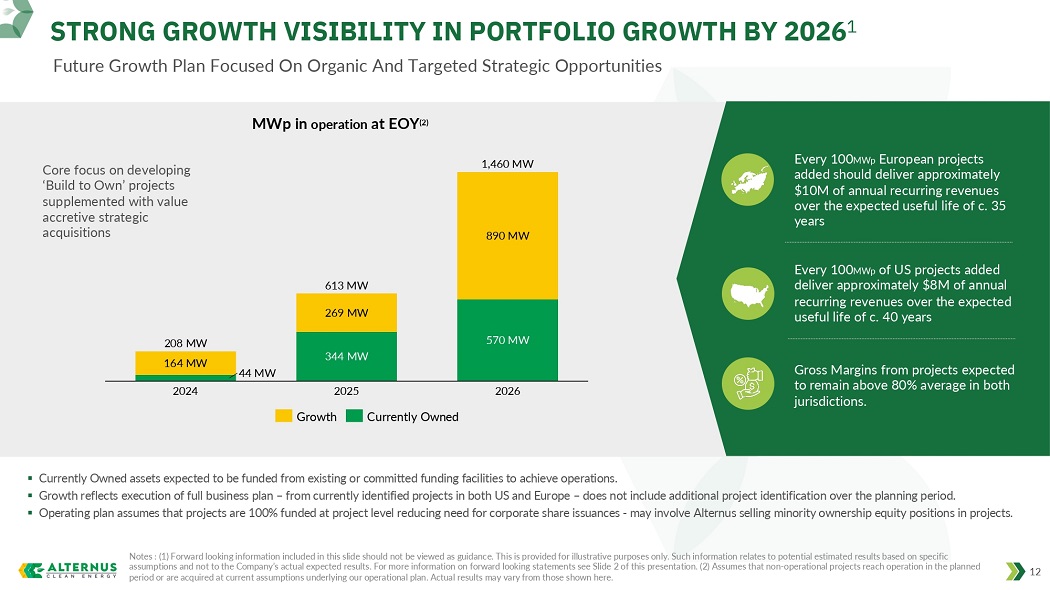
STRONG GROWTH VISIBILITY IN PORTFOLIO GROWTH BY 2026 1 Future Growth Plan Focused On Organic And Targeted Strategic Opportunities 12 44 MW 344 MW 570 MW 164 MW 269 MW 890 MW 2025 2026 2024 613 MW 1,460 MW 208 MW Growth Currently Owned MWp in operation at EOY (2) ▪ Currently Owned assets expected to be funded from existing or committed funding facilities to achieve operations . ▪ Growth reflects execution of full business plan – from currently identified projects in both US and Europe – does not include additional project identification over the planning period . ▪ Operating plan assumes that projects are 100 % funded at project level reducing need for corporate share issuances - may involve Alternus selling minority ownership equity positions in projects . Notes : (1) Forward looking information included in this slide should not be viewed as guidance. This is provided for illustr ati ve purposes only. Such information relates to potential estimated results based on specific assumptions and not to the Company’s actual expected results. For more information on forward looking statements see Slide 2 of this presentation. (2) Assumes that non - operational projects reach operation in the planned period or are acquired at current assumptions underlying our operational plan. Actual results may vary from those shown here. Core focus on developing ‘Build to Own’ projects supplemented with value accretive strategic acquisitions Every 100 MWp European projects added should deliver approximately $10M of annual recurring revenues over the expected useful life of c. 35 years Every 100 MWp of US projects added deliver approximately $8M of annual recurring revenues over the expected useful life of c. 40 years Gross Margins from projects expected to remain above 80% average in both jurisdictions.
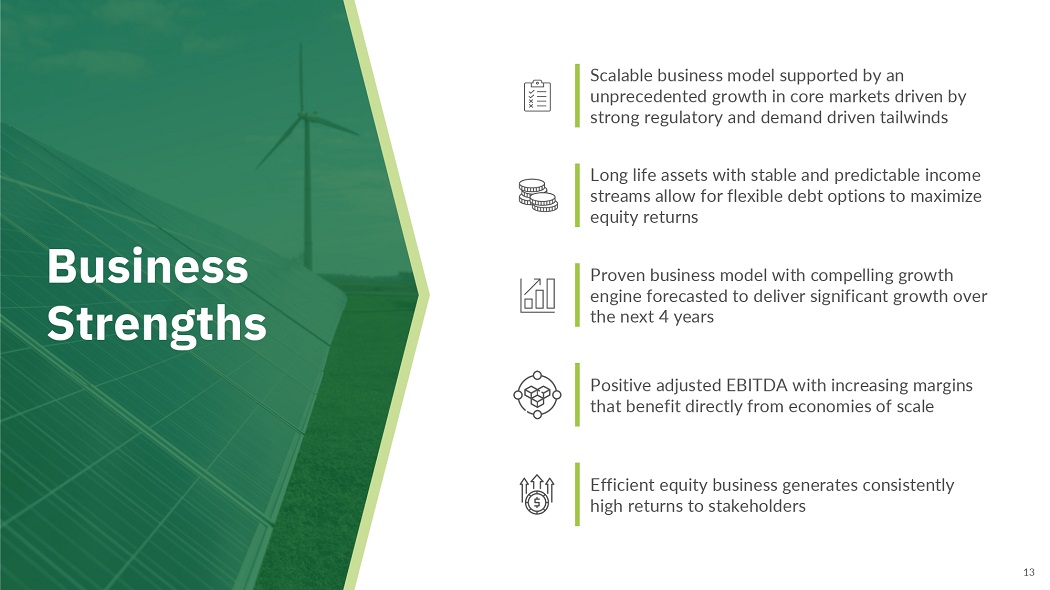
Scalable business model supported by an unprecedented growth in core markets driven by strong regulatory and demand driven tailwinds Long life assets with stable and predictable income streams allow for flexible debt options to maximize equity returns Proven business model with compelling growth engine forecasted to deliver significant growth over the next 4 years Efficient equity business generates consistently high returns to stakeholders Positive adjusted EBITDA with increasing margins that benefit directly from economies of scale 13 Business Strengths

MARKET OVERVIEW
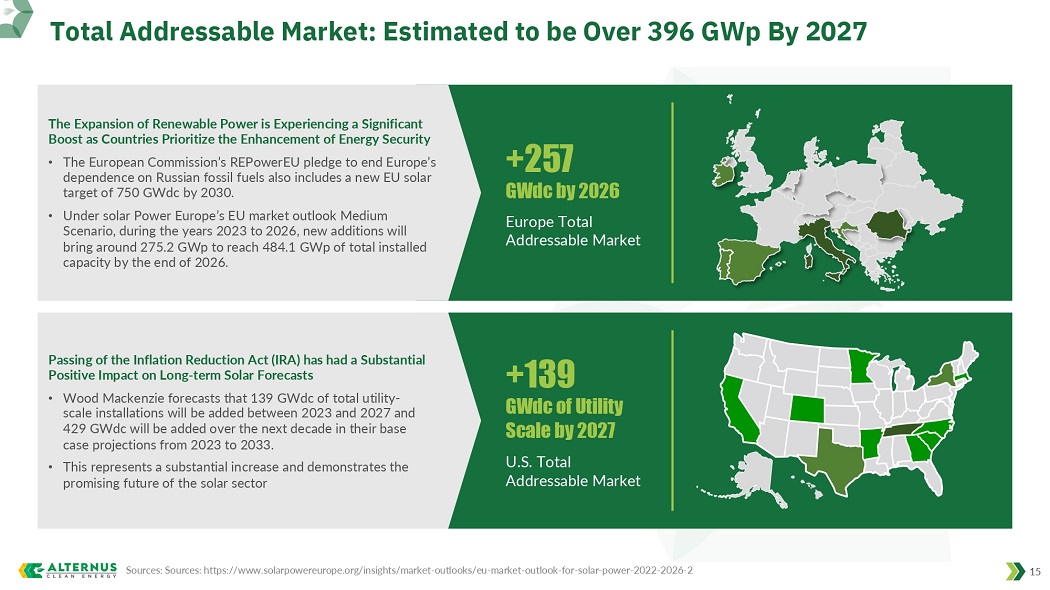
Total Addressable Market: Estimated to be Over 396 GWp By 2027 Sources: Sources: https://www.solarpowereurope.org/insights/market - outlooks/eu - market - outlook - for - solar - power - 2022 - 2026 - 2 15 The Expansion of Renewable Power is Experiencing a Significant Boost as Countries Prioritize the Enhancement of Energy Security • The European Commission’s REPowerEU pledge to end Europe’s dependence on Russian fossil fuels also includes a new EU solar target of 750 GWdc by 2030. • Under solar Power Europe’s EU market outlook Medium Scenario, during the years 2023 to 2026, new additions will bring around 275.2 GWp to reach 484.1 GWp of total installed capacity by the end of 2026. Passing of the Inflation Reduction Act (IRA) has had a Substantial Positive Impact on Long - term Solar Forecasts • Wood Mackenzie forecasts that 139 GWdc of total utility - scale installations will be added between 2023 and 2027 and 429 GWdc will be added over the next decade in their base case projections from 2023 to 2033. • This represents a substantial increase and demonstrates the promising future of the solar sector +257 GWdc by 2026 Europe Total Addressable Market +139 GWdc of Utility Scale by 2027 U.S. Total Addressable Market
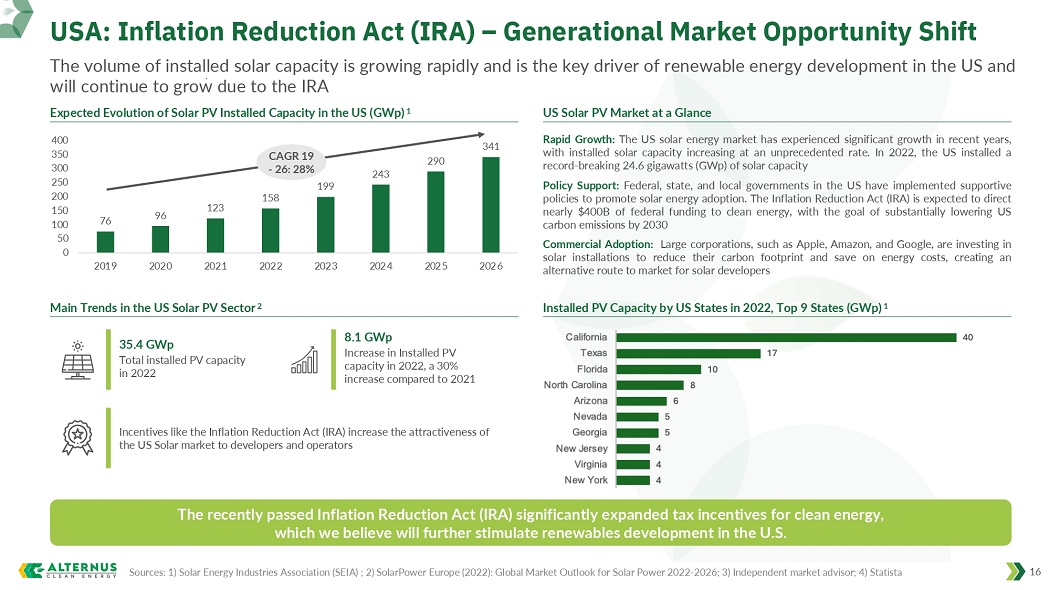
The recently passed Inflation Reduction Act (IRA) significantly expanded tax incentives for clean energy, which we believe will further stimulate renewables development in the U.S. USA: Inflation Reduction Act (IRA) – Generational Market Opportunity Shift The volume of installed solar capacity is growing rapidly and is the key driver of renewable energy development in the US and will continue to grow due to the IRA 16 Expected Evolution of Solar PV Installed Capacity in the US ( GWp ) 1 US Solar PV Market at a Glance 35.4 GWp Total installed PV capacity in 2022 8.1 GWp Increase in Installed PV capacity in 2022, a 30% increase compared to 2021 Incentives like the Inflation Reduction Act (IRA) increase the attractiveness of the US Solar market to developers and operators Sources: 1) Solar Energy Industries Association (SEIA) ; 2) SolarPower Europe (2022): Global Market Outlook for Solar Power 2022 - 2026; 3) Independent market advisor; 4) Statista Rapid Growth : The US solar energy market has experienced significant growth in recent years, with installed solar capacity increasing at an unprecedented rate . In 2022 , the US installed a record - breaking 24 . 6 gigawatts ( GWp ) of solar capacity Policy Support : Federal, state, and local governments in the US have implemented supportive policies to promote solar energy adoption . The Inflation Reduction Act (IRA) is expected to direct nearly $ 400 B of federal funding to clean energy, with the goal of substantially lowering US carbon emissions by 2030 Commercial Adoption : Large corporations, such as Apple, Amazon, and Google, are investing in solar installations to reduce their carbon footprint and save on energy costs, creating an alternative route to market for solar developers 76 96 123 158 199 243 290 341 0 50 100 150 200 250 300 350 400 2019 2020 2021 2022 2023 2024 2025 2026 Main Trends in the US Solar PV Sector 2 Installed PV Capacity by US States in 2022 , Top 9 States ( GWp ) 1 CAGR 19 - 26: 28%
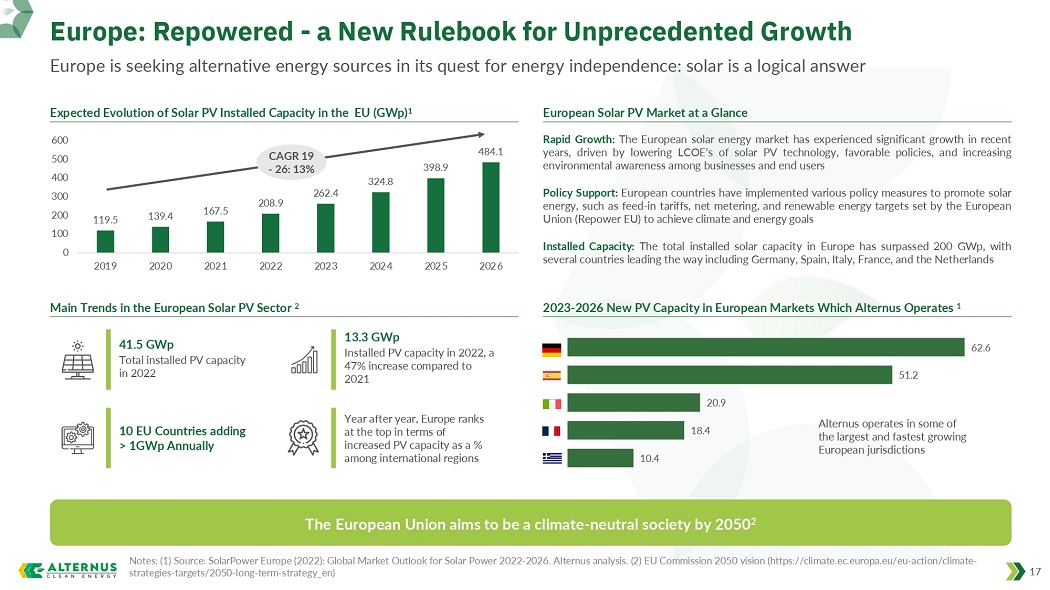
Europe: Repowered - a New Rulebook for Unprecedented Growth Europe is seeking alternative energy sources in its quest for energy independence: solar is a logical answer 17 Rapid Growth : The European solar energy market has experienced significant growth in recent years, driven by lowering LCOE’s of solar PV technology, favorable policies, and increasing environmental awareness among businesses and end users Policy Support : European countries have implemented various policy measures to promote solar energy, such as feed - in tariffs, net metering, and renewable energy targets set by the European Union (Repower EU) to achieve climate and energy goals Installed Capacity : The total installed solar capacity in Europe has surpassed 200 GWp, with several countries leading the way including Germany, Spain, Italy, France, and the Netherlands Expected Evolution of Solar PV Installed Capacity in the EU ( GWp ) 1 European Solar PV Market at a Glance Main Trends in the European Solar PV Sector 2 2023 - 2026 New PV Capacity in European Markets Which Alternus Operates 1 41.5 GWp Total installed PV capacity in 2022 10 EU Countries adding > 1GWp Annually 13.3 GWp Installed PV capacity in 2022, a 47% increase compared to 2021 Year after year, Europe ranks at the top in terms of increased PV capacity as a % among international regions 10.4 18.4 20.9 51.2 62.6 Alternus operates in some of the largest and fastest growing European jurisdictions CAGR 19 - 26: 13% 119.5 139.4 167.5 208.9 262.4 324.8 398.9 484.1 0 100 200 300 400 500 600 2019 2020 2021 2022 2023 2024 2025 2026 The European Union aims to be a climate - neutral society by 2050 2 Notes: (1) Source: SolarPower Europe (2022): Global Market Outlook for Solar Power 2022 - 2026. Alternus analysis. (2) EU Commission 2050 vision (https://clima te.ec.europa.eu/eu - action/climate - strategies - targets/2050 - long - term - strategy_en)

FINANCIALS
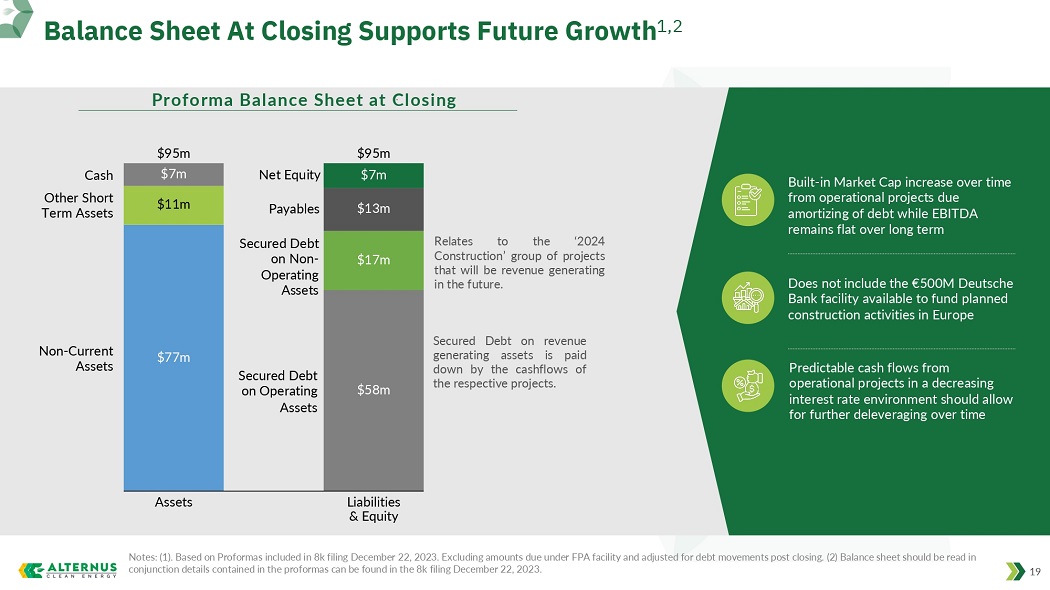
Notes: (1). Based on Proformas included in 8k filing December 22, 2023. Excluding amounts due under FPA facility and adjusted fo r debt movements post closing. (2) Balance sheet should be read in conjunction details contained in the proformas can be found in the 8k filing December 22, 2023. 19 Proforma Balance Sheet at Closing $7m $11m $77m Assets $7m $13m $17m $58m Liabilities & Equity Cash Other Short Term Assets Non - Current Assets $95m $95m Secured Debt on Operating Assets Payables Net Equity Secured Debt on revenue generating assets is paid down by the cashflows of the respective projects . Secured Debt on Non - Operating Assets Relates to the ‘ 2024 Construction’ group of projects that will be revenue generating in the future . Balance Sheet At Closing Supports Future Growth 1,2 Built - in Market Cap increase over time from operational projects due amortizing of debt while EBITDA remains flat over long term Does not include the €500M Deutsche Bank facility available to fund planned construction activities in Europe Predictable cash flows from operational projects in a decreasing interest rate environment should allow for further deleveraging over time
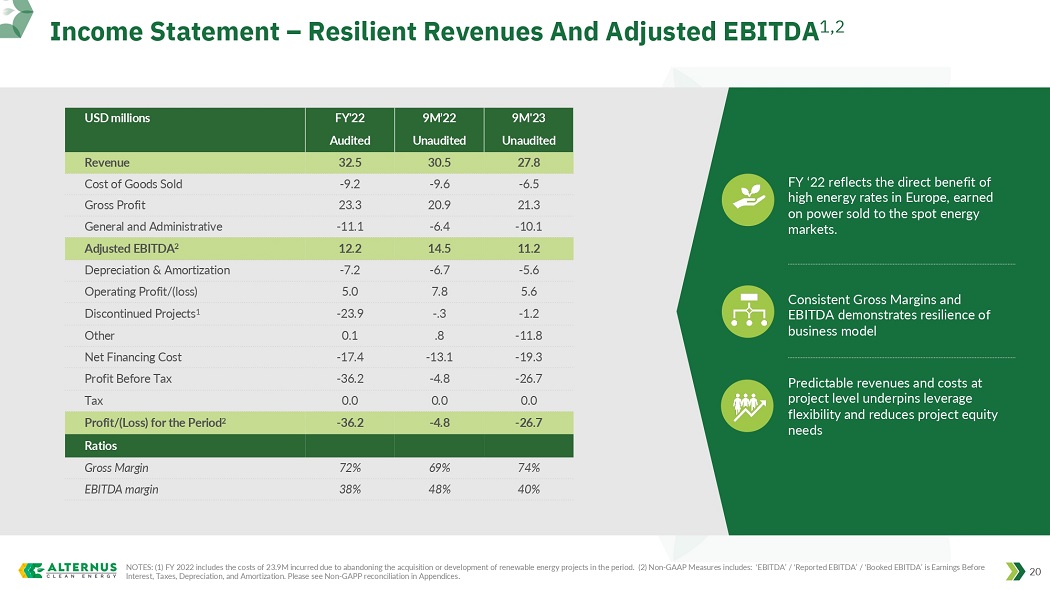
Income Statement – Resilient Revenues And Adjusted EBITDA 1,2 20 9M'23 9M’22 FY'22 USD millions Unaudited Unaudited Audited 27.8 30.5 32.5 Revenue - 6.5 - 9.6 - 9.2 Cost of Goods Sold 21.3 20.9 23.3 Gross Profit - 10.1 - 6.4 - 11.1 General and Administrative 11.2 14.5 12.2 Adjusted EBITDA 2 - 5.6 - 6.7 - 7.2 Depreciation & Amortization 5.6 7.8 5.0 Operating Profit/(loss) - 1.2 - .3 - 23.9 Discontinued Projects 1 - 11.8 .8 0.1 Other - 19.3 - 13.1 - 17.4 Net Financing Cost - 26.7 - 4.8 - 36.2 Profit Before Tax 0.0 0.0 0.0 Tax - 26.7 - 4.8 - 36.2 Profit/(Loss) for the Period 2 Ratios 74% 69% 72% Gross Margin 40% 48% 38% EBITDA margin NOTES: (1) FY 2022 includes the costs of 23.9M incurred due to abandoning the acquisition or development of renewable energy pro jects in the period. (2) Non - GAAP Measures includes: ‘EBITDA’ / ‘Reported EBITDA’ / ‘Booked EBITDA’ is Earnings Before Interest, Taxes, Depreciation, and Amortization. Please see Non - GAPP reconciliation in Appendices. FY ‘22 reflects the direct benefit of high energy rates in Europe, earned on power sold to the spot energy markets. Consistent Gross Margins and EBITDA demonstrates resilience of business model Predictable revenues and costs at project level underpins leverage flexibility and reduces project equity needs
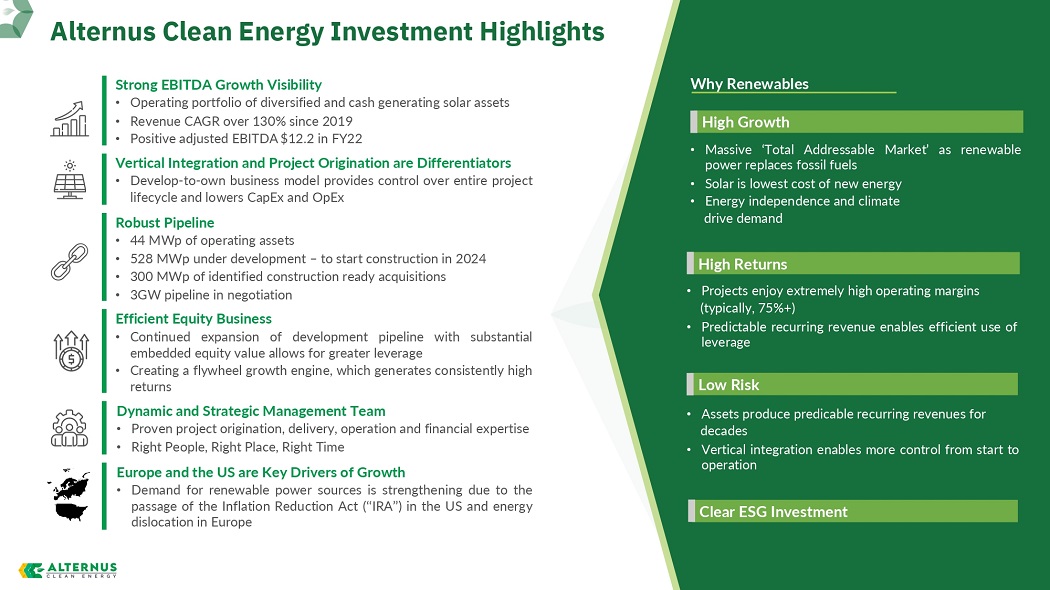
Alternus Clean Energy Investment Highlights 21 Strong EBITDA Growth Visibility • Operating portfolio of diversified and cash generating solar assets • Revenue CAGR over 130 % since 2019 • Positive adjusted EBITDA $ 12 . 2 in FY 22 Robust Pipeline • 44 MWp of operating assets • 528 MWp under development – to start construction in 2024 • 300 MWp of identified construction ready acquisitions • 3 GW pipeline in negotiation Vertical Integration and Project Origination are Differentiators • Develop - to - own business model provides control over entire project lifecycle and lowers CapEx and OpEx Efficient Equity Business • Continued expansion of development pipeline with substantial embedded equity value allows for greater leverage • Creating a flywheel growth engine, which generates consistently high returns Dynamic and Strategic Management Team • Proven project origination, delivery, operation and financial expertise • Right People, Right Place, Right Time Europe and the US are Key Drivers of Growth • Demand for renewable power sources is strengthening due to the passage of the Inflation Reduction Act (‘‘IRA’’) in the US and energy dislocation in Europe 21 Why Renewables High Growth High Returns Low Risk • Massive ‘Total Addressable Market’ as renewable power replaces fossil fuels • Solar is lowest cost of new energy • Energy independence and climate drive demand • Projects enjoy extremely high operating margins (typically, 75 % +) • Predictable recurring revenue enables efficient use of leverage • Assets produce predicable recurring revenues for decades • Vertical integration enables more control from start to operation Clear ESG Investment

APPENDIX
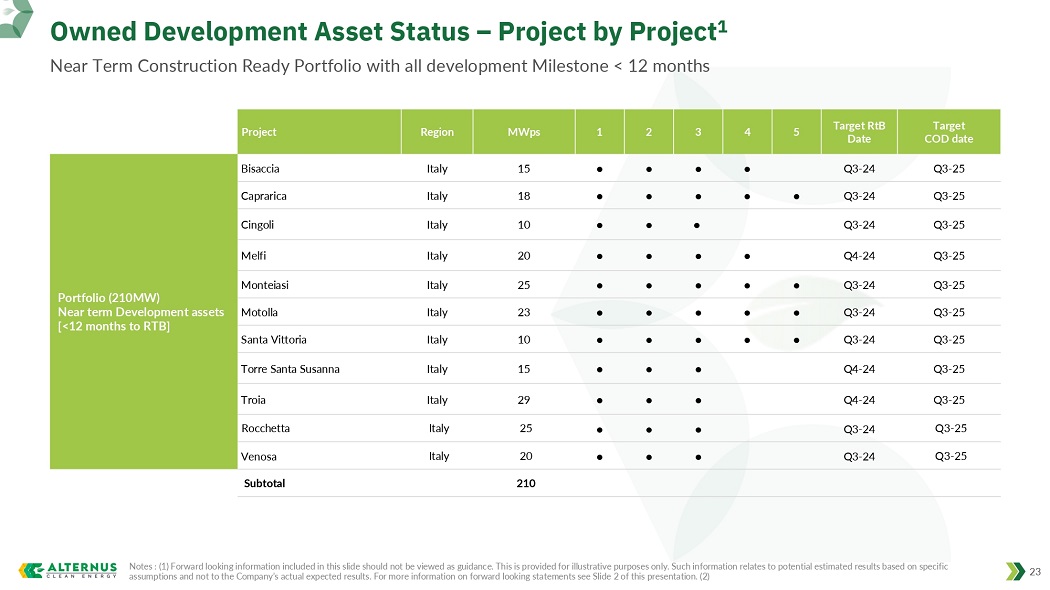
Owned Development Asset Status – Project by Project 1 Near Term Construction Ready Portfolio with all development Milestone < 12 months Notes : (1) Forward looking information included in this slide should not be viewed as guidance. This is provided for illustr ati ve purposes only. Such information relates to potential estimated results based on specific assumptions and not to the Company’s actual expected results. For more information on forward looking statements see Slide 2 of this presentation. (2) 23 Target COD date Target RtB Date 5 4 3 2 1 MWps Region Project Q3 - 25 Q3 - 24 ● ● ● ● 15 Italy Bisaccia Portfolio (210MW) Near term Development assets [<12 months to RTB] Q3 - 25 Q3 - 24 ● ● ● ● ● 18 Italy Caprarica Q3 - 25 Q3 - 24 ● ● ● 10 Italy Cingoli Q3 - 25 Q4 - 24 ● ● ● ● 20 Italy Melfi Q3 - 25 Q3 - 24 ● ● ● ● ● 25 Italy Monteiasi Q3 - 25 Q3 - 24 ● ● ● ● ● 23 Italy Motolla Q3 - 25 Q3 - 24 ● ● ● ● ● 10 Italy Santa Vittoria Q3 - 25 Q4 - 24 ● ● ● 15 Italy Torre Santa Susanna Q3 - 25 Q4 - 24 ● ● ● 29 Italy Troia Q3 - 25 Q3 - 24 ● ● ● 25 Italy Rocchetta Q3 - 25 Q3 - 24 ● ● ● 20 Italy Venosa 210 Subtotal
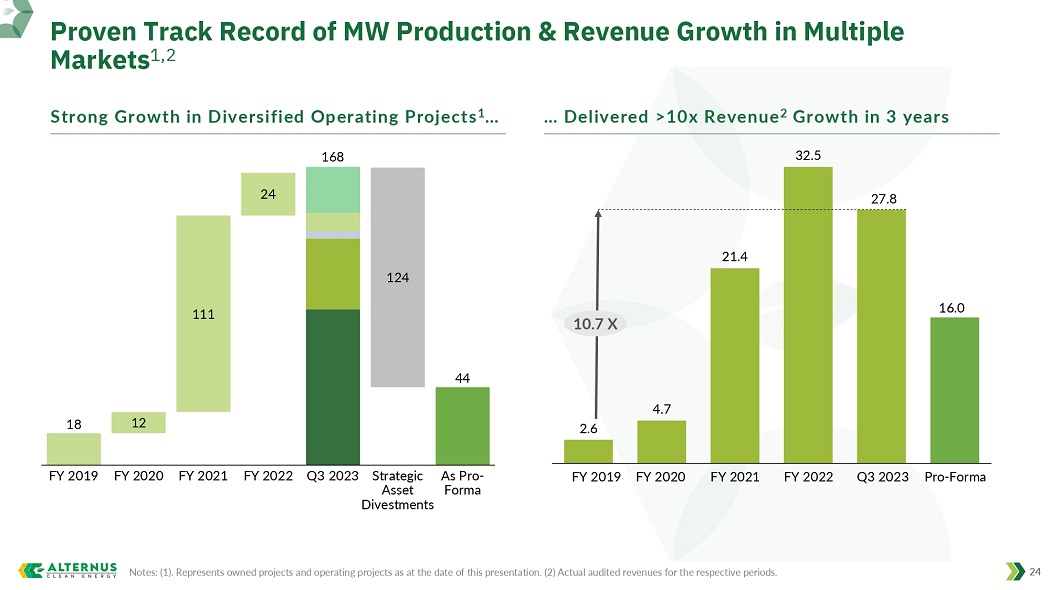
Proven Track Record of MW Production & Revenue Growth in Multiple Markets 1,2 Notes: (1). Represents owned projects and operating projects as at the date of this presentation. (2) Actual audited revenues fo r the respective periods. 24 Strong Growth in Diversified Operating Projects 1 … … Delivered >10x Revenue 2 Growth in 3 years 18 44 12 111 24 124 FY 2020 FY 2021 FY 2022 FY 2019 Strategic Asset Divestments As Pro - Forma 168 Q3 2023 2.6 4.7 21.4 32.5 FY 2022 FY 2019 FY 2021 FY 2020 10.7 X Q3 2023 27.8 16.0 Pro - Forma
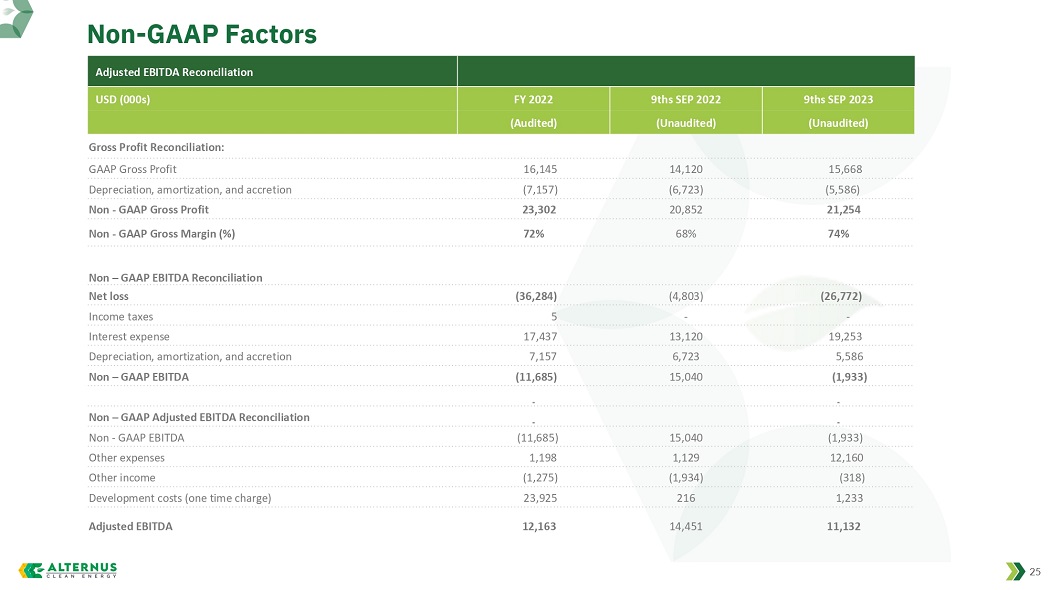
Non - GAAP Factors 25 Adjusted EBITDA Reconciliation 9ths SEP 2023 9ths SEP 2022 FY 2022 USD (000s) (Unaudited) (Unaudited) (Audited) Gross Profit Reconciliation: 15,668 14,120 16,145 GAAP Gross Profit (5,586) (6,723) (7,157) Depreciation, amortization, and accretion 21,254 20,852 23,302 Non - GAAP Gross Profit 74% 68% 72% Non - GAAP Gross Margin (%) Non – GAAP EBITDA Reconciliation (26,772) (4,803) (36,284) Net loss - - 5 Income taxes 19,253 13,120 17,437 Interest expense 5,586 6,723 7,157 Depreciation, amortization, and accretion (1,933) 15,040 (11,685) Non – GAAP EBITDA Non – GAAP Adjusted EBITDA Reconciliation (1,933) 15,040 (11,685) Non - GAAP EBITDA 12,160 1,129 1,198 Other expenses (318) (1,934) (1,275) Other income 1,233 216 23,925 Development costs (one time charge) 11,132 14,451 12,163 Adjusted EBITDA
Non - GAAP Factors 26 The projected financial information included in this proxy statement includes certain non - GAAP financial measures, including EBITDA, EBITDA margin, non - GAAP gross profit and non - GAAP gross margin . Alternus’ management included these non - GAAP financial measures because it believes they are useful in evaluating Alternus’ operating performance, as they are similar to measures reported by Alternus’ public competitors and are regularly used by security analysts, institutional investors, and other interested parties in analyzing operating performance and prospects . Alternus defines EBITDA as net income (loss), before interest income / (expense), income taxes, depreciation, amortization, and accretion, other income and expense, fixed asset impairment loss, noncapitalized development cost change in fair value of derivative liabilities, stock compensation and any bargain purchase treatment non - GAAP estimates for EBITDA exclude interest, taxes, depreciation which will vary based on borrowing requirements, available interest rates to Alternus at the time capital is required, depreciation of assets and any placeholder for stock - based compensation which is dependent on stock - price projections, which are unknown . EBITDA is not a financial measure prepared in accordance with GAAP and should not be considered a substitute for the net income (loss) prepared in accordance with GAAP . EBITDA margin is a non - GAAP financial measure defined as Alternus’ EBITDA divided by total revenues . Alternus’ management believes that these non - GAAP financial measures, when taken together with the corresponding GAAP financial measures, provide meaningful supplemental information regarding Alternus’ performance by excluding certain items that may not be indicative of Alternus’ business, results of operations, or outlook . Alternus defines non - GAAP gross profit as revenue less cost of revenues . Non - GAAP gross margin is defined as Alternus’ non - GAAP gross profit divided by total revenues . Alternus’ management believes non - GAAP gross profit and non - GAAP gross margin can provide a useful measure of Alternus’ core performance over time as they eliminate the impact of non - cash expenses and allow a direct comparison of Alternus’ cash operations and ongoing operating performance between periods . Non - GAAP financial information is presented for supplemental informational purposes only, has limitations as an analytical tool and should not be considered in isolation or as a substitute for financial information presented in accordance with GAAP . In addition, other companies, including companies in Alternus’ industry, may calculate similarly titled non - GAAP measures differently or may use other measures to evaluate their performance, all of which could reduce the usefulness of our non - GAAP financial measures as tools for comparison . A reconciliation is provided below for the non - GAAP financial measures to the most directly comparable financial measures stated in accordance with GAAP . Investors are encouraged to review the related GAAP financial measures and the reconciliation of these non - GAAP financial measures to their most directly comparable GAAP financial measures, and not to rely on any single financial measure to evaluate Alternus’ business . See slide 40 for the reconciliation of Non – GAAP measures :
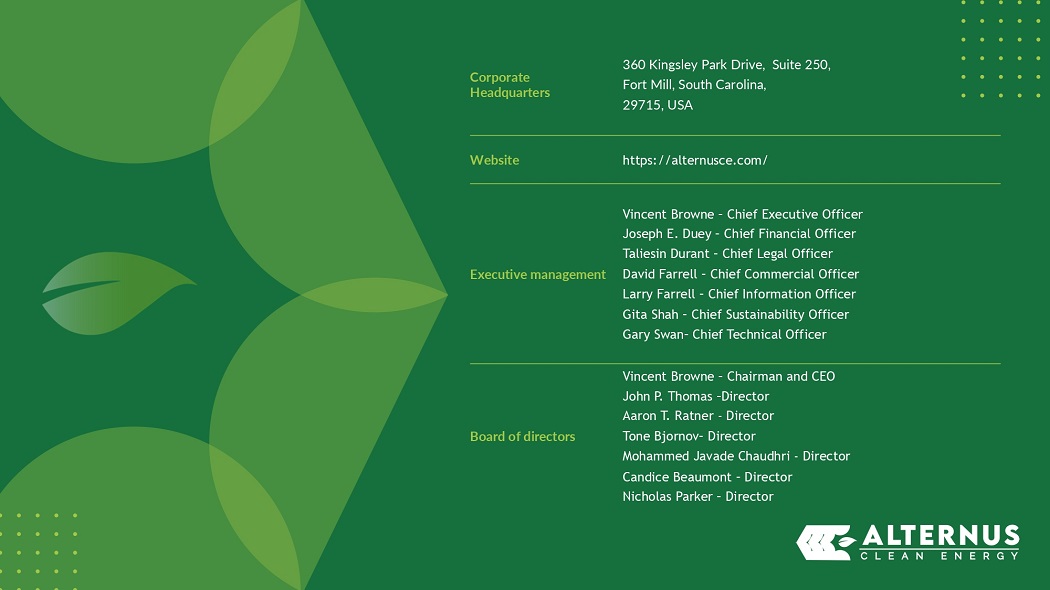
360 Kingsley Park Drive, Suite 250, Fort Mill, South Carolina, 29715, USA Corporate Headquarters https://alternusce.com/ Website Vincent Browne – Chief Executive Officer Joseph E. Duey – Chief Financial Officer Taliesin Durant – Chief Legal Officer David Farrell – Chief Commercial Officer Larry Farrell – Chief Information Officer Gita Shah – Chief Sustainability Officer Gary Swan – Chief Technical Officer Executive management Vincent Browne – Chairman and CEO John P. Thomas – Director Aaron T. Ratner - Director Tone Bjornov – Director Mohammed Javade Chaudhri - Director Candice Beaumont – Director Nicholas Parker – Director Board of directors
v3.24.0.1
Cover
|
Mar. 04, 2024 |
| Cover [Abstract] |
|
| Document Type |
8-K
|
| Amendment Flag |
false
|
| Document Period End Date |
Mar. 04, 2024
|
| Entity File Number |
001-41306
|
| Entity Registrant Name |
ALTERNUS CLEAN ENERGY, INC.
|
| Entity Central Index Key |
0001883984
|
| Entity Tax Identification Number |
87-1431377
|
| Entity Incorporation, State or Country Code |
DE
|
| Entity Address, Address Line One |
360 Kingsley Park Drive
|
| Entity Address, Address Line Two |
Suite 250
|
| Entity Address, City or Town |
Fort Mill
|
| Entity Address, State or Province |
SC
|
| Entity Address, Postal Zip Code |
29715
|
| City Area Code |
800
|
| Local Phone Number |
581-1531
|
| Written Communications |
false
|
| Soliciting Material |
false
|
| Pre-commencement Tender Offer |
false
|
| Pre-commencement Issuer Tender Offer |
false
|
| Title of 12(b) Security |
Common Stock, par value $0.0001 per share
|
| Trading Symbol |
ALCE
|
| Security Exchange Name |
NASDAQ
|
| Entity Emerging Growth Company |
true
|
| Elected Not To Use the Extended Transition Period |
false
|
| X |
- DefinitionBoolean flag that is true when the XBRL content amends previously-filed or accepted submission.
| Name: |
dei_AmendmentFlag |
| Namespace Prefix: |
dei_ |
| Data Type: |
xbrli:booleanItemType |
| Balance Type: |
na |
| Period Type: |
duration |
|
| X |
- DefinitionFor the EDGAR submission types of Form 8-K: the date of the report, the date of the earliest event reported; for the EDGAR submission types of Form N-1A: the filing date; for all other submission types: the end of the reporting or transition period. The format of the date is YYYY-MM-DD.
| Name: |
dei_DocumentPeriodEndDate |
| Namespace Prefix: |
dei_ |
| Data Type: |
xbrli:dateItemType |
| Balance Type: |
na |
| Period Type: |
duration |
|
| X |
- DefinitionThe type of document being provided (such as 10-K, 10-Q, 485BPOS, etc). The document type is limited to the same value as the supporting SEC submission type, or the word 'Other'.
| Name: |
dei_DocumentType |
| Namespace Prefix: |
dei_ |
| Data Type: |
dei:submissionTypeItemType |
| Balance Type: |
na |
| Period Type: |
duration |
|
| X |
- DefinitionAddress Line 1 such as Attn, Building Name, Street Name
| Name: |
dei_EntityAddressAddressLine1 |
| Namespace Prefix: |
dei_ |
| Data Type: |
xbrli:normalizedStringItemType |
| Balance Type: |
na |
| Period Type: |
duration |
|
| X |
- DefinitionAddress Line 2 such as Street or Suite number
| Name: |
dei_EntityAddressAddressLine2 |
| Namespace Prefix: |
dei_ |
| Data Type: |
xbrli:normalizedStringItemType |
| Balance Type: |
na |
| Period Type: |
duration |
|
| X |
- Definition
+ References
+ Details
| Name: |
dei_EntityAddressCityOrTown |
| Namespace Prefix: |
dei_ |
| Data Type: |
xbrli:normalizedStringItemType |
| Balance Type: |
na |
| Period Type: |
duration |
|
| X |
- DefinitionCode for the postal or zip code
| Name: |
dei_EntityAddressPostalZipCode |
| Namespace Prefix: |
dei_ |
| Data Type: |
xbrli:normalizedStringItemType |
| Balance Type: |
na |
| Period Type: |
duration |
|
| X |
- DefinitionName of the state or province.
| Name: |
dei_EntityAddressStateOrProvince |
| Namespace Prefix: |
dei_ |
| Data Type: |
dei:stateOrProvinceItemType |
| Balance Type: |
na |
| Period Type: |
duration |
|
| X |
- DefinitionA unique 10-digit SEC-issued value to identify entities that have filed disclosures with the SEC. It is commonly abbreviated as CIK. Reference 1: http://www.xbrl.org/2003/role/presentationRef
-Publisher SEC
-Name Exchange Act
-Number 240
-Section 12
-Subsection b-2
| Name: |
dei_EntityCentralIndexKey |
| Namespace Prefix: |
dei_ |
| Data Type: |
dei:centralIndexKeyItemType |
| Balance Type: |
na |
| Period Type: |
duration |
|
| X |
- DefinitionIndicate if registrant meets the emerging growth company criteria. Reference 1: http://www.xbrl.org/2003/role/presentationRef
-Publisher SEC
-Name Exchange Act
-Number 240
-Section 12
-Subsection b-2
| Name: |
dei_EntityEmergingGrowthCompany |
| Namespace Prefix: |
dei_ |
| Data Type: |
xbrli:booleanItemType |
| Balance Type: |
na |
| Period Type: |
duration |
|
| X |
- DefinitionCommission file number. The field allows up to 17 characters. The prefix may contain 1-3 digits, the sequence number may contain 1-8 digits, the optional suffix may contain 1-4 characters, and the fields are separated with a hyphen.
| Name: |
dei_EntityFileNumber |
| Namespace Prefix: |
dei_ |
| Data Type: |
dei:fileNumberItemType |
| Balance Type: |
na |
| Period Type: |
duration |
|
| X |
- DefinitionTwo-character EDGAR code representing the state or country of incorporation.
| Name: |
dei_EntityIncorporationStateCountryCode |
| Namespace Prefix: |
dei_ |
| Data Type: |
dei:edgarStateCountryItemType |
| Balance Type: |
na |
| Period Type: |
duration |
|
| X |
- DefinitionThe exact name of the entity filing the report as specified in its charter, which is required by forms filed with the SEC. Reference 1: http://www.xbrl.org/2003/role/presentationRef
-Publisher SEC
-Name Exchange Act
-Number 240
-Section 12
-Subsection b-2
| Name: |
dei_EntityRegistrantName |
| Namespace Prefix: |
dei_ |
| Data Type: |
xbrli:normalizedStringItemType |
| Balance Type: |
na |
| Period Type: |
duration |
|
| X |
- DefinitionThe Tax Identification Number (TIN), also known as an Employer Identification Number (EIN), is a unique 9-digit value assigned by the IRS. Reference 1: http://www.xbrl.org/2003/role/presentationRef
-Publisher SEC
-Name Exchange Act
-Number 240
-Section 12
-Subsection b-2
| Name: |
dei_EntityTaxIdentificationNumber |
| Namespace Prefix: |
dei_ |
| Data Type: |
dei:employerIdItemType |
| Balance Type: |
na |
| Period Type: |
duration |
|
| X |
- DefinitionLocal phone number for entity.
| Name: |
dei_LocalPhoneNumber |
| Namespace Prefix: |
dei_ |
| Data Type: |
xbrli:normalizedStringItemType |
| Balance Type: |
na |
| Period Type: |
duration |
|
| X |
- DefinitionBoolean flag that is true when the Form 8-K filing is intended to satisfy the filing obligation of the registrant as pre-commencement communications pursuant to Rule 13e-4(c) under the Exchange Act. Reference 1: http://www.xbrl.org/2003/role/presentationRef
-Publisher SEC
-Name Exchange Act
-Number 240
-Section 13e
-Subsection 4c
| Name: |
dei_PreCommencementIssuerTenderOffer |
| Namespace Prefix: |
dei_ |
| Data Type: |
xbrli:booleanItemType |
| Balance Type: |
na |
| Period Type: |
duration |
|
| X |
- DefinitionBoolean flag that is true when the Form 8-K filing is intended to satisfy the filing obligation of the registrant as pre-commencement communications pursuant to Rule 14d-2(b) under the Exchange Act. Reference 1: http://www.xbrl.org/2003/role/presentationRef
-Publisher SEC
-Name Exchange Act
-Number 240
-Section 14d
-Subsection 2b
| Name: |
dei_PreCommencementTenderOffer |
| Namespace Prefix: |
dei_ |
| Data Type: |
xbrli:booleanItemType |
| Balance Type: |
na |
| Period Type: |
duration |
|
| X |
- DefinitionTitle of a 12(b) registered security. Reference 1: http://www.xbrl.org/2003/role/presentationRef
-Publisher SEC
-Name Exchange Act
-Number 240
-Section 12
-Subsection b
| Name: |
dei_Security12bTitle |
| Namespace Prefix: |
dei_ |
| Data Type: |
dei:securityTitleItemType |
| Balance Type: |
na |
| Period Type: |
duration |
|
| X |
- DefinitionName of the Exchange on which a security is registered. Reference 1: http://www.xbrl.org/2003/role/presentationRef
-Publisher SEC
-Name Exchange Act
-Number 240
-Section 12
-Subsection d1-1
| Name: |
dei_SecurityExchangeName |
| Namespace Prefix: |
dei_ |
| Data Type: |
dei:edgarExchangeCodeItemType |
| Balance Type: |
na |
| Period Type: |
duration |
|
| X |
- DefinitionBoolean flag that is true when the Form 8-K filing is intended to satisfy the filing obligation of the registrant as soliciting material pursuant to Rule 14a-12 under the Exchange Act. Reference 1: http://www.xbrl.org/2003/role/presentationRef
-Publisher SEC
-Name Exchange Act
-Section 14a
-Number 240
-Subsection 12
| Name: |
dei_SolicitingMaterial |
| Namespace Prefix: |
dei_ |
| Data Type: |
xbrli:booleanItemType |
| Balance Type: |
na |
| Period Type: |
duration |
|
| X |
- DefinitionTrading symbol of an instrument as listed on an exchange.
| Name: |
dei_TradingSymbol |
| Namespace Prefix: |
dei_ |
| Data Type: |
dei:tradingSymbolItemType |
| Balance Type: |
na |
| Period Type: |
duration |
|
| X |
- DefinitionBoolean flag that is true when the Form 8-K filing is intended to satisfy the filing obligation of the registrant as written communications pursuant to Rule 425 under the Securities Act. Reference 1: http://www.xbrl.org/2003/role/presentationRef
-Publisher SEC
-Name Securities Act
-Number 230
-Section 425
| Name: |
dei_WrittenCommunications |
| Namespace Prefix: |
dei_ |
| Data Type: |
xbrli:booleanItemType |
| Balance Type: |
na |
| Period Type: |
duration |
|
Clean Earth Acquisition (NASDAQ:CLIN)
Historical Stock Chart
From Apr 2024 to May 2024

Clean Earth Acquisition (NASDAQ:CLIN)
Historical Stock Chart
From May 2023 to May 2024
