| PROPRIETARY AND CONFIDENTIAL ©2023 ENFUSION. ALL RIGHTS RESERVED.
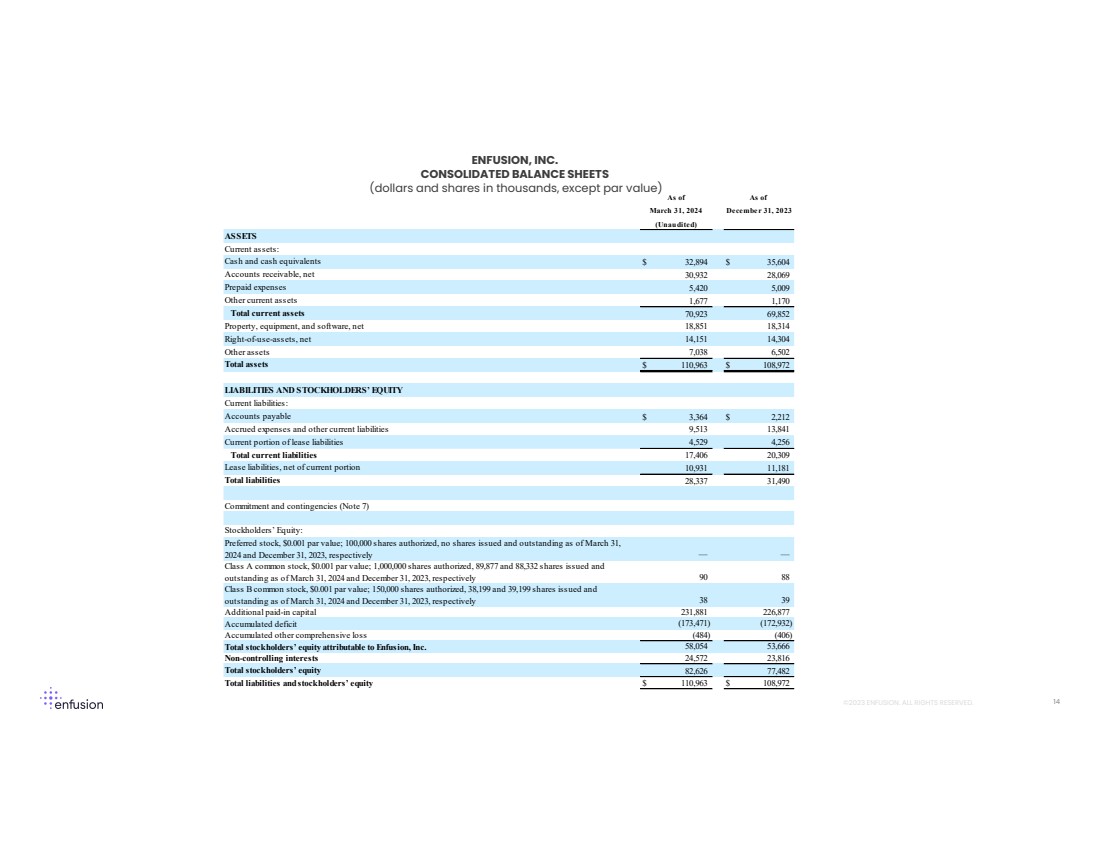
ENFUSION, INC.
CONSOLIDATED BALANCE SHEETS
(dollars and shares in thousands, except par value)
ASSETS
Current assets:
Cash and cash equivalents $ 32,894 $ 35,604
Accounts receivable, net 30,932 28,069
Prepaid expenses 5,420 5,009
Other current assets 1,677 1,170
Total current assets 70,923 69,852
Property, equipment, and software, net 18,851 18,314
Right-of-use-assets, net 14,151 14,304
Other assets 7,038 6,502
Total assets $ 110,963 $ 108,972
LIABILITIES AND STOCKHOLDERS’ EQUITY
Current liabilities:
Accounts payable $ 3,364 $ 2,212
Accrued expenses and other current liabilities 9,513 13,841
Current portion of lease liabilities 4,529 4,256
Total current liabilities 17,406 20,309
Lease liabilities, net of current portion 10,931 11,181
Total liabilities 28,337 31,490
Commitment and contingencies (Note 7)
Stockholders’ Equity:
Preferred stock, $0.001 par value; 100,000 shares authorized, no shares issued and outstanding as of March 31,
2024 and December 31, 2023, respectively — —
Class A common stock, $0.001 par value; 1,000,000 shares authorized, 89,877 and 88,332 shares issued and
outstanding as of March 31, 2024 and December 31, 2023, respectively 90 88
Class B common stock, $0.001 par value; 150,000 shares authorized, 38,199 and 39,199 shares issued and
outstanding as of March 31, 2024 and December 31, 2023, respectively 38 39
Additional paid-in capital 231,881 226,877
Accumulated deficit (173,471) (172,932)
Accumulated other comprehensive loss (484) (406)
Total stockholders’ equity attributable to Enfusion, Inc. 58,054 53,666
Non-controlling interests 24,572 23,816
Total stockholders’ equity 82,626 77,482
Total liabilities and stockholders’ equity $ 110,963 $ 108,972
(Unaudited)
As of As of
March 31, 2024 December 31, 2023
14 |