TIDMTLW TIDMTTM TIDMTTM
RNS Number : 8037Z
Tullow Oil PLC
15 January 2020
Tullow Oil plc - Trading Statement & Operational Update
15 January 2020 - Tullow Oil plc (Tullow) issues this update and
guidance in advance of the Group's 2019 Full Year Results. The
information contained herein has not been audited and may be
subject to further review and amendment. Tullow will hold a
conference call at 8:30am today, please see below for details.
Dorothy Thompson, Executive Chair, Tullow Oil plc, commented
today:
"Tullow has ended 2019 with average production of 86,700 bopd
and free cash flow generation of c.$350 million. Since our December
announcement, Tullow's senior team has been working hard on a major
review focused on delivering a more efficient and effective
organisation. The fundamentals of our business remain intact:
recent reserves audits demonstrate that we have a solid underlying
reserves and resources base in West and East Africa, our producing
assets continue to generate good cash flow and we retain a
high-quality exploration portfolio. The Board and senior management
are confident of the long-term potential of the portfolio and see
meaningful opportunities to improve operational performance, reduce
our cost base, deliver sustainable free cash flow and reduce our
debt."
Financial and operational update
2019 performance
-- Group working interest oil production averaged 86,700 bopd in 2019 in line with expectations.
-- 2019 full year total revenue is expected to be c.$1.7
billion; gross profit is expected to be c.$0.7 billion. Capital
expenditure in 2019 was c.$490 million.
-- Free cash flow for the full year 2019 is expected to be
c.$350 million, with net debt reduced to c.$2.8 billion and gearing
expected to be around 2.0 times.
-- Tullow expects to report pre-tax impairments and exploration
write-offs of c.$1.5 billion (c.$1.3 billion post tax) primarily
due to a $10/bbl reduction in the Group's long-term accounting oil
price assumption to $65/bbl and a reduction in TEN 2P reserves.
2020 outlook
-- In 2020, capital expenditure is expected to be c.$350
million, with an additional c.$100 million expected to be spent on
decommissioning. Tullow expects to generate underlying free cash
flow of at least $150 million from 75,000 bopd at $60/bbl.
-- Operations across the Group's production assets have started
the year in line with expectations and 2020 Group average
production guidance remains unchanged at 70,000 to 80,000 bopd.
-- In Ghana, recent activity at Jubilee includes the tie-in of
the J-54 water injector well and planning for a maintenance period
at the end of January to increase gas processing capacity. At TEN,
the drilling of a production well on the Ntomme field has commenced
and the well is expected to be tied-in by the end of the first
quarter.
-- In Kenya, the early oil pilot scheme (EOPS) is suspended due
to severe damage to roads caused by adverse weather in the fourth
quarter of 2019. Trucking remains on hold until all roads are
repaired to a safe standard. Work continues with Joint Venture
Partners and the Government of Kenya to progress the development
project.
-- In Uganda, Joint Venture conversations with the Government
are ongoing. Tullow remains committed to reducing its equity stake
in the project ahead of FID.
-- Tullow recently announced the results of the Carapa-1
exploration well offshore Guyana, which proved the extension of the
Cretaceous oil play into the Group's Guyana acreage. Next steps
will include the integration of the Carapa result into geological
and geophysical models and high-grading of the Cretaceous portfolio
across both the Kanuku and Orinduik blocks.
-- The Marina-1 well offshore Peru is due to spud at the end of
January 2020 and is expected to take around 60 days.
Group reserves and resources
In late 2018, Tullow appointed TRACS as its independent reserves
auditor. Over the course of 2019, over 95% of the Group's reserves
and resources have been audited and the results underpin the
quality of the asset base. Group net 2P reserves at year-end 2019
are 245 mmboe (2018: 280 mmboe). Excluding the impact of 2019
production (31 mmboe), reserves are largely unchanged year-on-year
and reflects an increase in reserves at the Jubilee field and
non-operated assets, offset by a reduction in reserves at the
Enyenra field at TEN. Group net 2C resources have increased to
1,102 mmboe (2018: 874 mmboe), largely driven by additions in
Ghana. Tullow will publish its full audited reserves and resources
with its 2019 Full Year Results.
Business Review update & reporting timetable
The Board's business review covering all areas of Tullow's
operations, cost-base and reporting is progressing well. The Board
is confident that the outcomes will deliver significant
improvements to the Group's organisational structure, major
reductions in G&A and a more efficient and effective business.
Actions taken in December included the implementation of a smaller,
more focused interim Executive team and initial restructuring of
the next level of leadership. Since then, work has focused on
simplifying the structure of the organisation and these changes
will be implemented in the coming months. The next phase of the
review will focus on the investment plans for each of the Group's
major assets.
One of the decisions already made by the Board is to align the
Group's reporting calendar to that of its E&P peers and, going
forward, the Group will report its Full Year Results in March and
its Half Year Result in September. The 2019 Full Year Results will
be released on 12 March 2020. The new timetable will enable Tullow
to report on the key outcomes of the ongoing business review in its
Full Year Results and its 2019 Annual Report and Accounts.
The recruitment of a new Chief Executive Officer is well under
way with the assistance of an executive search firm.
Trading Statement Guidance
Guidance is provided in relation to Tullow's full year reporting
to 31 December 2019 in advance of the Group's Full Year Results
release on 12 March 2020. Guidance figures have not been audited
and may be subject to further review and amendment.
SUMMARY FINANCIALS
                                           2019
 ==================================  ==========
 Total revenue ($bn)                        1.7
----------------------------------   ----------
 Gross profit ($bn)                         0.7
----------------------------------   ----------
 Administrative expenses ($bn)              0.1
----------------------------------   ----------
 Free cash flow ($bn)                       0.4
----------------------------------   ----------
 Net debt ($bn)                             2.8
----------------------------------   ----------
 Gearing (net debt: Adj EBITDAX)      2.0 times
==================================   ==========
Note 1: Revenue driven by realised post-hedge oil price of
$63/bbl. Total revenue does not include receipts from Tullow's
Corporate Business Interruption insurance of c.$40 million. This is
included in Other Operating Income which is a component of Gross
Profit.
IMPAIRMENTS and Exploration write-offs
                                        Pre-tax write-off   Tax effect   Net write-off
=====================================  ==================  ===========  ==============
 Impairment of PP&E, net ($bn)                        0.7        (0.2)             0.5
-------------------------------------  ------------------  -----------  --------------
 Exploration costs written-off ($bn)                  0.8            -             0.8
=====================================  ==================  ===========  ==============
Note 2: Impairments of property, plant and equipment are largely
associated with a reduction in the Group's long-term accounting oil
price assumption from $75/bbl to $65/bbl and a 2P reserves
reduction at the Enyenra field at TEN.
Note 3: Exploration costs written off are predominately driven
by a write-down of the value of the Kenya and Uganda assets due to
a reduction in the Group's long-term accounting oil price
assumption from $75/bbl to $65/bbl. The remaining write-offs
include Jethro, Joe and Carapa well costs in Guyana as a result of
drilling results and Kenya Block 12A, Mauritania C3, PEL37 Namibia
and Jamaica licence costs due to the levels of planned future
activity or licence exits.
CAPITAL AND OTHER EXPITURE
                                                                                         2019         2020
===============================================================================  ============  ===========
 Capital expenditure ($m)                                                                 490          350
-------------------------------------------------------------------------------  ------------  -----------
 Decommissioning expenditure ($m)                                                          81          100
===============================================================================  ============  ===========
 Note 4: 2019 capex reduction from previous guidance due to deferral and reduction of expenditure
  and release of accruals.
  Note 5: 2020 capex breakdown of c.$140 million in Ghana, c.$80 million on West Africa non-operated,
  c.$40 million in Kenya, c.$15 million in Uganda and c.$75 million on exploration and appraisal
  activities.
  Note 6: Decommissioning expenditure is gross of any tax relief and relates to UK and Mauritania
  decommissioning activities.
2020 Hedging position
  Hedge structure                      Bopd   Bought put (floor)   Sold call   Bought call
----------------------------------  -------  -------------------  ----------  ------------
  Collars                            33,000               $57.60      $79.21             -
----------------------------------  -------  -------------------  ----------  ------------
  Three-way collars (call spread)    12,000               $56.42      $77.82        $87.68
----------------------------------  -------  -------------------  ----------  ------------
  Total / weighted average           45,000               $57.28      $78.84        $87.68
----------------------------------  -------  -------------------  ----------  ------------
Note 7: 2021 hedging position at 31 Dec 2019: c.22,000 bopd
hedged with an average floor price protected of c.$52.80/bbl.
GROUP AVERAGE WORKING INTEREST PRODUCTION
                                                                                 FY 2020 forecast
                                                              FY 2019 Actuals           mid-point
 Oil Production                                                       (kbopd)             (kbopd)
===========================================================  ================  ==================
 Ghana                                                                   59.9                52.0
===========================================================  ================  ==================
 Ghana Jubilee production-equivalent                                      2.0                 N/A
  insurance payments
===========================================================  ================  ==================
 Equatorial Guinea                                                        5.4                 5.0
===========================================================  ================  ==================
 Gabon                                                                   16.7                16.0
===========================================================  ================  ==================
 Côte d'Ivoire (includes condensate)                                 2.7                 2.0
===========================================================  ================  ==================
 OIL PRODUCTION TOTAL (inc. Jubilee production-equivalent)               86.7                75.0
===========================================================  ================  ==================
This announcement includes inside information as defined in
Article 7 of the Market Abuse Regulation No. 596/2014 and is being
released on behalf of Tullow by Adam Holland, Company
Secretary.
CONFERENCE CALL DETAILS:
 8:30am UK time Wednesday    Replay:
  15 January:                 Conference ID: 5346287
  Conference ID: 5346287      From the UK: 0844 571 8951
  From the UK: 0844 481       UK free phone: 0808 238
  9752                        0667
  UK free phone: 0800 2796    Outside of the UK: +44 (0)
  619                         3333 009 785
  Outside of the UK: +44
  (0) 207 1928 338
FOR FURTHER INFORMATION CONTACT:
 Tullow Oil plc             Murray Consultants
  (London)                   (Dublin)
  (+44 20 3249 9000)         (+353 1 498 0300)
  IR: Chris Perry, Nicola    Pat Walsh
  Rogers, Matt Evans         Joe Heron
  Media: George Cazenove
Notes to Editors
Tullow Oil plc
Tullow is a leading independent oil & gas, exploration and
production group, quoted on the London, Irish and Ghanaian stock
exchanges (symbol: TLW). The Group has interests in 80 exploration
and production licences across 15 countries which are managed as
three business delivery teams: West Africa, East Africa and New
Ventures.
Follow Tullow on:
   Twitter: www.twitter.com/TullowOilplc                                           YouTube: www.youtube.com/TullowOilplc
   Facebook: www.facebook.com/TullowOilplc                                                 LinkedIn: www.linkedin.com/company/Tullow-Oil
Website: www.tullowoil.com
This information is provided by RNS, the news service of the
London Stock Exchange. RNS is approved by the Financial Conduct
Authority to act as a Primary Information Provider in the United
Kingdom. Terms and conditions relating to the use and distribution
of this information may apply. For further information, please
contact rns@lseg.com or visit www.rns.com.
END
MSCKKQBKFBKDCDD
(END) Dow Jones Newswires
January 15, 2020 02:00 ET (07:00 GMT)
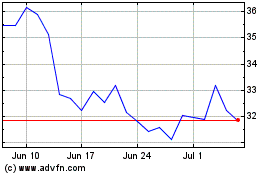
Tullow Oil (LSE:TLW)
Historical Stock Chart
From Mar 2024 to Apr 2024

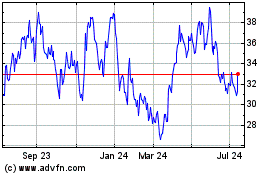
Tullow Oil (LSE:TLW)
Historical Stock Chart
From Apr 2023 to Apr 2024
