TIDMCRS
RNS Number : 4481J
Crystal Amber Fund Limited
14 April 2020
14 April 2020
CRYSTAL AMBER FUND LIMITED
("Crystal Amber Fund" or the "Fund")
Monthly Net Asset Value
Crystal Amber Fund announces that its unaudited net asset value
("NAV") per share at 31 March 2020 was 89.59 pence (29 February
2020: 133.08 pence per share).
The proportion of the Fund's NAV at 31 March 2019 represented by
the ten largest shareholdings, other investments and cash
(including accruals), was as follows:
 Ten largest shareholdings             Pence per share   Percentage of investee equity
                                                          held
------------------------------------  ----------------  ------------------------------
 Allied Minds plc                       15.2             22.6%
 Hurricane Energy plc                  14.5              6.3%
 De La Rue plc                         12.3              19.2%
 Redde Northgate plc                   9.3               2.5%
 Equals Group plc                      9.1               21.4%
 Board Intelligence Ltd                5.9               *
 Kenmare Resources plc                 4.3               1.8%
 Camellia plc                          2.2               1.1%
 Sutton Harbour Group plc              1.9               10.8%
 *GI Dynamics Inc.                     1.5               73.1%
 Total of ten largest shareholdings    76.2
 Other investments                     10.0
 Cash and accruals                     3.4
------------------------------------  ----------------
 Total NAV                             89.6
------------------------------------  ----------------
*Board Intelligence Ltd is a private company and its shares are
not listed on a stock exchange. Therefore, the percentage held is
not disclosed.
Recent unprecedented conditions resulted in widespread distress
selling and volatility, which led to the dramatic performance of
the Fund's concentrated portfolio. However, the Fund is closed
ended, has net cash and added to some of its core holdings at
extremely distressed levels. The Fund is confident that there is
very significant value to be realised from the portfolio once
markets have visibility that the worst of the pandemic and its
consequences are over. Since month end, several core holdings
including Hurricane Energy plc and Equals Group plc have seen
strong share price recoveries, with Hurricane Energy's share price
rising by 49 per cent and Equals Group plc by 39 per cent.
Investment Adviser's commentary on the portfolio
Over the quarter to 31 March 2020, NAV per share fell by 50.0%.
A 2.5p dividend declared on 10 December 2019 was paid on 13 January
2020.
The top three detractors to NAV over the quarter to 31 March
2020 were Equals Group plc (14.5%), Hurricane Energy plc (14.3%)
and De la Rue (9%).
Allied Minds plc ("Allied Minds")
In January 2020, Allied Minds declared a special dividend of $40
million, or 12.62p per share. This capital return was generated by
the sale of HawkEye 360, which completed in November 2019.
In February 2020, Allied Mind's investee company Federated
Wireless launched a new connectivity as a service product in the
US. Enterprises are able to buy and deploy 4G and 5G private
networks through the market places of Amazon Web Services and
Azure, two top global public clouds.
Allied Minds has a net asset value per share of around 75p,
which includes net cash of 15p a share. Against a 26p share price,
the portfolio (excluding cash) is therefore valued at 11p a share.
This compares with its carrying value of 60p a share, resulting in
the investment portfolio (excluding cash) trading at an 81.7%
discount to its latest reported carrying value.
During March 2020, the Fund increased its holding from 16.9% to
22.6% and is now the largest shareholder in Allied Minds. The Fund
firmly believes that there remains scope to reduce its $6 million
per annum overheads and in the current climate, Allied Minds should
take quick and decisive action to reduce its cost base.
Over the quarter, Allied Minds' share price fell by 49%.
Adjusting for the special dividend, the total return was a negative
33%.
De La Rue plc ("De La Rue")
Over the period, De La Rue announced its turnaround plans,
replaced its chief financial officer and met its covenant tests. A
trading update at the end of the quarter confirmed operating profit
guidance for the year to March 2020 of between GBP20 and GBP25
million. Financial year end net debt is expected to be
approximately GBP105 million, down from GBP171 million six months
earlier.
As part of its turnaround plans brought in by the new CEO, the
company has already realised annualised savings of GBP10 million.
It is targeting savings of GBP35 million by its financial year
2021/2022, exceeding previous cost reduction commitments of GBP20
million. The market has been advised that full details of the
turnaround plan will be presented together with its preliminary
results in May.
De La Rue has stated that it is too early to quantify the
effects of COVID 19. However, its share price, which until the end
of February was unchanged over the previous two months, in March,
fell by 60%, valuing its equity at around GBP50 million.
Over the quarter, De La Rue's share price fell by 60%.
Hurricane Energy plc ("Hurricane")
In January 2020, Hurricane concluded its single well tests on
its Early Production System (EPS) at Lancaster. It has since
increased production at both wells and reached 20,000 barrels of
production per day. This is the maximum it can produce under
current permissions.
Over the quarter, the oil price fell sharply due to the Covid-19
induced demand shock and a fallout between producing countries. The
company's EPS cost of production is $17 per barrel at its guided
production rate.
The Oil and Gas Authority (OGA) has acknowledged the impact of
Covid-19 on operators' ability to carry out work programmes.
Negotiations have started between Hurricane and the OGA to review
existing commitments. We expect the company's capex for 2020 to
fall relative to prior outlook.
In its final results announced on 19 March 2020, Hurricane
reported an unrestricted cash balance of GBP164.3 million. It
forecasts this to be sufficient to meet obligations and committed
costs as they fall due.
Over the quarter, Hurricane's share price fell by 68%.
GI Dynamics Inc ("GI Dynamics")
On 27 January 2020, GI Dynamics announced the enrolment of the
first patient on its US STEP-1 clinical trial. On 31 March 2020,
the Fund agreed to a one-month extension to its loan note.
Since November 2019, the Fund has held a board observer position
in GI Dynamics. As a consequence, it is not in a position to
comment other than by reference to public announcements made by the
company.
Over the quarter, GI Dynamic's share price fell by 83%.
Issue of shares to charities and transactions in own shares
During the quarter, the Fund issued 125,000 shares to five
charities following the authority granted at its Annual General
Meeting.
The Fund also bought back 1,265,000 of its own ordinary shares
at an average price of 82.52p per share as part of its buyback
programme.
For further enquiries please contact:
Crystal Amber Fund Limited
Chris Waldron (Chairman)
Tel: 01481 742 742
www.crystalamber.com
Allenby Capital Limited - Nominated Adviser
David Worlidge/Liz Kirchner
Tel: 020 3328 5656
Winterflood Investment Trusts - Broker
Joe Winkley/Neil Langford
Tel: 020 3100 0160
Crystal Amber Advisers (UK) LLP - Investment Adviser
Richard Bernstein
Tel: 020 7478 9080
This information is provided by RNS, the news service of the
London Stock Exchange. RNS is approved by the Financial Conduct
Authority to act as a Primary Information Provider in the United
Kingdom. Terms and conditions relating to the use and distribution
of this information may apply. For further information, please
contact rns@lseg.com or visit www.rns.com.
END
NAVUKABRRRUSRAR
(END) Dow Jones Newswires
April 14, 2020 02:00 ET (06:00 GMT)
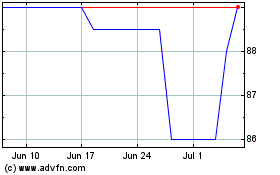
Crystal Amber (LSE:CRS)
Historical Stock Chart
From Mar 2024 to Apr 2024

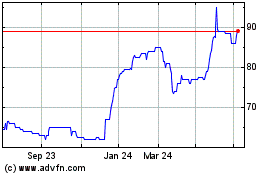
Crystal Amber (LSE:CRS)
Historical Stock Chart
From Apr 2023 to Apr 2024
