BlackRock World Mng Portfolio Update
January 20 2021 - 12:18PM
UK Regulatory
TIDMBRWM

The information contained in this release was correct as at 31 December 2020.
Information on the Company's up to date net asset values can be found on the
London Stock Exchange Website at:

https://www.londonstockexchange.com/exchange/news/market-news/
market-news-home.html.

BLACKROCK WORLD MINING TRUST PLC (LEI - LNFFPBEUZJBOSR6PW155)

All information is at 31 December 2020 and unaudited.


Performance at month end with net income reinvested

                                               One      Three       One    Three      Five

                                             Month     Months      Year    Years     Years

Net asset value                              10.8%      18.0%     31.0%    36.2%    225.4%

Share price                                  15.2%      31.2%     46.7%    56.3%    289.5%

MSCI ACWI Metals & Mining 30% Buffer 10/      9.3%      15.0%     20.6%    22.8%    186.2%
40 Index (Net)*

* (Total return)
Sources: BlackRock, MSCI ACWI Metals & Mining 30% Buffer 10/40 Index,
Datastream

At month end

Net asset value (including income)1:                                            533.61p

Net asset value (capital only):                                                 525.20p

1 Includes net revenue of 8.41p

Share price:                                                                    522.00p

Discount to NAV2:                                                                  2.2%

Total assets:                                                                  1,028.5m

Net yield3:                                                                        4.2%

Net gearing:                                                                      12.6%

Ordinary shares in issue:                                                   173,550,814

Ordinary shares held in Treasury:                                            19,461,028

Ongoing charges4:                                                                  1.0%

2 Discount to NAV including income.
3 Based on quarterly interim dividends of 4.00p per share declared on 12
November, 19 August and 30 April 2020 in respect of the year ended 31 December
2020 and a final dividend of 10.00p per share announced on 27 February 2020 in
respect of the year ended 31 December 2019.
4 Calculated as a percentage of average net assets and using expenses,
excluding finance costs, for the year ended 31 December 2019.

Country Analysis                   Total      Sector Analysis                       Total
                              Assets (%)                                       Assets (%)

Global                              64.9      Diversified                            37.3

Australasia                          9.5      Gold                                   25.8

Latin America                        7.2      Copper                                 19.1

South Africa                         5.3      Iron                                    3.3

Canada                               5.2      Platinum Group Metals                   3.3

United Kingdom                       2.4      Iron Ore                                2.8

Other Africa                         1.6      Nickel                                  2.6

Indonesia                            1.5      Steel                                   2.5

United States                        1.4      Industrial Minerals                     1.9

Russia                               1.1      Materials                               0.9

Net Current Liabilities             -0.1      Silver & Diamonds                       0.3

                                   -----      Zinc                                    0.3

                                   100.0      Net Current Liabilities                -0.1

                                   =====                                            -----

                                                                                    100.0

                                                                                    =====


Ten largest investments

Company                                                                   Total Assets %

Vale:

    Equity                                                                           6.8

    Debenture                                                                        4.2

BHP                                                                                  7.7

Rio Tinto                                                                            7.5

Anglo American                                                                       7.2

Freeport-McMoRan Copper & Gold                                                       5.2

Newmont Mining                                                                       4.5

Barrick Gold                                                                         4.2

Wheaton Precious Metals                                                              3.3

OZ Minerals:

    Royalty                                                                          1.7

    Equity                                                                           1.3

First Quantum Minerals:

    Equity                                                                           1.2

    Debt                                                                             1.6


Asset Analysis                                                          Total Assets (%)

Equity                                                                              94.3

Bonds                                                                                3.4

Preferred Stock                                                                      2.5

Option                                                                              -0.1

Net Current Liabilities                                                             -0.1

                                                                                   -----

                                                                                   100.0

                                                                                   =====

Commenting on the markets, Evy Hambro and Olivia Markham, representing the
Investment Manager noted:

Performance

The Company's NAV returned +10.8% in December, outperforming its reference
index, the MSCI ACWI Metals and Mining 30% Buffer 10/40 Index (net return),
which returned +9.3% (Figures in GBP).

Despite renewed lockdowns across Europe and in parts of Asia, global equity
markets continued to ride a wave of optimism following the announcement of
progress in a COVID-19 vaccine, albeit at a slower rate than in November. For
reference, the MSCI AC World Index increased by 4.5%. Cyclical stocks were
buoyed by the news that the US government signed into law a $900 billion
pandemic relief bill that included enhanced unemployment benefits and direct
cash payments. A long-awaited post-Brexit trade deal between the UK and the EU
was finally struck on Christmas Eve but investors' spirits were dampened by the
emergence of a new, highly transmissible coronavirus variant that is spreading
across Europe and the rest of the world. Global economic activity data also
remained strong, with global manufacturing PMIs coming in at 53.8.

Against this macroeconomic backdrop, the mined commodities performed well
almost across the board, supporting the mining sector's outperformance of
broader equity markets.  Iron ore was the standout performer, with the iron ore
62% fe. price rising by 22.4% to an 8-year high of $161/tonne.  Early in the
month, Vale downgraded its 2021 iron ore production guidance to 315-335 million
tonnes versus consensus of circa 350 million tonnes, indicating continued
tightness in that market. Gold also performed well, its price rising by 7.0%
over the month, supported by declines in real interest rates and US dollar
weakness.

Within the Company, gearing contributed positively during a rising market. This
was partly offset by negative stock selection within the copper sub-sector.

Strategy and Outlook

The rebound in global economic activity remains robust, whilst COVID-19 vaccine
developments provide greater certainty around growth. Mined commodity prices
have performed well and we expect them to be well supported at these levels.
Overall, mined commodity supply has been impacted by COVID-19-related
disruptions and inventories are low relative to history for most commodities.

Longer term, we expect commodity supply to be constrained by the
underinvestment of recent years and continued capital discipline. Meanwhile,
commodity demand should continue to be buoyed by increased global
infrastructure spend as governments seek to kick-start their economies. Longer
term, we also expect the transition to a lower carbon global economy to support
demand for certain mined commodities.

Turning to the miners, balance sheets are in strong shape, whilst earnings and
dividends are rising. Meanwhile, we see strong arguments for inflation
exceeding current expectations and, historically, the mining sector has
performed well on an absolute basis and relative to broader equity markets
during periods of rising inflation. We maintain a quality bias in the portfolio
with a focus on companies with stronger balance sheets and lower costs.

All data points are in USD terms unless stated otherwise.

20 January 2021

Latest information is available by typing www.blackrock.com/uk/brwm on the
internet. Neither the contents of the Manager's website nor the contents of any
website accessible from hyperlinks on the Manager's website (or any other
website) is incorporated into, or forms part of, this announcement.


END
(END) Dow Jones Newswires
January 20, 2021 12:18 ET (17:18 GMT)
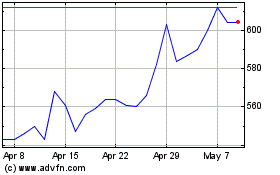
Blackrock World Mining (LSE:BRWM)
Historical Stock Chart
From Mar 2024 to Apr 2024

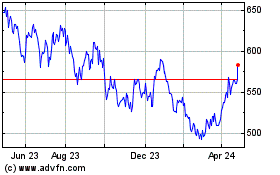
Blackrock World Mining (LSE:BRWM)
Historical Stock Chart
From Apr 2023 to Apr 2024
