BlackRock Smll Cos Portfolio Update
December 23 2020 - 12:21PM
UK Regulatory
TIDMBRSC

The information contained in this release was correct as at 30 November 2020.
Information on the Company's up to date net asset values can be found on the
London Stock Exchange Website at

https://www.londonstockexchange.com/exchange/news/market-news/
market-news-home.html.

BLACKROCK SMALLER COMPANIES TRUST PLC (LEI:549300MS535KC2WH4082)


All information is at 30 November 2020 and unaudited.
Performance at month end is calculated on a capital only basis


                                            One     Three     One    Three      Five
                                          month    months    year    years     years
                                              %         %       %        %         %

Net asset value*                           11.3       9.5     1.3      8.3      51.0

Share price*                               13.1      20.7    -5.4     15.8      54.3

Numis ex Inv Companies + AIM Index         11.0      10.5     2.2     -4.5      20.6

*performance calculations based on a capital only NAV with debt at par, without
income reinvested. Share price performance calculations exclude income
reinvestment.

Sources:  BlackRock and Datastream

At month end

Net asset value Capital only (debt at par value):                             1,568.18p

Net asset value Capital only (debt at fair value):                            1,550.57p

Net asset value incl. Income (debt at par value)1:                            1,569.53p

Net asset value incl. Income (debt at fair value)1:                           1,551.92p

Share price:                                                                  1,484.00p

Discount to Cum Income NAV (debt at par value):                                    5.5%

Discount to Cum Income NAV (debt at fair value):                                   4.4%

Net yield2:                                                                        2.2%

Gross assets3:                                                                  GBP836.0m

Gearing range as a % of net assets:                                               0-15%

Net gearing including income (debt at par):                                        5.4%

Ongoing charges ratio (actual)4:                                                   0.7%

Ordinary shares in issue5:                                                   48,829,792


 1. Includes net revenue of 1.35p

 2. Yield calculations are based on dividends announced in the last 12 months
    as at the date of release of this announcement, and comprise the second
    interim dividend of 19.7 pence per share (announced on 3 June 2020,
    ex-dividend on 11 June 2020) and the first interim dividend of 12.8 pence
    per share (announced on 5 November 2020, ex-dividend on 12 November 2020,
    pay date 2 December 2020).

 3. Includes current year revenue.

 4. As reported in the Annual Financial Report for the year ended 29 February
    2020 the Ongoing Charges Ratio (OCR) was 0.7%. The OCR is calculated as a
    percentage of net assets and using operating expenses, excluding
    performance fees, finance costs and taxation.

 5. Excludes 1,163,731 ordinary shares held in treasury.

Sector Weightings      % of portfolio

Industrials                      26.9

Financials                       18.9

Consumer Services                15.6

Consumer Goods                   12.8

Technology                       10.9

Health Care                       5.9

Basic Materials                   5.6

Telecommunications                1.2

Oil & Gas                         1.1

Materials                         1.1

                                -----

Total                           100.0

                                =====


Country Weightings     % of portfolio

United Kingdom                   97.7

United States                     1.2

Singapore                         0.5

France                            0.3

Guernsey                          0.3

                                -----

Total                           100.0

                                =====


Ten Largest Equity     % of portfolio
Investments
Company

Watches of                        2.3
Switzerland

YouGov                            2.2

Grafton Group                     1.9

IG Design Group                   1.9

Pets at Home                      1.9

Team 17                           1.8

CVS Group                         1.8

Breedon                           1.8

Ergomed                           1.8

Impax Asset                       1.7
Management


Commenting on the markets, Roland Arnold, representing the Investment Manager
noted:

During November the Company's NAV per share rose by 11.3%1 to 1,568.18p,
outperforming our benchmark index which returned 11.0%1; for comparison the
FTSE 100 Index rose by 12.4%1 (all calculations on a capital only basis).

Equity markets rallied during November as positive COVID-19 vaccine results
showing better than expected efficacy from three candidates (Pfizer/BioNTech,
Moderna and Oxford/AstraZeneca), sparked one of the sharpest rotations away
from growth and into value shares on record. The rotation saw many of the
biggest losers this year making the greatest gains during November, resulting
in UK and European indices outperforming other developed equity markets. After
several uncertain days, markets also received a boost from the outcome of the
US election, which saw Joe Biden's Democrats win the White House but the
Republicans hold the senate, arguably the most market friendly result.

Equity market moves during November were heavily driven by the rotation from
growth stocks into more value orientated areas of the market, a rotation which
also drove much of the Company's NAV performance for the month. However,
despite this headwind to our growth bias style, actions taken earlier in the
year to diversify the portfolio, and some positive updates from companies that
continue to successfully navigate this challenging year, resulted in
outperformance. IG Design Group reported sales ahead of expectations as people
have not held back on Christmas preparations (decorations, gift packaging and
crackers), despite the unprecedented challenges of 2020. Meanwhile the company
has seen strong demand for its craft kits as families have embraced many 'at
home activities' during the year. Our holding in Central Asia metals rallied
with the mining sector and strengthening copper price. The shares also
benefited from the announcement that the company would resume payment of its
interim dividend, which was deferred earlier this year). Shares in Pebble Group
rose in response to a positive trading update, which confirmed that the group
is on track to meet full year expectations for the year ending December 2020.
Its Facilisgroup business has continued to perform well during the pandemic,
while its Brand Addition business has continued to improve since flagging
weakness in September.

Many of the largest detractors during November were simply the strongest
performers of recent months giving back some of their gains as investors sold
winners to buy into the value rally. This impacted our holdings in YouGov and
Games Workshop. Importantly, underlying trading in both businesses remains
strong and we do not see any fundamental change to the investment case for
either simply because of the announcement of successful COVID-19 vaccines. Both
companies remain very attractive and we are excited by the opportunities that
we see ahead for these businesses, and we have used share price volatility to
add to our holdings.

The ongoing COVID-19 pandemic along with the US Presidential Election and
Brexit trade negotiations have been key sources of volatility in recent months,
and resolution on these three issues has, and will remain key for equity
markets to return to some level of rational behaviour. At the time of writing,
a number of countries have begun to administer the vaccine to the most
vulnerable individuals, and therefore, despite further mandated restrictions,
stock markets are now focused on how quickly the world can return to something
approximating normality. Whilst the news of workable vaccines is clearly
positive for markets and global economies, we remain mindful that any programme
of mass vaccination will take many months to implement, and therefore we may
see further volatility from third/fourth waves of the virus and lockdowns.

Politics never leaves us, and whilst the US election result has provided the
hope of a more balanced global political environment, attention is now shifting
to Brexit. From our perspective any form of clarity is positive for UK equities
over the medium to long-term. Given how under-owned the UK market is and the
discount it trades at compared with other global markets, we see any conclusion
as having the potential to drive flows into UK equities regardless of whether
we have a negotiated deal or we leave without one. The negotiations have in one
form or another been going on for years, giving companies ample time to prepare
their businesses for a no deal Brexit. We therefore see the risk of unexpected
business disruption as relatively muted at an individual company level. Whilst
there will undoubtedly be some sectors that are more exposed than others, we
remain firmly of the belief that strong companies will prevail, regardless of
the result of the negotiations. We continue to believe that smaller companies
in particular will be able to react and adapt fastest to whatever form Brexit
takes.

The Company's investment strategy is focussed on quality growth investments in
smaller companies, a style that has demonstrably worked for the long-term, and
historically periods of heightened volatility, such as this, have proven to be
excellent investment opportunities.

1Source: BlackRock as at 30 November 2020

23 December 2020S
Latest information is available by typing www.blackrock.co.uk/brsc on the
internet, "BLRKINDEX" on Reuters, "BLRK" on Bloomberg or "8800" on Topic 3 (ICV
terminal).  Neither the contents of the Manager's website nor the contents of
any website accessible from hyperlinks on the Manager's website (or any other
website) is incorporated into, or forms part of, this announcement.


END
(END) Dow Jones Newswires
December 23, 2020 12:21 ET (17:21 GMT)
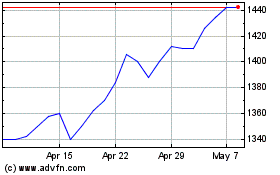
Blackrock Smaller (LSE:BRSC)
Historical Stock Chart
From Mar 2024 to Apr 2024

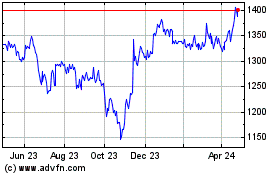
Blackrock Smaller (LSE:BRSC)
Historical Stock Chart
From Apr 2023 to Apr 2024
