BlackRock Smll Cos Portfolio Update
March 30 2020 - 11:26AM
UK Regulatory
TIDMBRSC

The information contained in this release was correct as at 29 February 2020.
Information on the Company's up to date net asset values can be found on the
London Stock Exchange Website at

https://www.londonstockexchange.com/exchange/news/market-news/
market-news-home.html .

BLACKROCK SMALLER COMPANIES TRUST PLC (LEI: 549300MS535KC2WH4082)

All information is at 29 February 2020 and unaudited.

Performance at month end is calculated on a capital only basis

                                            One     Three     One    Three      Five
                                          month    months    year    years     years
                                              %         %       %        %         %

Net asset value*                           -9.9       0.0    11.7     25.6      64.2

Share price*                              -13.6      -5.4    11.6     40.0      82.8

Numis ex Inv Companies + AIM Index         -9.7      -5.5    -1.4     -2.0      12.8

*performance calculations based on a capital only NAV with debt at par, without
income reinvested. Share price performance calculations exclude income
reinvestment.

Sources:  BlackRock and Datastream

At month end

Net asset value Capital only (debt at par value):                        1,548.55p

Net asset value Capital only (debt at fair value):                       1,532.41p

Net asset value incl. Income (debt at par value)1:                       1,572.53p

Net asset value incl. Income (debt at fair value)1:                      1,556.39p

Share price                                                              1,484.00p

Discount to Cum Income NAV (debt at par value):                               5.6%

Discount to Cum Income NAV (debt at fair value):                              4.7%

Net yield2:                                                                   2.2%

Gross assets3:                                                             GBP847.4m

Gearing range as a % of net assets:                                          0-15%

Net gearing including income (debt at par):                                   5.8%

2019 Ongoing charges ratio4:                                                  0.7%

Ordinary shares in issue5:                                              48,829,792

 1. includes net revenue of 23.98p.

 2. Yield calculations are based on dividends announced in the last 12 months
    as at the date of release of this announcement, and comprise of the final
    dividend of 19.20 pence per share, (announced on 03 May 2019, ex-dividend
    on 16 May 2019) and the interim dividend of 12.8 pence per share (announced
    on 5 November 2019, ex-dividend on 14 November 2019).

 3. includes current year revenue.

 4. As reported in the Annual Financial Report for the year ended 28 February
    2019 the Ongoing Charges Ratio (OCR) was 0.7%. The OCR is calculated as a
    percentage of net assets and using operating expenses, excluding
    performance fees, finance costs and taxation.

 5. excludes 1,163,731 shares held in treasury.

Sector Weightings                                                   % of portfolio

Industrials                                                                   32.7

Financials                                                                    21.6

Consumer Services                                                             17.9

Consumer Goods                                                                10.5

Technology                                                                     5.9

Health Care                                                                    5.7

Basic Materials                                                                3.4

Oil & Gas                                                                      1.6

Telecommunications                                                             0.7

                                                                             -----

Total                                                                        100.0

                                                                             =====


Ten Largest Equity Investments

Company                                                             % of portfolio

IntegraFin                                                                     2.6

YouGov                                                                         2.4

4imprint Group                                                                 2.2

Avon Rubber                                                                    2.2

IG Design Group                                                                2.0

Johnson Service Group                                                          1.7

Watches of Switzerland                                                         1.7

Breedon                                                                        1.6

Team 17                                                                        1.5

Impax Asset Management                                                         1.4

Commenting on the markets, Roland Arnold, representing the Investment Manager
noted:


During February the Company's NAV per share fell by -9.9%1 to 1,548.55p, whilst
our benchmark index, Numis ex Inv Companies + AIM Index, fell by -9.7%1; the
FTSE 100 Index also fell by -9.7%1 on a capital only basis (all calculations
are on a capital only basis).

Markets globally fell significantly in February as the coronavirus outbreak and
its spread beyond China, into Europe and the US, caused mounting concerns over
the impact on the global economy. Oil & Gas and Basic Materials led the market
lower; however the sell-off was broad based across most industries with very
little dispersion, which resulted in the Company marginally underperforming our
benchmark.

Two of the largest detractors during the month included marketer of promotional
products, 4imprint and country clothing retailer, Joules, both impacted by
investors' concerns around the impact caused by coronavirus. Both businesses
have subsequently issued negative updates during March, which is unsurprising
given the likely impact of coronavirus.  However, we feel that the short-term
share price reaction fails to appreciate the long-term prospects for these two
businesses which have market leading positions, are well capitalised and
operated by strong management teams. Liontrust Asset Management was another
notable detractor during the month. The shares were not impacted by stock
specific newsflow; however the business is exposed to the performance of
financial markets and the shares were therefore impacted by the significant
market falls during the month.

On the positive side the portfolio benefitted from our holding in Avon Rubber
and YouGov, which both continued to rise following positive trading updates
issued in January. IntegraFin, the operator of the Transact investment
platform, outperformed the falling market as the business has continued to
generate strong inflows, and Mattioli Woods reported strong first-half profits,
as it boosted sales and improved its margins following an operational
restructure.

As shareholders will be aware, the recent coronavirus outbreak and its spread
beyond China, into Europe and the US, has caused mounting concerns over the
impact on global growth, and this has caused a significant market sell-off.
Recent falls (after month end) have been savage and indiscriminate, with share
prices completely detached from fundamentals and extreme levels of intraday
volatility. Essentially these are unprecedented times. We certainly don't have
the answers on the scope, scale and effect of the virus, or implications at
this stage, therefore we have not materially changed positioning. However, our
focus on financially strong businesses and avoiding companies that are overly
indebted provides us with confidence in the holdings in our portfolio. The
impact of coronavirus is unpredictable, unavoidable and unprecedented. But it
will get better, and recent volatility/market falls presents us with a
fantastic investment opportunity. The Company's investment strategy is focused
on quality growth investment opportunities in smaller companies, a style that
has demonstrably worked for the long-term, and historically periods of sudden
underperformance, such as this, have proven to be excellent investment
opportunities. We thank shareholders for their ongoing support.


1Source: BlackRock as at 29 February 2020

30 March 2020

ENDS


Latest information is available by typing www.blackrock.co.uk/brsc on the
internet, "BLRKINDEX" on Reuters, "BLRK" on Bloomberg or "8800" on Topic 3 (ICV
terminal).  Neither the contents of the Manager's website nor the contents of
any website accessible from hyperlinks on the Manager's website (or any other
website) is incorporated into, or forms part of, this announcement.


END
(END) Dow Jones Newswires
March 30, 2020 11:26 ET (15:26 GMT)
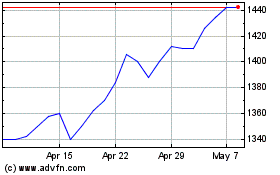
Blackrock Smaller (LSE:BRSC)
Historical Stock Chart
From Mar 2024 to Apr 2024

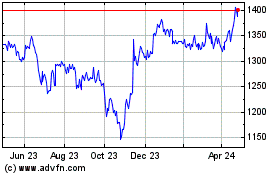
Blackrock Smaller (LSE:BRSC)
Historical Stock Chart
From Apr 2023 to Apr 2024
