BlackRock Greater Europe Investment Trust Plc - Portfolio Update
January 16 2020 - 9:26AM
PR Newswire (US)
BLACKROCK GREATER EUROPE
INVESTMENT TRUST plc (LEI - 5493003R8FJ6I76ZUW55)
All information is at 31 December
2019 and unaudited.
Performance at month end with net income reinvested
|
One
Month |
Three
Months |
One
Year |
Three
Years |
Launch
(20 Sep 04) |
| Net asset value
(undiluted) |
0.0% |
4.4% |
30.1% |
46.9% |
445.8% |
| Net asset value*
(diluted) |
-0.4% |
4.1% |
29.6% |
46.4% |
444.5% |
| Share price |
2.8% |
7.4% |
34.7% |
53.1% |
443.6% |
| FTSE World Europe ex
UK |
1.1% |
0.9% |
20.4% |
28.2% |
275.7% |
* Diluted for treasury shares and subscription shares.
Sources: BlackRock and Datastream
At month end
| Net asset value
(capital only): |
412.69p |
| Net asset value
(including income): |
412.76p |
| Net asset value
(capital only)1: |
411.35p |
| Net asset value
(including income)1: |
411.40p |
| Share price: |
407.00p |
| Discount to NAV
(including income): |
1.4% |
| Discount to NAV
(including income)1: |
1.4% |
| Net gearing: |
7.0% |
| Net
yield2: |
1.4% |
| Total assets
(including income): |
£348.0m |
| Ordinary shares in
issue3: |
84,323,101 |
| Ongoing
charges4: |
1.09% |
1 Diluted for treasury shares.
2 Based on a final dividend of 4.10p per share and an interim
dividend of 1.75p per share for the year ended 31 August 2019.
3 Excluding 26,005,837 shares held in treasury.
4 Calculated as a percentage of average net assets and using
expenses, excluding interest costs, after relief for taxation, for
the year ended 31 August 2019.
| Sector
Analysis |
Total
Assets
(%) |
|
Country
Analysis |
Total
Assets
(%) |
| Industrials |
21.8 |
|
Switzerland |
16.3 |
| Health Care |
18.9 |
|
Denmark |
16.1 |
| Technology |
17.9 |
|
France |
13.7 |
| Consumer Goods |
15.6 |
|
Germany |
13.7 |
| Financials |
9.6 |
|
Italy |
7.3 |
| Consumer Services |
8.7 |
|
Netherlands |
7.0 |
| Basic Materials |
3.2 |
|
Sweden |
5.3 |
|
Telecommunications |
3.2 |
|
Spain |
4.9 |
| Oil & Gas |
1.5 |
|
United Kingdom |
4.6 |
| Net Current
Liabilities |
-0.4 |
|
Israel |
2.5 |
|
----- |
|
Ireland |
1.8 |
|
100.0 |
|
Poland |
1.8 |
|
===== |
|
Belgium |
1.6 |
|
|
|
Finland |
1.4 |
|
|
|
Russia |
1.4 |
|
|
|
Greece |
1.0 |
|
|
|
Net Current
Liabilities |
-0.4 |
|
|
|
|
----- |
|
|
|
|
100.0 |
|
|
|
|
===== |
|
|
|
|
|
| Ten Largest Equity
Investments |
|
|
| Company |
Country |
%
of
Total Assets |
| SAP |
Germany |
6.3 |
| Sika |
Switzerland |
5.6 |
| Adidas |
Germany |
5.4 |
| Safran |
France |
5.4 |
| Novo Nordisk |
Denmark |
5.3 |
| Royal Unibrew |
Denmark |
5.2 |
| DSV |
Denmark |
4.6 |
| RELX |
United Kingdom |
4.6 |
| ASML |
Netherlands |
4.6 |
| Lonza Group |
Switzerland |
4.1 |
|
|
|
|
Commenting on the markets, Stefan Gries, representing the
Investment Manager noted: |
|
During the month, the Company’s NAV was flat and the share
price rose by 2.8%. For reference, the FTSE World Europe ex UK
Index returned 1.1% during the period.
European ex UK markets continued their rally through December,
ending the year up 20.4% (GBP). Through December, sector leadership
came from consumer services, financials and oil & gas sectors,
whilst telecommunications significantly lagged.
The Company underperformed the reference index over the month with
stock selection weighing on returns. On a sector basis, the primary
relative losses came from the portfolio’s underweight position in
financials. We saw a recovery in European banks based on the hope
of regulatory changes easing future capital requirements and a
small move higher in short-term interest rates. This, however, did
not change our fundamentally negative view on the sector and we
continue to hold our underweight position.
The primary detractor from performance over the month was our
holding in Safran, which had posted strong returns throughout the
rest of 2019. Shares fell in response to Boeing announcing a
temporary suspension to production of its 737 Max programme. Safran
had based its expectations for 2020 on a run rate of around 42
plane deliveries a month for this plane, which will now have to be
reviewed. Whilst this leads to minor cuts in both earnings and
cashflow in the near term, we believe that those cash-flows are
merely delayed rather than lost and it does not alter our overall
positive view of the earnings potential of Safran’s new leap engine
programme.
Shares in Diasorin also fell in response to competitor Qiagen
pulling out of a potential deal as they believe keeping their
independence will create more value for shareholders over the long
run. Shares in Qiagen de-rated 20%, having risen a similar amount
in preceding months, moving the rest of the sector lower with
it.
The Company benefited from not owning any telecoms stocks. Avoiding
names like Orange, Deutsche Telekom and Telefonica was additive to
returns. The sector was dragged down by Orange’s capital markets
day early in the month which left investors disappointed. While
management shared limited information on the much-anticipated
towers spin-out, it decided to cut 2020 EBITDA guidance and
increased capex intentions.
Semiconductor stocks continued to perform strongly with ASML a top
contributor to returns. Within the same sector, shares in SAP gave
up some performance as US peer Oracle slightly missed expectations.
We believe that SAP is on a different path to peers as our latest
channel checks would suggest the S4/Hana product upgrade cycle
remains strong.
At the end of the period the Company had a higher allocation than
the reference index towards technology, industrials, consumer
services and health care. The Company had a neutral weighting
towards telecommunications and a lower allocation was held in
financials, consumer goods, utilities, basic materials and oil
& gas.
Outlook
Despite the challenging conditions which continue to plague
industrial end markets in Europe, there are reasons emerging to be
more hopeful. We have seen stabilisation in certain end markets
which should be further supported by policy, both monetary and, in
some select instances, fiscal. The strong fiscal position of the
region, aided by lower yields, has the potential to make a
meaningful difference and is complimented by a resilient consumer
boasting some of the highest savings ratios in the developed world.
Along with extreme consensus underweight positioning to the region,
pillars of an investment case for Europe are building, leading to
recommendation upgrades from sell-side commentators. We agree
fiscal policy and falling political uncertainty could both give a
boost to the region, but caution buying specific exposures based on
macro narratives alone. Europe continues to have areas of the
market which appear to be value traps with whole sectors suffering
from falling profitability and management teams with limited
ability to turn the tide. We believe selectivity in the region and
a focus on long-term winners underpinned by superior fundamentals
could be meaningful for the overall return achieved from the
region. We continue to hold a preference for well-positioned luxury
goods and aerospace companies and avoid cyclically and structurally
challenged areas such as autos and banks.
16 January 2020
ENDS |
| Latest
information is available by typing www.brgeplc.co.uk on the
internet, "BLRKINDEX" on Reuters, "BLRK" on Bloomberg or "8800" on
Topic 3 (ICV terminal). Neither the contents of the Manager’s
website nor the contents of any website accessible from hyperlinks
on the Manager’s website (or any other website) is incorporated
into, or forms part of, this announcement. |

Copyright y 16 PR Newswire
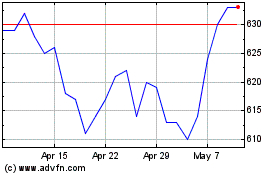
Blackrock Greater Europe... (LSE:BRGE)
Historical Stock Chart
From Mar 2024 to Apr 2024

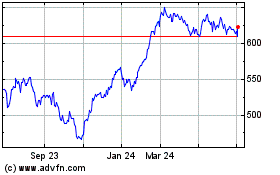
Blackrock Greater Europe... (LSE:BRGE)
Historical Stock Chart
From Apr 2023 to Apr 2024
