AT&T Down Nearly 7%, on Pace for Lowest Close Since August 2010 -- Data Talk
March 23 2020 - 1:01PM
Dow Jones News
AT&T Inc. (T) is currently at $26.48, down $1.97 or
6.92%
-- Would be lowest close since Aug. 20, 2010, when it closed at
$26.45
-- Earlier Monday, Cowen downgraded AT&T to market perform
and warned the company might not meet its 3-year earnings plan. The
investment bank warns AT&T's complexity and many risks make it
"unlikely to beat the market either on a continued selloff or
eventual recovery" amid the coronavirus outbreak, partly because
its film and TV assets make it more vulnerable than purer telecom
peers like Verizon
-- Baird also downgraded AT&T, lowering its rating to
neutral from outperform, and cutting its price target to
$33.00/share from $41.00/share, Benzinga reported.
-- Currently down five of the past six days
-- Currently down four consecutive days; down 21.52% over this
period
-- Longest losing streak since Feb. 28, 2020, when it fell for
six straight trading days
-- Worst four day stretch on record (Based on available data
back to Nov. 21, 1983)
-- Down 24.82% month-to-date; on pace for worst month on record
(Based on available data back to Nov. 21, 1983)
-- Down 32.24% year-to-date
-- Down 55.26% from its all-time closing high of $59.19 on July
16, 1999
-- Would be a new 52-week closing low
-- Traded as low as $26.08; lowest intraday level since July 30,
2010, when it hit $25.79
-- Down 8.33% at today's intraday low
-- Fourth most active stock in the S&P 500 today
All data as of 12:19:11 PM
Source: Dow Jones Market Data, FactSet
(END) Dow Jones Newswires
March 23, 2020 12:46 ET (16:46 GMT)
Copyright (c) 2020 Dow Jones & Company, Inc.
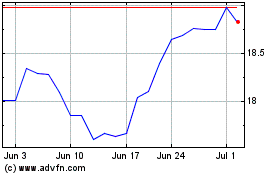
AT&T (NYSE:T)
Historical Stock Chart
From Mar 2024 to Apr 2024

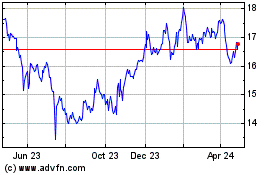
AT&T (NYSE:T)
Historical Stock Chart
From Apr 2023 to Apr 2024
