 Penny Roger$
12 years ago
Penny Roger$
12 years ago
~ $ST ~Multi chart fix and On the house shots of DD!! Version 3.2.3
~ Barchart: http://barchart.com/quotes/stocks/ST?
~ OTC Markets: http://www.otcmarkets.com/stock/ST/company-info
~ Google Finance: http://www.google.com/finance?q=ST
~ Google Fin Options: hhttp://www.google.com/finance/option_chain?q=ST#
~ Yahoo! Finance ~ Stats: http://finance.yahoo.com/q/ks?s=ST+Key+Statistics
~ Yahoo! Finance ~ Profile: http://finance.yahoo.com/q/pr?s=ST
Finviz: http://finviz.com/quote.ashx?t=ST
~ BusyStock: http://busystock.com/i.php?s=ST&v=2
~ CandlestickChart: http://www.candlestickchart.com/cgi/chart.cgi?symbol=ST&exchange=US
~ Investorshub Trades: http://ih.advfn.com/p.php?pid=trades&symbol=ST
~ Investorshub Board Search: http://investorshub.advfn.com/boards/getboards.aspx?searchstr=ST
~ Investorshub PostStream Search: http://investorshub.advfn.com/boards/poststream.aspx?ticker=ST
~ Investorshub Goodies Search: http://investorshub.advfn.com/boards/msgsearchbyboard.aspx?boardID=23408&srchyr=2011&SearchStr=ST
~ Investorshub Message Search: http://investorshub.advfn.com/boards/msgsearch.aspx?SearchStr=ST
~ MarketWatch: http://www.marketwatch.com/investing/stock/ST/profile
~ E-Zone Chart: http://www.windchart.com/ezone/signals/?symbol=ST
~ 5-Min Wind: http://www.windchart.com/stockta/analysis?symbol=ST
~ 10-Min Wind: http://www.windchart.com/stockta/analysis?symbol=ST&size=l&frequency=10&color=g
~ 30-Min Wind: http://www.windchart.com/stockta/analysis?symbol=ST&size=l&frequency=30&color=g
~ 60-Min Wind: http://www.windchart.com/stockta/analysis?symbol=ST&size=l&frequency=60&color=g
DTCC (PENSON/TDA) Check - (otc and pinks) - Note ~ I did not check for this chart blast. However, I try and help you to do so with the following links.
IHUB DTCC BOARD SEARCH #1 http://investorshub.advfn.com/boards/msgsearchbyboard.aspx?boardID=18682&srchyr=2011&SearchStr=ST
IHUB DTCC BOARD SEARCH #2: http://investorshub.advfn.com/boards/msgsearchbyboard.aspx?boardID=14482&srchyr=2011&SearchStr=ST
Check those searches for recent ST mentions. If ST is showing up on older posts and not on new posts found in link below, The DTCC issues may have been addressed and fixed. Always call the broker if your security turns up on any DTCC/PENSON list.
http://investorshub.advfn.com/boards/msgsearchbyboard.aspx?boardID=18682&srchyr=2011&SearchStr=Complete+list
For a cSTnt list see the pinned threads at the top here ---> http://tinyurl.com/TWO-OLD-FARTS
Volume, MACD, ADX 3 EMA Par sar - http://bigcharts.marketwatch.com/advchart/frames/frames.asp?show=True&insttype=Stock&symb=ST&time=8&startdate=1%2F4%2F1999&enddate=11%2F21%2F2011&freq=2&compidx=aaaaa%3A0&comptemptext=&comp=none&ma=6&maval=9&uf=16&lf=1&lf2=4&lf3=1024&type=4&style=380&size=2&timeFrameToggle=false&compareToToggle=false&indicatorsToggle=false&chartStyleToggle=false&state=11&x=25&y=5
RSI, Money Flow, Volume Accumulation, 3sma, Bollinger bands - http://bigcharts.marketwatch.com/advchart/frames/frames.asp?show=True&insttype=Stock&symb=ST&time=8&startdate=1%2F4%2F1999&enddate=11%2F21%2F2011&freq=2&compidx=aaaaa%3A0&comptemptext=&comp=none&ma=4&maval=9&uf=8&lf=2&lf2=512&lf3=4096&type=4&style=380&size=2&timeFrameToggle=false&compareToToggle=false&indicatorsToggle=false&chartStyleToggle=false&state=11&x=36&y=14
Price Channel, Momentum, Volatility Slow, P/E Ratio - http://bigcharts.marketwatch.com/advchart/frames/frames.asp?show=True&insttype=Stock&symb=ST&time=8&startdate=1%2F4%2F1999&enddate=11%2F21%2F2011&freq=2&compidx=aaaaa%3A0&comptemptext=&comp=none&ma=6&maval=9&uf=128&lf=65536&lf2=16384&lf3=16777216&type=4&style=380&size=2&timeFrameToggle=false&compareToToggle=false&indicatorsToggle=false&chartStyleToggle=false&state=11&x=28&y=15
Volume, MACD, ADX 3 EMA Par sar - http://bigcharts.marketwatch.com/advchart/frames/frames.asp?show=True&insttype=Stock&symb=ST&time=6&startdate=1%2F4%2F1999&enddate=11%2F21%2F2011&freq=1&compidx=aaaaa%3A0&comptemptext=&comp=none&ma=6&maval=9&uf=16&lf=1&lf2=4&lf3=1024&type=4&style=380&size=2&timeFrameToggle=false&compareToToggle=false&indicatorsToggle=false&chartStyleToggle=false&state=11&x=39&y=17
RSI, Money Flow, Volume Accumulation, 3sma, Bollinger bands - http://bigcharts.marketwatch.com/advchart/frames/frames.asp?show=True&insttype=Stock&symb=ST&time=6&startdate=1%2F4%2F1999&enddate=11%2F21%2F2011&freq=1&compidx=aaaaa%3A0&comptemptext=&comp=none&ma=4&maval=9&uf=8&lf=2&lf2=512&lf3=4096&type=4&style=380&size=2&timeFrameToggle=false&compareToToggle=false&indicatorsToggle=false&chartStyleToggle=false&state=11&x=35&y=12
Price Channel, Momentum, Volatility Slow, P/E Ratio - http://bigcharts.marketwatch.com/advchart/frames/frames.asp?show=True&insttype=Stock&symb=ST&time=6&startdate=1%2F4%2F1999&enddate=11%2F21%2F2011&freq=1&compidx=aaaaa%3A0&comptemptext=&comp=none&ma=6&maval=9&uf=128&lf=65536&lf2=16384&lf3=16777216&type=4&style=380&size=2&timeFrameToggle=false&compareToToggle=false&indicatorsToggle=false&chartStyleToggle=false&state=11&x=23&y=19
Volume, MACD, ADX 3 EMA Par sar - http://bigcharts.marketwatch.com/advchart/frames/frames.asp?show=True&insttype=Stock&symb=ST&time=18&startdate=1%2F4%2F1999&enddate=11%2F21%2F2011&freq=8&compidx=aaaaa%3A0&comptemptext=&comp=none&ma=6&maval=9&uf=16&lf=1&lf2=4&lf3=1024&type=4&style=380&size=2&timeFrameToggle=false&compareToToggle=false&indicatorsToggle=false&chartStyleToggle=false&state=11&x=38&y=6
RSI, Money Flow, Volume Accumulation, 3sma, Bollinger bands - http://bigcharts.marketwatch.com/advchart/frames/frames.asp?show=True&insttype=Stock&symb=ST&time=18&startdate=1%2F4%2F1999&enddate=11%2F21%2F2011&freq=8&compidx=aaaaa%3A0&comptemptext=&comp=none&ma=4&maval=9&uf=8&lf=2&lf2=512&lf3=4096&type=4&style=380&size=2&timeFrameToggle=false&compareToToggle=false&indicatorsToggle=false&chartStyleToggle=false&state=11&x=30&y=11
Price Channel, Momentum, Volatility Slow, P/E Ratio - http://bigcharts.marketwatch.com/advchart/frames/frames.asp?show=True&insttype=&symb=ST&time=18&startdate=1%2F4%2F1999&enddate=11%2F21%2F2011&freq=8&compidx=aaaaa%3A0&comptemptext=&comp=none&ma=6&maval=9&uf=128&lf=65536&lf2=16384&lf3=16777216&type=4&style=380&size=2&timeFrameToggle=false&compareToToggle=false&indicatorsToggle=false&chartStyleToggle=false&state=11&x=35&y=14
Volume, MACD, ADX 3 EMA Par sar - http://bigcharts.marketwatch.com/advchart/frames/frames.asp?show=True&insttype=Stock&symb=ST&time=3&startdate=1%2F4%2F1999&enddate=11%2F21%2F2011&freq=7&compidx=aaaaa%3A0&comptemptext=&comp=none&ma=6&maval=9&uf=16&lf=1&lf2=4&lf3=1024&type=4&style=380&size=2&timeFrameToggle=false&compareToToggle=false&indicatorsToggle=false&chartStyleToggle=false&state=11&x=39&y=14
RSI, Money Flow, Volume Accumulation, 3sma, Bollinger bands - http://bigcharts.marketwatch.com/advchart/frames/frames.asp?show=True&insttype=Stock&symb=ST&time=3&startdate=1%2F4%2F1999&enddate=11%2F21%2F2011&freq=7&compidx=aaaaa%3A0&comptemptext=&comp=none&ma=4&maval=9&uf=8&lf=2&lf2=512&lf3=4096&type=4&style=380&size=2&timeFrameToggle=false&compareToToggle=false&indicatorsToggle=false&chartStyleToggle=false&state=11&x=20&y=16
Price Channel, Momentum, Volatility Slow, P/E Ratio - http://bigcharts.marketwatch.com/advchart/frames/frames.asp?show=True&insttype=Stock&symb=ST&time=3&startdate=1%2F4%2F1999&enddate=11%2F21%2F2011&freq=7&compidx=aaaaa%3A0&comptemptext=&comp=none&ma=6&maval=9&uf=128&lf=65536&lf2=16384&lf3=16777216&type=4&style=380&size=2&timeFrameToggle=false&compareToToggle=false&indicatorsToggle=false&chartStyleToggle=false&state=11&x=46&y=6
Volume, MACD, ADX 3 EMA Par sar - http://bigcharts.marketwatch.com/advchart/frames/frames.asp?show=True&insttype=Stock&symb=ST&time=1&startdate=1%2F4%2F1999&enddate=11%2F21%2F2011&freq=6&compidx=aaaaa%3A0&comptemptext=&comp=none&ma=6&maval=9&uf=16&lf=1&lf2=4&lf3=1024&type=4&style=380&size=2&timeFrameToggle=false&compareToToggle=false&indicatorsToggle=false&chartStyleToggle=false&state=11&x=42&y=20
RSI, Money Flow, Volume Accumulation, 3sma, Bollinger bands - http://bigcharts.marketwatch.com/advchart/frames/frames.asp?show=True&insttype=Stock&symb=ST&time=1&startdate=1%2F4%2F1999&enddate=11%2F21%2F2011&freq=6&compidx=aaaaa%3A0&comptemptext=&comp=none&ma=4&maval=9&uf=8&lf=2&lf2=512&lf3=4096&type=4&style=380&size=2&timeFrameToggle=false&compareToToggle=false&indicatorsToggle=false&chartStyleToggle=false&state=11&x=36&y=11
Price Channel, Momentum, Volatility Slow, P/E Ratio - http://bigcharts.marketwatch.com/advchart/frames/frames.asp?show=True&insttype=Stock&symb=ST&time=1&startdate=1%2F4%2F1999&enddate=11%2F21%2F2011&freq=6&compidx=aaaaa%3A0&comptemptext=&comp=none&ma=6&maval=9&uf=128&lf=65536&lf2=16384&lf3=16777216&type=4&style=380&size=2&timeFrameToggle=false&compareToToggle=false&indicatorsToggle=false&chartStyleToggle=false&state=11&x=46&y=11
Volume, MACD, ADX 3 EMA Par sar - http://bigcharts.marketwatch.com/advchart/frames/frames.asp?show=True&insttype=Stock&symb=ST&time=1&startdate=1%2F4%2F1999&enddate=11%2F21%2F2011&freq=9&compidx=aaaaa%3A0&comptemptext=&comp=none&ma=6&maval=9&uf=16&lf=1&lf2=4&lf3=1024&type=4&style=380&size=2&timeFrameToggle=false&compareToToggle=false&indicatorsToggle=false&chartStyleToggle=false&state=11&x=31&y=14
RSI, Money Flow, Volume Accumulation, 3sma, Bollinger bands - http://bigcharts.marketwatch.com/advchart/frames/frames.asp?show=True&insttype=Stock&symb=ST&time=1&startdate=1%2F4%2F1999&enddate=11%2F21%2F2011&freq=9&compidx=aaaaa%3A0&comptemptext=&comp=none&ma=4&maval=9&uf=8&lf=2&lf2=512&lf3=4096&type=4&style=380&size=2&timeFrameToggle=false&compareToToggle=false&indicatorsToggle=false&chartStyleToggle=false&state=11&x=23&y=15
Price Channel, Momentum, Volatility Slow, P/E Ratio - http://bigcharts.marketwatch.com/advchart/frames/frames.asp?show=True&insttype=Stock&symb=ST&time=1&startdate=1%2F4%2F1999&enddate=11%2F21%2F2011&freq=9&compidx=aaaaa%3A0&comptemptext=&comp=none&ma=6&maval=9&uf=128&lf=65536&lf2=16384&lf3=16777216&type=4&style=380&size=2&timeFrameToggle=false&compareToToggle=false&indicatorsToggle=false&chartStyleToggle=false&state=11&x=22&y=15
---------------------
---------------------
* If a symbol changes or adds a D, etc. Message me for an updated version.
Twitter: @MACDgyver ---> ST <---
Penny Roger$
12 years ago
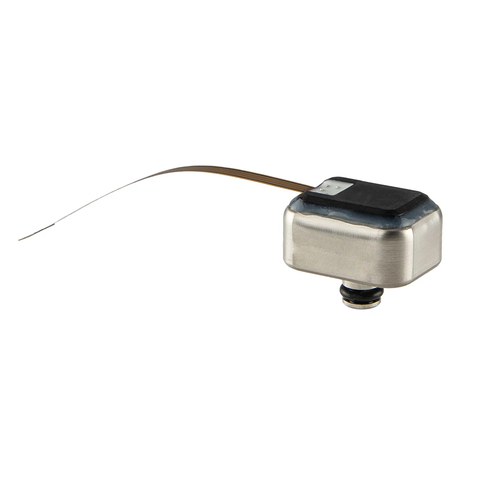
Sensata Technologies Holding N.V. (Sensata Technologies Holding) is subsidiary of Sensata Investment Company S.C.A. (SCA). SCA is 100% owned by entities associated with Bain Capital Partners, LLC (Bain Capital), a global private investment firm. The Company is engaged in the development, manufacture and sale of sensors and controls. It produces a range of sensors and controls for mission-critical applications, such as thermal circuit breakers in aircraft, pressure sensors in automotive systems, and bimetal current and temperature control devices in electric motors. The Company operates in two segments: sensors business and controls business. Its products include pressure sensors, force sensors, position sensors, motor protectors, and thermal and magnetic-hydraulic circuit breakers and switches. On January 28, 2011, the Company completed the acquisition of the Automotive on Board business of Honeywell International Inc.
http://www.google.com/finance?q=ST#


 Hot Features