PG&E Down Over 30% After Judge's Ruling -- Data Talk
October 10 2019 - 11:22AM
Dow Jones News
PG&E Corporation (PCG) is currently at $7.68, down $3.30 or
30.08%
-- Would be lowest close since Jan. 18, 2019, when it closed at
$7.23
-- On pace for largest percent decrease since Jan. 14, 2019,
when it fell 52.36%
-- On Wednesday, PG&E cut power to about 700,000 households
and businesses in northern and central California in a move of
unprecedented scale meant to avert the type of deadly infernos that
killed dozens last year and propelled it into bankruptcy court.
-- Judge Dennis Montali of the U.S. Bankruptcy Court in San
Francisco cleared the way for a rival chapter 11 plan from Elliott
and other bondholders that are allied with victims of wildfires
that drove PG&E to bankruptcy
-- Currently down two of the past three days
-- Down 23.23% month-to-date
-- Down 67.68% year-to-date; on pace for worst year on record
(Based on available data back to Jan. 21, 1972)
-- Down 89.27% from its all-time closing high of $71.56 on Sept.
11, 2017
-- Down 83.53% from 52-weeks ago (Oct. 11, 2018), when it closed
at $46.62
-- Traded as low as $7.51; lowest intraday level since Jan. 24,
2019, when it hit $7.30
-- Down 31.6% at today's intraday low; largest intraday percent
decrease since Jan. 15, 2019, when it fell as much as 39.5%
All data as of 10:32:22 AM
Source: Dow Jones Market Data, FactSet
(END) Dow Jones Newswires
October 10, 2019 11:07 ET (15:07 GMT)
Copyright (c) 2019 Dow Jones & Company, Inc.
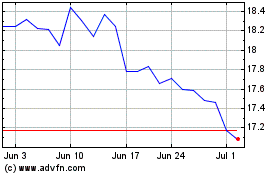
PG&E (NYSE:PCG)
Historical Stock Chart
From Mar 2024 to Apr 2024

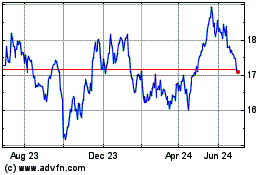
PG&E (NYSE:PCG)
Historical Stock Chart
From Apr 2023 to Apr 2024
