Occidental Petroleum Up Over 6%, on Pace for Largest Percent Increase Since November 2011 -- Data Talk
September 16 2019 - 12:15PM
Dow Jones News
Occidental Petroleum Corporation (OXY) is currently at $47.93,
up $2.84 or 6.3%
-- Would be highest close since Aug. 5, 2019, when it closed at
$49.42
-- On pace for largest percent increase since Nov. 30, 2011,
when it rose 7.28%
-- Oil and gas stocks are surging alongside crude-oil prices
after a major attack on Saudi Arabia oil infrastructure that's
spurring concerns over global supplies
-- Snaps a three day losing streak
-- Up 10.23% month-to-date
-- Up 13.77% from its 52-week closing low of $42.13 on Aug. 26,
2019
-- Traded as high as $48.85; highest intraday level since Aug.
6, 2019, when it hit $49.63
-- Up 8.34% at today's intraday high; largest intraday percent
increase since Oct. 27, 2011, when it rose as much as 11.48%
-- 10th best performer in the S&P 500 today
-- Eighth most active stock in the S&P 500 today
All data as of 11:38:42 AM
Source: Dow Jones Market Data, FactSet
(END) Dow Jones Newswires
September 16, 2019 12:00 ET (16:00 GMT)
Copyright (c) 2019 Dow Jones & Company, Inc.
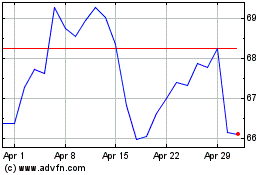
Occidental Petroleum (NYSE:OXY)
Historical Stock Chart
From Mar 2024 to Apr 2024

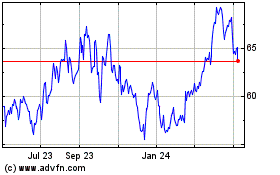
Occidental Petroleum (NYSE:OXY)
Historical Stock Chart
From Apr 2023 to Apr 2024
