INVESTOR ALERT: Kirby McInerney LLP Announces an Investigation of Shareholder Claims Against Sunnova Energy International Inc.
September 05 2019 - 9:00PM
Business Wire
The law firm of Kirby McInerney LLP is investigating potential
claims against Sunnova Energy International Inc. (“Sunnova” or the
“Company”) (NYSE: NOVA). This investigation concerns whether
Sunnova has violated federal securities laws and/or engaged in
other unlawful business practices.
In July 2019, Sunnova completed its initial public offering
(“IPO”) in which it sold more than 14 million shares of common
stock for $12 per share.
On August 19, 2019, Sunnova reported a net loss of $85.3 million
for the six months ended June 30, 2019, compared with $22.7 million
in the prior year period, due to net losses on interest rate swaps.
On this news, the Company’s share price fell $0.85 per share,
nearly 8%, to close at $10.36 per share on August 20, 2019, thereby
injuring investors. Since the IPO, Sunnova’s stock has traded as
low as $8.01 per share, or nearly 33% below its $12 IPO price.
If you acquired Sunnova securities, have information, or would
like to learn more about these claims, please contact Thomas W.
Elrod of Kirby McInerney LLP at 212-371-6600, by email at
investigations@kmllp.com, or by filling out this contact form, to
discuss your rights or interests with respect to these matters
without any cost to you.
Kirby McInerney LLP is a New York-based plaintiffs’ law firm
concentrating in securities, antitrust, and whistleblower
litigation. The firm’s efforts on behalf of shareholders in
securities litigation have resulted in recoveries totaling billions
of dollars. Additional information about the firm can be found at
Kirby McInerney LLP’s website: www.kmllp.com.
This press release may be considered Attorney Advertising in
some jurisdictions under the applicable law and ethical rules.
View source
version on businesswire.com: https://www.businesswire.com/news/home/20190905006033/en/
Kirby McInerney LLP Thomas W. Elrod, Esq., (212) 371-6600
investigations@kmllp.com www.kmllp.com
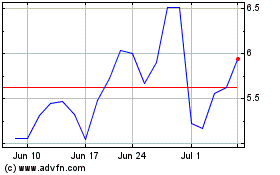
Sunnova Energy (NYSE:NOVA)
Historical Stock Chart
From Mar 2024 to Apr 2024

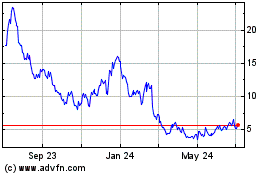
Sunnova Energy (NYSE:NOVA)
Historical Stock Chart
From Apr 2023 to Apr 2024
