JPMorgan Chase Down over 11%, on Pace for Largest Percent Decrease in Over 11 Years -- Data Talk
March 09 2020 - 12:58PM
Dow Jones News
JPMorgan Chase & Co. (JPM) is currently at $96.06, down
$12.02 or 11.12%
-- Would be lowest close since Dec. 26, 2018, when it closed at
$95.96
-- On pace for largest percent decrease since March 5, 2009,
when it fell 13.99%
-- Earlier Monday, Morgan Stanley cut its price target for
JPMorgan Chase to $133.00/share from $141.00/share, Benzinga
reported
-- Shares of banks that are the biggest lenders to the energy
sector fell sharply at the open Monday, before stocks were halted
after triggering trading limits, MarketWatch reported
-- Currently down four of the past five days
-- Currently down three consecutive days; down 19.85% over this
period
-- Worst three day stretch since the three days ending March 6,
2009, when it fell 24.18%
-- Down 17.27% month-to-date
-- Down 31.09% year-to-date
-- Would be a new 52-week closing low
-- Traded as low as $93.58; lowest intraday level since Dec. 27,
2018, when it hit $93.55
-- Down 13.42% at today's intraday low; largest intraday percent
decrease since Aug. 24, 2015, when it fell as much as 21.27%
-- Third worst performer in the DJIA today
-- Subtracted 81.5 points from the DJIA so far today
All data as of 12:18:23 PM
Source: Dow Jones Market Data, FactSet
(END) Dow Jones Newswires
March 09, 2020 12:43 ET (16:43 GMT)
Copyright (c) 2020 Dow Jones & Company, Inc.
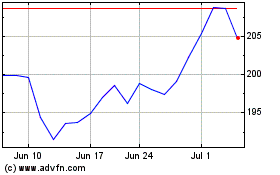
JP Morgan Chase (NYSE:JPM)
Historical Stock Chart
From Mar 2024 to Apr 2024

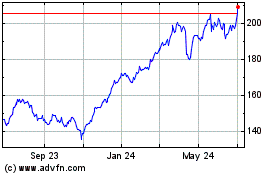
JP Morgan Chase (NYSE:JPM)
Historical Stock Chart
From Apr 2023 to Apr 2024
