Johnson & Johnson on Track for Record High Close -- Data Talk
April 23 2020 - 12:02PM
Dow Jones News
Johnson & Johnson (JNJ) is currently at $156.80, up $3.81 or
2.49%
-- Would be new all-time high (Based on available data back to
Jan. 21, 1972)
-- On pace to surpass the current record close of $153.99 set on
Feb. 5, 2020
-- Drugmakers are reconfiguring manufacturing plants and hiring
hundreds of new workers to be ready to make coronavirus drugs and
vaccines should they prove in testing to be effective in fighting
off the virus. Johnson & Johnson, Pfizer Inc. and other
companies are gearing up so they can make hundreds of millions of
doses of coronavirus pills and shots as quickly as possible if
studies support their worth
-- On pace for largest percent increase since April 14, 2020,
when it rose 4.48%
-- Currently up two consecutive days; up 4.76% over this
period
-- Best two day stretch since the two days ending April 15,
2020, when it rose 5.64%
-- Up 19.58% month-to-date; on pace for best month since Feb.
1975, when it rose 20.9%
-- Up 7.49% year-to-date
-- Up 12.28% from 52 weeks ago (April 25, 2019), when it closed
at $139.65
-- Would be a new 52-week closing high
-- Up 41.08% from its 52-week closing low of $111.14 on March
23, 2020
-- Traded as high as $157.00; new all-time intraday high (Based
on available data back to Jan. 21, 1972)
-- Up 2.62% at today's intraday high
-- Eighth best performer in the DJIA today
-- Contributed 25.83 points to the DJIA so far today
All data as of 11:24:01 AM
Source: Dow Jones Market Data, FactSet
(END) Dow Jones Newswires
April 23, 2020 11:47 ET (15:47 GMT)
Copyright (c) 2020 Dow Jones & Company, Inc.
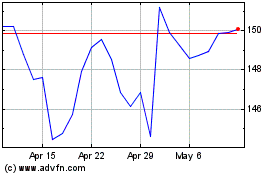
Johnson and Johnson (NYSE:JNJ)
Historical Stock Chart
From Mar 2024 to Apr 2024

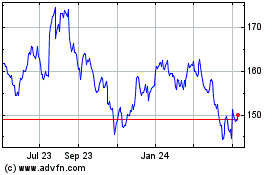
Johnson and Johnson (NYSE:JNJ)
Historical Stock Chart
From Apr 2023 to Apr 2024
