Transports Keep Flashing Warning Signals Even as Stocks Flirt With Records
September 19 2019 - 5:11PM
Dow Jones News
By Paul Vigna
FedEx Corp. has offered the latest signal that a turning point
is coming in the business cycle.
The delivery company cut its 2020 outlook after the closing bell
Tuesday, pointing to trade tensions and a weak global economy.
Chief Executive Frederick Smith said on the company's conference
call that FedEx is taking steps to reduce its capacity, partly
because the absence of a trade deal with China has reduced the
movement of goods internationally.
Investors often look at the transport sector as a bellwether of
the economy. Believers in the so-called Dow Theory say weakness in
shares of companies that transport raw goods and materials can
point to turmoil for the broader market.
Sectors including transportation and manufacturing have been
sending out signals for months that a turn in the business cycle is
near, leaving investors to question the longevity of the decadelong
bull market in U.S. stocks.
The problem is there isn't any easy demarcation between a
growing economy and a contracting one, no solstice or equinox that
marks the turn of the seasons. Divining when the economy has
slipped into a recession -- or, at least, doing it ahead of other
investors -- requires sifting and analyzing myriad tea leaves and
smoke signals.
Although the broader market is still flirting with records, the
transport sector has struggled to recover lost ground -- a
potentially ominous sign for investors who believe transports need
to rebound for the market to break higher.
The U.S. manufacturing sector, some argue, has already fallen
into recession. On Monday, the New York Fed's manufacturing index
slid to just 2, below its level from the beginning of the last
recession, which began in 2007.
The Dow Transportation Average -- which tracks 20 of the
nation's largest airlines, railroads and truckers, including FedEx
-- is still down 8.8% over the past year, though it has gained 15%
this year. FedEx itself has fallen 37% over the past 12 months,
including a 12% drop this week.
Additionally, an index of freight shipments maintained by the
research firm Cass Information Systems Inc. has been falling every
month this year. After the 3% drop in the August index, the firm
said "the shipments index has gone from warning of a potential
slowdown to signaling an economic contraction."
By any reckoning, this expansion is old. It began in June 2009,
making it the longest on record, and it shows some of the typical
signs of a late-stage expansion. That doesn't automatically mean
the expansion must end, though.
Even the National Bureau of Economic Research, the official
arbiter of the cycle, doesn't have a strict definition of it. While
the shorthand is two consecutive quarters of contracting GDP
growth, it isn't a concrete definition.
The business cycle can be read through economic data, but it is
really about human nature, said Nick Reece, an analyst and
portfolio manager at Merk Investments LLC. That is what makes it so
hard to pin down. "It's driven by greed and fear, emotions of
excessive pessimism and optimism."
The employment picture looks healthy, with the unemployment rate
and weekly jobless claims both low. But a better way to examine the
health of the workforce, Mr. Reece said, is to look at moving
averages rather than one month's numbers.
For example, he said, when the 12-month moving average of
jobless claims -- currently at 221,800 -- rises above the 24-month
moving average -- currently at 223,500 -- it is a sign that growth
in the labor force has peaked. Another sign is when the current
unemployment rate, 3.7%, moves above the 12-month moving average,
which sits just one-tenth of a percentage point higher, at
3.8%.
Those numbers haven't flipped, but they are close. Mr. Reece
thinks the economy will keep growing, but he puts the chances of a
recession arriving in the next six months at 30% to 40%.
"We've been in the eighth inning for a long time," he said.
To receive our Markets newsletter every morning in your inbox,
click here.
Write to Paul Vigna at paul.vigna@wsj.com
(END) Dow Jones Newswires
September 19, 2019 16:56 ET (20:56 GMT)
Copyright (c) 2019 Dow Jones & Company, Inc.
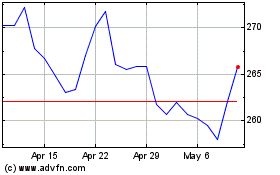
FedEx (NYSE:FDX)
Historical Stock Chart
From Mar 2024 to Apr 2024

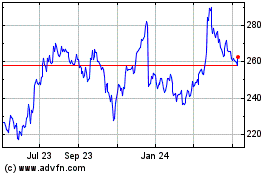
FedEx (NYSE:FDX)
Historical Stock Chart
From Apr 2023 to Apr 2024
