Citigroup Fourth-Quarter Profit Beats Expectations
January 14 2020 - 8:48AM
Dow Jones News
By David Benoit
Citigroup Inc. on Tuesday said fourth-quarter profit rose 15%
and beat expectations on a surge in its investment banking
operations.
The New York bank posted profit of $4.98 billion, or $2.15 per
share. That included a per-share $0.25 gain thanks to a tax boost.
Analysts had expected $1.81 per share, not including the tax gain,
according to FactSet. A year earlier, Citigroup had earned $4.31
billion, or $1.64 per share.
Revenue rose 7% to $18.38 billion from $17.12 billion a year
earlier. Analysts had expected $17.9 billion.
In the consumer bank, revenue rose 5% to $8.46 billion and
profit rose 12% to $1.58 billion. The corporate bank's revenue and
profit both rose 10%, to $9.38 billion and $2.88 billion,
respectively, bouncing back from a weak period a year ago.
The gains helped propel Citi above its promised profitability
targets, which analysts had widely expected it to miss.
The bank's return on tangible common equity, which measures the
profitability of its assets, was 12.1% for the full year.
Citigroup had targeted 12% for all of 2019 and the bank looked
on pace for that, "or darn close," Chief Financial Officer Mark
Mason told skeptical analysts in September.
Analysts will likely still seek an update on the 2020 promise to
hit 13.5%, but beating the 2019 target will provide a dose of
credibility to Chief Executive Michael Corbat's plans.
Mr. Corbat has said the bank is making important progress on
profits and that he wouldn't sacrifice investments in the business
to hit a few targets. He and Mr. Mason have warned the 2020 economy
isn't what they expected when they set the target.
Citigroup's stock rose more than 50% in 2019, outpacing rivals
in the KBW Nasdaq Bank Index and the broader market. Still, it
trades at lower valuations than peers, which analysts have blamed
on lower returns than the industry.
Shares rose in premarket trading Tuesday.
Write to David Benoit at david.benoit@wsj.com
(END) Dow Jones Newswires
January 14, 2020 08:33 ET (13:33 GMT)
Copyright (c) 2020 Dow Jones & Company, Inc.
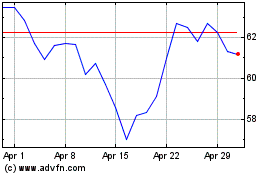
Citigroup (NYSE:C)
Historical Stock Chart
From Mar 2024 to Apr 2024

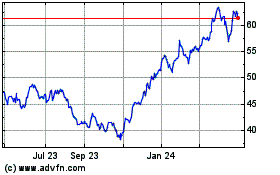
Citigroup (NYSE:C)
Historical Stock Chart
From Apr 2023 to Apr 2024
