Anheuser-Busch InBev On Pace for Record Percent Decrease -- Data Talk
October 25 2019 - 12:07PM
Dow Jones News
Anheuser-Busch InBev SA/NV Sponsored ADR (BUD) is currently at
$82.03, down $9.57 or 10.45%
-- Would be lowest close since May 31, 2019, when it closed at
$81.40
-- Would be largest percent decrease on record (Based on
available data back to July 1, 2009)
-- Earlier Friday, Anheuser-Busch InBev reported that
third-quarter organic revenue grew and came in at 2.7%, missing
analysts' estimates of 4.7%. Underlying profit dropped to $1.87
billion from $2.19 billion
-- The company expects "moderate" rather than "strong" growth in
earnings before interest, taxes, depreciation and amortization for
the full year
-- Currently down three of the past four days
-- Down 13.79% month-to-date; on pace for worst month since Dec.
2018, when it fell 14.39%
-- Up 24.65% year-to-date; on pace for best year since 2012,
when it rose 43.32%
-- Down 38.53% from its all-time closing high of $133.44 on
Sept. 28, 2016
-- Up 10.73% from 52 weeks ago (Oct. 26, 2018), when it closed
at $74.08
-- Traded as low as $81.96; lowest intraday level since June 3,
2019, when it hit $81.01
-- Down 10.52% at today's intraday low; largest intraday percent
decrease since Oct. 25, 2018, when it fell as much as 11.39%
All data as of 11:29:17 AM
Source: Dow Jones Market Data, FactSet
(END) Dow Jones Newswires
October 25, 2019 11:52 ET (15:52 GMT)
Copyright (c) 2019 Dow Jones & Company, Inc.
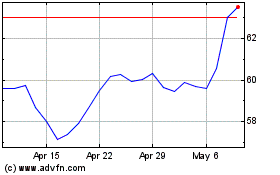
Anheuser Busch Inbev SA NV (NYSE:BUD)
Historical Stock Chart
From Mar 2024 to Apr 2024

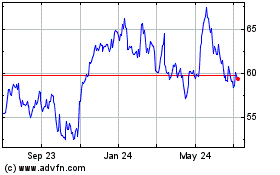
Anheuser Busch Inbev SA NV (NYSE:BUD)
Historical Stock Chart
From Apr 2023 to Apr 2024
