Manhattan Bridge Capital, Inc. Reports First Quarter 2022 Results
April 14 2022 - 7:05AM

Manhattan Bridge Capital, Inc. (NASDAQ: LOAN) announced today that
net income for the three months ended March 31, 2022 was
approximately $1,425,000, or $0.12 per basic and diluted share
(based on approximately 11.5 million weighted-average outstanding
common shares), versus approximately $1,106,000, or $0.12 per basic
and diluted share (based on approximately 9.6 million
weighted-average outstanding common shares) for the three months
ended March 31, 2021, an increase of $319,000, or 28.8%. This
increase is primarily attributable to an increase in revenue,
partially offset by an increase in general and administrative
expenses.
Total revenue for the three months ended March
31, 2022 was approximately $2,115,000 compared to approximately
$1,729,000 for the three months ended March 31, 2021, an increase
of $386,000, or 22.3%. The increase in revenue was due to an
increase in lending operations. For the three months ended March
31, 2022, approximately $1,644,000 of the Company’s revenue
represents interest income on secured commercial loans that it
offers to small businesses, compared to approximately $1,443,000
for the same period in 2021, and approximately $471,000 and
$286,000, respectively, represent origination fees on such loans.
The loans are principally secured by collateral consisting of real
estate and accompanied by personal guarantees from the principals
of the borrowers.
As of March 31, 2022, total shareholders' equity
was approximately $43,377,000.
Assaf Ran, Chairman of the Board and CEO,
stated, “The first quarter financial results represent the impact
of the additional funds we raised in the equity offering last
summer. Despite the relatively lower interest rates that we are
currently charging due to market conditions, our quarterly revenue
and net earnings were near our all-time high.”
About Manhattan Bridge Capital,
Inc.
Manhattan Bridge Capital, Inc. offers short-term
secured, non–banking loans (sometimes referred to as ‘‘hard money’’
loans) to real estate investors to fund their acquisition,
renovation, rehabilitation or improvement of properties located in
the New York metropolitan area, including New Jersey and
Connecticut, and in Florida. We operate the website:
https://www.manhattanbridgecapital.com.
MANHATTAN BRIDGE CAPITAL, INC. AND
SUBSIDIARY CONSOLIDATED BALANCE
SHEETS
|
|
|
March 31,
2022(unaudited) |
|
|
December 31,
2021(audited) |
|
Assets |
|
|
|
|
|
|
Loans receivable |
|
$ 68,438,336 |
|
|
$ 65,715,364 |
| Interest receivable on
loans |
|
1,028,917 |
|
|
955,443 |
| Cash |
|
145,366 |
|
|
142,546 |
| Other assets |
|
91,555 |
|
|
64,745 |
| Operating lease right-of-use
asset, net |
|
303,366 |
|
|
317,080 |
| Deferred financing costs,
net |
|
41,115 |
|
|
10,539 |
|
Total assets |
|
$ 70,048,655 |
|
|
$ 67,205,717 |
|
Liabilities and Stockholders’ Equity |
|
|
|
|
|
| Liabilities: |
|
|
|
|
|
|
Line of credit |
|
$ 18,389,558 |
|
|
$ 15,645,970 |
| Senior secured notes (net of
deferred financing costs of$303,470 and $322,241,
respectively) |
|
5,696,530 |
|
|
5,677,759 |
| Deferred origination fees |
|
688,233 |
|
|
580,461 |
| Accounts payable and accrued
expenses |
|
148,211 |
|
|
154,169 |
| Operating lease liability |
|
311,758 |
|
|
324,248 |
| Dividends payable |
|
1,436,868 |
|
|
1,436,868 |
|
Total liabilities |
|
26,671,158 |
|
|
23,819,475 |
|
|
|
|
|
|
|
| Commitments and
contingencies |
|
|
|
|
|
| Stockholders’ equity: |
|
|
|
|
|
|
Preferred stock - $.01 par value; 5,000,000 shares authorized;none
issued |
|
--- |
|
|
--- |
| Common shares - $.001 par
value; 25,000,000 sharesauthorized; 11,757,058 issued; 11,494,945
outstanding |
|
11,757 |
|
|
11,757 |
| Additional paid-in
capital |
|
45,526,012 |
|
|
45,522,746 |
| Treasury stock, at cost –
262,113 shares |
|
(798,939) |
|
|
(798,939) |
| Accumulated deficit |
|
(1,361,333) |
|
|
(1,349,322) |
|
Total stockholders’ equity |
|
43,377,497 |
|
|
43,386,242 |
|
|
|
|
|
|
|
|
Total liabilities and stockholders’ equity |
|
$ 70,048,655 |
|
|
$ 67,205,717 |
MANHATTAN BRIDGE CAPITAL, INC. AND
SUBSIDIARYCONSOLIDATED STATEMENTS OF
OPERATIONS (unaudited)
|
|
Three MonthsEnded March 31, |
|
|
|
2022 |
|
|
2021 |
|
|
|
|
|
|
|
|
Interest income from loans |
|
$1,643,789 |
|
|
$1,442,814 |
|
Origination fees |
|
471,271 |
|
|
286,473 |
|
Total revenue |
|
2,115,060 |
|
|
1,729,287 |
|
Operating costs and expenses: |
|
|
|
|
|
|
Interest and amortization of deferred financing costs |
|
331,853 |
|
|
317,186 |
|
Referral fees |
|
1,361 |
|
|
1,751 |
|
General and administrative expenses |
|
361,489 |
|
|
308,981 |
|
Total operating costs and expenses |
|
694,703 |
|
|
627,918 |
|
|
|
|
|
|
|
|
Income from operations |
|
1,420,357 |
|
|
1,101,369 |
|
Other income |
|
4,500 |
|
|
4,500 |
|
Net income |
|
$1,424,857 |
|
|
$1,105,869 |
|
|
|
|
|
|
|
|
Basic and diluted net income per common share outstanding: |
|
|
|
|
|
|
--Basic |
$ |
0.12 |
|
$ |
0.12 |
|
--Diluted |
$ |
0.12 |
|
$ |
0.12 |
|
|
|
|
|
|
|
|
Weighted average number of common shares outstanding: |
|
|
|
|
|
|
--Basic |
|
11,494,945 |
|
|
9,619,945 |
|
--Diluted |
|
11,494,945 |
|
|
9,619,945 |
MANHATTAN BRIDGE CAPITAL, INC. AND
SUBSIDIARY CONSOLIDATED STATEMENTS OF CHANGES IN
STOCKHOLDERS’ EQUITY (unaudited)
FOR THE THREE MONTHS ENDED MARCH 31,
2022
|
|
Common Shares |
Additional Paid-in Capital |
Treasury Stock |
Accumulated Deficit |
Totals |
|
|
|
|
|
|
|
|
|
Shares |
Amount |
|
Shares |
Cost |
|
|
|
Balance, January 1, 2022 |
11,757,058 |
$11,757 |
$45,522,746 |
|
262,113 |
$(798,939) |
$ (1,349,322 |
) |
$ 43,386,242 |
|
|
Non-cash compensation |
|
|
3,266 |
|
|
|
|
|
3,266 |
|
|
Dividends declared and payable |
|
|
|
|
|
|
(1,436,868 |
) |
|
(1,436,868 |
) |
|
Net income |
|
|
|
|
|
|
|
1,424,857 |
|
|
1,424,857 |
|
|
Balance, March 31, 2022 |
11,757,058 |
$11,757 |
$45,526,012 |
|
262,113 |
$(798,939) |
$(1,361,333 |
) |
$ 43,377,497 |
|
FOR THE THREE MONTHS ENDED MARCH 31,
2021
|
|
Common Shares |
Additional Paid-in Capital |
Treasury Stock |
(Accumulated Deficit) Retained
Earnings |
Totals |
|
|
|
|
|
|
|
|
|
Shares |
Amount |
|
Shares |
Cost |
|
|
|
Balance, January 1, 2021 |
9,882,058 |
$9,882 |
$33,157,096 |
|
262,113 |
$(798,939) |
$ (403,849 |
) |
$ 31,964,190 |
|
|
Non-cash compensation |
|
|
3,266 |
|
|
|
|
3,266 |
|
|
Net income |
|
|
|
|
|
|
1,105,869 |
|
1,105,869 |
|
|
Balance, March 31, 2021 |
9,882,058 |
$9,882 |
$33,160,362 |
|
262,113 |
$(798,939) |
$702,020 |
|
$ 33,073,325 |
|
MANHATTAN BRIDGE CAPITAL, INC. AND
SUBSIDIARY CONSOLIDATED STATEMENTS OF CASH
FLOWS (unaudited)
|
|
Three Months Ended March 31, |
|
|
|
2022 |
|
|
|
2021 |
|
|
Cash flows from operating activities: |
|
|
|
|
Net income |
$ |
1,424,857 |
|
|
$ |
1,105,869 |
|
|
Adjustments to reconcile net income to net cash provided by
operating activities - |
|
|
|
|
Amortization of deferred financing costs |
|
24,015 |
|
|
|
24,263 |
|
|
Adjustment to operating lease right-of-use asset and liability |
|
1,224 |
|
|
|
1,192 |
|
|
Depreciation |
|
469 |
|
|
|
587 |
|
|
Non-cash compensation expense |
|
3,266 |
|
|
|
3,266 |
|
|
Changes in operating assets and liabilities: |
|
|
|
|
Interest receivable on loans |
|
(73,474 |
) |
|
|
(87,896 |
) |
|
Other assets |
|
(27,280 |
) |
|
|
(14,998 |
) |
|
Accounts payable and accrued expenses |
|
(5,958 |
) |
|
|
(38,587 |
) |
|
Deferred origination fees |
|
107,772 |
|
|
|
71,289 |
|
|
Net cash provided by operating activities |
|
1,454,891 |
|
|
|
1,064,985 |
|
|
|
|
|
|
|
Cash flows from investing activities: |
|
|
|
|
Issuance of short term loans |
|
(18,295,339 |
) |
|
|
(9,659,678 |
) |
|
Collections received from loans |
|
15,572,367 |
|
|
|
9,267,410 |
|
|
Net cash used in investing activities |
|
(2,722,972 |
) |
|
|
(392,268 |
) |
|
|
|
|
|
|
Cash flows from financing activities: |
|
|
|
|
Proceeds from line of credit, net |
|
2,743,588 |
|
|
|
132,174 |
|
|
Dividend paid |
|
(1,436,868 |
) |
|
|
(1,058,194 |
) |
|
Deferred financing costs incurred |
|
(35,819 |
) |
|
|
--- |
|
|
Net cash provided by (used in) financing activities |
|
1,270,901 |
|
|
|
(926,020 |
) |
|
|
|
|
|
|
Net increase (decrease) in cash |
|
2,820 |
|
|
|
(253,303 |
) |
|
Cash and restricted cash*, beginning of year |
|
142,546 |
|
|
|
459,137 |
|
|
Cash and restricted cash*, end of period |
$ |
145,366 |
|
|
$ |
205,834 |
|
|
Supplemental Cash Flow Information: |
|
|
|
|
|
Interest paid during the period |
$ |
277,757 |
|
|
$ |
302,160 |
|
|
Operating leases paid during the period |
$ |
15,881 |
|
|
$ |
15,849 |
|
|
|
|
|
|
|
|
Supplemental Information – Noncash Information: |
|
|
|
|
|
Dividend declared and payable |
$ |
1,436,868 |
|
|
$ |
--- |
|
* At January 1, 2021, cash and restricted cash
included $327,483 of restricted cash. No other periods above
included restricted cash.
Contact:
Assaf Ran, CEO
Vanessa Kao, CFO
(516) 444-3400
SOURCE: Manhattan Bridge Capital, Inc.
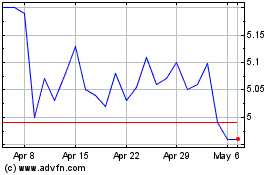
Manhattan Bridge Capital (NASDAQ:LOAN)
Historical Stock Chart
From Mar 2024 to Apr 2024

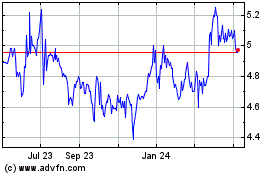
Manhattan Bridge Capital (NASDAQ:LOAN)
Historical Stock Chart
From Apr 2023 to Apr 2024
