By Mark Hulbert
It is perhaps fitting that the stock market plunged last month
as we approached the 20th anniversary of the top of the
internet-stock bubble.
On March 10, 2000, the Nasdaq Composite Index hit an intraday
high of 5132.52. We all know what happened next. By October 2002,
the index had fallen 78.4% -- to 1108.49.
And that was only half the agony. The other half was the index's
anemic recovery from that low. It took until November 2014 for the
index to battle back to its March 2000 level, even after taking
dividends into account. If you adjust for inflation, the index
didn't recover until August 2017, more than 17 years later.
If the Dow Jones Industrial Average were to follow the same
script, it would be trading at around 5400 in October 2022, and not
make it back to its current level until November 2034 (or, on an
inflation-adjusted basis, the summer of 2037). It is hard to
overestimate how devastating such a scenario would be for retirees
and soon-to-be-retirees.
How likely is this scary scenario? What investment lessons can
we draw with the perspective of 20 years' hindsight?
How unusual is it that the Nasdaq took so long to recover?
The Nasdaq's snaillike recovery after the dot-com crash doesn't
appear to have been unprecedented, at first blush. For example, it
wasn't until 1954 that the Dow Jones Industrial Average clawed its
way back to where it stood, on a point-for-point basis, before the
1929 crash -- a recovery time of 25 years.
In fact, however, stocks' real recovery from the 1929 crash took
a lot less than 25 years, for three reasons: The 30 stocks that
made up the Dow were below-average performers; dividends, which
were substantial in the 1920s and 1930s, helped restore losses; and
inflation, which was negative in the early 1930s, worked to stocks'
advantage. On a dividend- and inflation-adjusted basis, the broad
stock market had recovered from the 1929 collapse by March 1937,
only 7 1/2 years later.
Fast-forward to the early 21st century. It took the broad market
similar lengths of time to recover, on a dividend- and
inflation-adjusted basis, from the 2008-09 crisis (5 1/4 years) and
the bursting of the internet-stock bubble (7 1/2 years). The
longest recovery time in U.S. history was from the 1973-74 bear
market: It wasn't until the end of 1984 that the broad market, on
an inflation- and dividend-adjusted basis, was back to where it
stood at its January 1973 peak -- nearly 12 years later.
Note carefully, furthermore, that these recovery times were from
the worst bear markets of the past century. Taking into account all
U.S. bear markets since the mid-1920s, I calculate it took an
average of just 3.1 years for the broad market on a dividend- and
inflation-adjusted basis to make its way back to where it stood
before the bear market began.
So, the Nasdaq's plunge in 2000, and subsequent slow recovery,
is an outlier. No other bear-market recovery in U.S. history took
as long.
Diversification is still the key
To make a portfolio less vulnerable to the same kind of long,
drawn-out recovery as the Nasdaq market suffered, diversification
will be as important as it has always been.
Being narrowly concentrated in a relatively small number of
mostly younger companies, the Nasdaq market required more than
twice as long as the broader market to recover from the dot-com
crash.
And let there be no doubt that the Nasdaq market was poorly
diversified 20 years ago. Cisco Systems, the internet hardware and
software company, had the largest market cap of any stock in March
2000, and represented the largest share of any in the Nasdaq
Composite, which is a cap-weighted index. Over the two years
subsequent to the bursting of the internet bubble, the stock
dropped more than 90%.
The overall stock market today has become increasingly
concentrated, making it more difficult to achieve the level of
diversification that would otherwise ease bear-market losses. For
example, the five companies in the S&P 500 with the largest
market cap now make up more than 18% of the combined market cap of
all component companies. That is the most in U.S. history,
according to Morgan Stanley Research -- higher even than at the top
of the internet-stock bubble.
That means the S&P is becoming more vulnerable to the
idiosyncratic failures of a few large companies. Still, even though
the trend is worrisome, today's S&P is more diversified than
Nasdaq was: In contrast to the 18% of combined market cap that the
five largest companies in the S&P represent, the comparable
proportion for Nasdaq was more than 40%.
Valuations matter
The other investment lesson is that valuations matter, even
though they don't seem to when things are humming and some
investors are convinced that the rules have changed. At the top of
the internet bubble, for example, Nasdaq had a price/earnings ratio
of more than 100 when calculated on trailing 12 months' earnings --
and still 75 when based on estimates of subsequent 12-month
earnings. Both were many orders of magnitude higher than the broad
market's long-term P/E average of below 20.
To be sure, no valuation metric is perfect. But in hindsight,
the P/E ratio was a good indicator of the market's overvaluation,
and of weaker returns ahead: Since its March 2000 high, the Nasdaq
Composite, on an inflation- and dividend-adjusted basis, has
produced a return of just 1.3% annualized. The comparable return
for the S&P is 4.1% annualized, which is itself lower than the
6.8% average annualized return for the past two centuries.
Fortunately, the Nasdaq market's P/E ratio is a lot lower today
than 20 years ago: It stands at 26.4, when calculated based on
trailing 12-month earnings, and 22.2 when based on forward
estimates, according to Birinyi Associates. While these ratios are
significantly above average, they aren't nearly as inflated as they
were in March 2000.
Bottom line
The stock market is not as overvalued as it was 20 years ago,
and so long as you invest in a widely diversified index fund, your
recovery from the next bear market should be a lot faster than the
Nasdaq market's was from the bursting of the internet bubble. More
broadly, the past 20 years have taught us the importance of
diversification and paying attention to valuations. We should
resolve never to forget.
Mr. Hulbert is a columnist whose Hulbert Ratings tracks
investment newsletters that pay a flat fee to be audited. He can be
reached at reports@wsj.com.
(END) Dow Jones Newswires
March 08, 2020 23:27 ET (03:27 GMT)
Copyright (c) 2020 Dow Jones & Company, Inc.
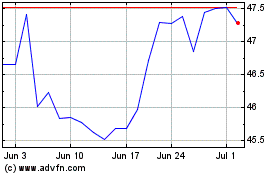
Cisco Systems (NASDAQ:CSCO)
Historical Stock Chart
From Mar 2024 to Apr 2024

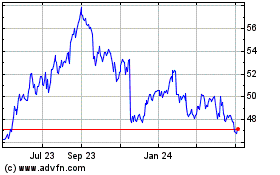
Cisco Systems (NASDAQ:CSCO)
Historical Stock Chart
From Apr 2023 to Apr 2024
