UNITED STATES
SECURITIES AND EXCHANGE COMMISSION
Washington, D.C. 20549
SCHEDULE 14A
Proxy Statement Pursuant to Section
14(a) of the
Securities Exchange Act of 1934 (Amendment No. )
| ☑ |
Filed by the Registrant |
☐ |
Filed by a party other
than the Registrant |
|
| CHECK THE APPROPRIATE BOX: |
| ☐ |
|
Preliminary Proxy Statement |
| ☐ |
|
Confidential, for Use of the Commission Only
(as permitted by Rule 14a-6(e)(2)) |
| ☑ |
|
Definitive Proxy Statement |
| ☐ |
|
Definitive Additional Materials |
| ☐ |
|
Soliciting Material under §240.14a-12 |

Comcast Corporation
(Name of Registrant as Specified In Its
Charter)
(Name of Person(s) Filing Proxy
Statement, if other than the Registrant)
| PAYMENT OF FILING FEE (CHECK ALL BOXES THAT APPLY): |
| ☑ |
|
No fee required |
| ☐ |
|
Fee paid previously with preliminary materials |
| ☐ |
|
Fee computed on table in exhibit required by Item 25(b) per Exchange Act Rules 14a-6(i)(1) and 0-11 |
Table of Contents

Notice of 2022 Annual
Meeting of Shareholders
and Proxy Statement
Table of Contents
2021 Company Highlights
Strong Execution on Key
Strategic Priorities
 |
|
|
 |
|
|
 |
| Connectivity |
|
|
Aggregation |
|
|
Streaming |
$19 billion
investment in Comcast Cable’s network since 2017 has enabled
us to stay ahead of demand
1.3 million
broadband customer net additions in the U.S. in 2021
1.2 million
wireless customer line net additions in the U.S. in 2021, the
best annual result since the launch of Xfinity Mobile in 2017 |
|
|
Increased customer penetration of X1, Flex & Sky Q
provided more of our customers with our leading aggregation platforms
Launched Sky Glass in the U.K. and XClass TV in the U.S.
powered by Comcast’s global technology platform, which accelerated
the new products’ speed to market and provides customers with advanced technology features and functionality |
|
|
Peacock monthly active accounts in the U.S. reached 24.5 million
at year-end
Launched nationwide in July 2020, NBCUniversal’s differentiated,
ad-supported streaming service leverages technologies and capabilities from across the company
Established SkyShowtime in partnership with Paramount
Subscription video on demand service to launch in more than 20
new markets in Europe starting in 2022 |
| |
|
|
|
|
|
|
 |
|
|
 |
|
|
 |
| Digital Equity |
|
|
Diversity,
Equity & Inclusion |
|
|
Environmental
Sustainability |
Addressing Digital Inequities
10 million+
low-income Americans connected to the internet over the last decade
through Internet Essentials, which we believe is the nation’s largest and most comprehensive broadband adoption
program for low-income families
Community Impact
1,000 WiFi-Connected Lift Zones
opened in community centers nationwide for low-income families
by the end of 2021 |
|
|
Workforce Leadership Diversity
42% women & 24% people of color
in our VP+ population, and 36% women & 45% people of color
in our overall workforce, based on U.S. full-time employees as of year-end 2021
Supplier Diversity
At least $3 billion annual spend
with diverse suppliers during each of the past 5 years, with over
$4.3 billion spent with diverse Tier 1 vendors and over $390 million spent with diverse Tier 2 subcontractors in 2021 |
|
|
Carbon Neutral by 2035
Goal to be carbon neutral by 2035 in Scope 1 and 2 emissions across
our global operations
Focused on Renewable Energy
Long-term purchase agreement for renewable electricity signed
in 2021 to power approximately 12% of our current U.S. electricity use beginning in 2024-2025 |
NOTE
ABOUT FORWARD-LOOKING STATEMENTS AND WEBSITE REFERENCES
This proxy statement includes estimates, projections and statements
relating to our business plans, objectives and expected operating results and statements regarding environmental, social
and governance-related plans and goals that are “forward-looking statements” within the meaning of the Private
Securities Litigation Reform Act of 1995, Section 27A of the Securities Act of 1933, and Section 21E of the Securities
Exchange Act of 1934 (the “Exchange Act”). Forward-looking statements may appear throughout this report. These
forward-looking statements generally are identified by the words “believe,” “project,” “expect,”
“anticipate,” “estimate,” “intend,” “potential,” “strategy,”
“future,” “opportunity,” “commit,” “plan,” “goal,” “may,”
“should,” “could,” “will,” “would,” “will be,” “will
continue,” “will likely result” and similar expressions. Forward-looking statements are based on current
expectations and assumptions that are subject to risks and uncertainties that may cause actual results to differ materially.
In evaluating these statements, you should consider various factors, including the risks and uncertainties we describe
in the “Risk Factors” sections of our Forms 10-K and 10-Q and other reports we file with the Securities and
Exchange Commission (“SEC”).
Additionally, none of the statements, reports, policies or other
content on our website, or any other websites or reports referenced or discussed in this proxy statement, are deemed to
be part of, or incorporated by reference into, this proxy statement. The inclusion of forward-looking and other statements
in this proxy statement or on our website that may address our corporate responsibility initiatives, progress, plans and
goals is not an indication that they are necessarily material to investors or required to be disclosed in our filings
with the SEC. Such statements may contain estimates, make assumptions based on developing standards that may change and
provide aspirational goals and commitments that are not intended to be promises or guarantees. Readers are cautioned not
to place undue reliance on forward-looking statements and such other statements, which speak only as of the date they
are made. We undertake no obligation to update or revise publicly any forward-looking or such other statements, whether
because of new information, future events or otherwise. |
2
Table of Contents
Message from Our Chairman, President and CEO and Our Lead Independent
Director
Dear Shareholders,
2021 was an outstanding year for Comcast. Our financial results were the
strongest in our company’s history – generating record high levels of revenue, Adjusted EBITDA, and Free Cash Flow
– and we returned significant amounts of capital to shareholders through share repurchases of $4 billion and dividends paid
of $4.5 billion.
At the same time, we continued to innovate and deliver world-class connectivity
and entertainment to millions of consumers across the globe. We launched exciting new products – including Sky Glass and
XClass TV – leveraging the power of our global technology platform. We brought must-watch content to viewers across our
television networks and through our fast-growing streaming service, Peacock. Our Theme Parks had a phenomenal year, adding new
attractions and parks and reporting the most profitable fourth quarter on record, despite limited international guest attendance.
Meanwhile, we continued to strengthen, evolve, and expand our core connectivity business, which led to significant customer additions
in 2021.
Importantly, in all our work, we remain guided by our core values
and an unwavering commitment to our communities. We accelerated our efforts to advance diversity, equity, and inclusion, and
made new investments in digital equity programs that will enable us to continue to connect more people to the tools and
resources needed to succeed in today’s digital world. We also announced a new environmental goal to be carbon neutral
in Scopes 1 and 2 emissions across our global operations by 2035.
None of this would be possible without the remarkable dedication and talent
of our nearly 190,000 employees, and the stewardship of our Board of Directors. We’d like to take this opportunity to thank
our fellow directors, and especially Nomi Bergman for her invaluable insight and leadership during her tenure. The Board aims
to further refresh its membership in the coming years, with a continued focus on diverse candidates.
As we enter 2022, we do so with great momentum and tremendous gratitude
for your continued support of Comcast. We are proud to lead this remarkable company.
Sincerely,
 |
 |
| |
|
Brian L. Roberts
Chairman, President and Chief Executive Officer |
Edward D. Breen
Lead Independent Director |
2022 Proxy
Statement 3
Table of Contents
Notice of 2022 Annual Meeting of Shareholders of Comcast Corporation

| |
Voting Items |
Board Voting
Recommendation |
| |
|
|
|
DATE
June 1, 2022
TIME
Online check-in opens: 8:45 a.m. Eastern Time Meeting begins: 9:00
a.m. Eastern Time
PLACE
Meeting live via the internet:
comcast.onlineshareholdermeeting.com
WHO CAN VOTE
Shareholders of record on April 4, 2022
|
PROPOSAL 1
Elect directors
|
FOR each nominee |
PROPOSAL 2
Advisory vote to approve
executive compensation |
FOR |
| PROPOSAL 3
Ratify appointment of
independent auditors |
FOR |
PROPOSALS 4-8
Vote on shareholder proposals |
AGAINST |
Only shareholders of record on April 4, 2022 may vote and participate
during the meeting. If the meeting is adjourned because a quorum is not present, then shareholders who attend the reconvened meeting
will constitute a quorum for the purpose of acting upon the matters presented at that meeting pursuant to the rules described
in “Voting Securities and Principal Holders — Outstanding Shares and Voting Rights” in the attached proxy statement.
The Notice of Internet Availability of Proxy Materials is being mailed,
and the attached proxy statement is being made available, to our shareholders beginning on or about April 22, 2022.
Your vote is important. Please vote your shares promptly. To vote your
shares, you can:
 |
|
 |
|
 |
| |
|
|
|
|
| Use the internet, as described in the Notice of Internet Availability
of Proxy Materials and on your proxy card. |
|
Call the toll-free telephone number set forth in the attached
proxy statement and on your proxy card. |
|
Complete, sign and date your proxy card and return your proxy
card by mail. |
April 22, 2022

THOMAS J. REID
Secretary
Important
Notice Regarding the Availability of Proxy Materials for the Annual Meeting of Shareholders to Be Held on June 1, 2022: Our
proxy statement and our Annual Report on Form 10-K for the fiscal year ended
December 31, 2021 are available at www.proxyvote.com. |
4
Table of Contents
Table of Contents
2022 Proxy Statement 5
Table of Contents
About Comcast
Our Company
Comcast Corporation (“Comcast,” the “Company,”
“we,” “our” or “us”) is a global media and technology company that connects people to moments
that matter. We are principally focused on connectivity, aggregation and streaming with over 57 million customer relationships
across the United States and Europe. We deliver broadband, video and wireless services through our Xfinity, Comcast Business and
Sky brands; create, distribute and stream leading entertainment, sports and news through Universal Filmed Entertainment Group,
Universal Studio Group, Sky Studios, the NBC and Telemundo broadcast networks, Peacock, NBC News, NBC Sports, Sky News and Sky
Sports; and provide memorable experiences at Universal Parks and Resorts in the United States and Asia.
2021 Performance Overview
Over the past two years, Mr. Roberts and our senior leadership team have
successfully led our company through the pandemic as the world continued to navigate ongoing challenges, achieving strong operating
and financial results and underscoring the strength and resilience of our business. Our relentless focus on innovation and execution,
balanced with financial discipline, enabled us to deliver record-high financial results in 2021, invest for the future and increase
our return of capital to shareholders.
During 2021, some of our businesses continued their strong financial and
operating performance while others continued to recover from the global pandemic. At Comcast Cable, the significant investments
we have made in our technology and network over the years to stay ahead of demand and to maintain speed and reliability continued
to differentiate our broadband experience, leading to 1.3 million net new broadband customers in 2021 and bringing total broadband
subscribers to 31.9 million at year end.
While the global pandemic continued to have some negative impacts on NBCUniversal
and Sky, our teams led strong recoveries and posted results that surpassed our expectations leading into 2021. At NBCUniversal,
our theme parks performed exceptionally well, reopening safely with strong attendance and financial results, while also adding
new attractions and opening Universal Beijing Resort. Peacock, our streaming service that launched in mid-2020, showed significant
growth in monthly active accounts and revenue relative to 2020. In 2021, programming and production levels normalized at both
NBCUniversal and Sky, and we continue to monetize our intellectual property through creative new options for content licensing
windows and distribution.
We also worked together across our complementary, high-performing business
units to continue to accelerate convergence in media and technology. In 2021, as we sought to expand the reach of our proprietary
global technology platform and addressable customer base, we launched Sky Glass in the United Kingdom and XClass TV in the United
States. Both of these products are built upon our existing investments across our company in X1, Flex and Sky Q.
In addition to delivering for our shareholders, our Board credits Mr.
Roberts and our senior leadership team for their continued support of our other stakeholders, including our employees, customers,
suppliers and the communities where we operate. From our continued leadership in addressing the digital divide, to our ongoing
efforts and further progress in diversity, equity and inclusion and community impact, to taking further steps to lessen our environmental
footprint, our senior leadership team led by example and reinforced our company’s commitment to doing what’s right
while underscoring our commitment to act with integrity. See “Spotlight on our Corporate Responsibility Initiatives”
for additional information.
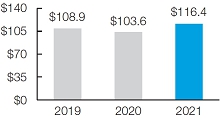
Financial Performance
Our 2021 consolidated operating and financial results were strong, with
contributions from across our company, underscoring our business resilience, strategic decision-making and capital allocation
priorities, all driven with a view toward growth and creating long-term value. As vaccination rates increased and restrictive
government mandates subsided at various points throughout the course of 2021, the exceptional leadership of our management team
helped our business operations and financial performance to rebound more quickly than expected as compared to 2020 performance,
underscored by our growth across many of our financial metrics.
6
Table of Contents
REVENUE
($ in billions) |
|
NET
INCOME ATTRIBUTABLE
TO COMCAST
($ in billions) |
|
ADJUSTED
EBITDA(1)
($ in billions) |
| |
|
|
|
|
 |
|
 |
|
 |
| |
|
|
|
|
NET
CASH PROVIDED
BY OPERATING ACTIVITIES
($ in billions)

|
|
FREE
CASH FLOW(1)(2)
($ in billions)

|
|
(1) Reconciliations
of consolidated Adjusted EBITDA to net income attributable to Comcast Corporation and consolidated Free Cash Flow to net
cash provided by operating activities are set forth in Appendix A.
(2) 2021 Free Cash Flow of $17.1 billion includes a $1.3 billion benefit related to the tax impact of a bond exchange
completed in August 2021 and roughly $1 billion from returns on investing activities. |
$140 $105 $35 $70 $0 $108.9 $103.6 $116.4 2019 2020 2021
$13.1 $10.5 $14.2 $0 $4 $8 $12 $16 2019 2020 2021 $34.3 $30.8 $34.7 $0 $10 $20 $30 $40 2019 2020 2021 $35 2019 2020 2021 $13.4
$13.3 $17.1 $0 $5 $10 $15 $20 2019 2020 2021 $25.7 $24.7 $29.1 $28 $7 $14 $21 $0
2021 key reported results across our three primary businesses included:
| ● |
Comcast Cable (whose results are reported in our
Cable Communications segment) revenue increased 7.1% to $64.3 billion, and Adjusted EBITDA increased 11.2% to $28.1 billion. |
| |
|
| ● |
NBCUniversal’s Media, Studios and Theme Parks segment revenue
increased 20.3%, 16.2% and 141.2% to $22.8 billion, $9.4 billion and $5.1 billion, respectively, while Adjusted EBITDA was
$4.6 billion, $0.9 billion and $1.3 billion, respectively. NBCUniversal results now include the operations of Peacock. |
| |
|
| ● |
Sky revenue increased 9.1% to $20.3 billion, or 3.1% excluding the
impact of foreign currency. Sky Adjusted EBITDA increased 20.8% to $2.4 billion, or 10.2% excluding the impact of foreign
currency. See Appendix A for a reconciliation. |
We resumed our share repurchase program in May 2021 after pausing the
program in 2019 to accelerate the reduction of indebtedness we incurred in connection with our acquisition of Sky. In addition,
we made four cash dividend payments totaling $4.5 billion in 2021 and announced an increase to the planned annual dividend by
$0.08 per share, or 8%, to $1.08 per share on an annualized basis for 2022 – the 14th consecutive annual increase.
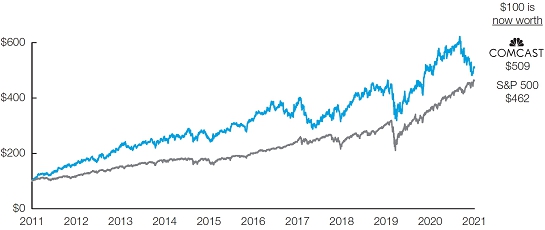
Stock Performance
Our total shareholder return
(“TSR”) over the 10-year period ending December 31, 2021 is reflected below, with our performance over the long
term outperforming the S&P 500.
COMCAST’S TSR VS. THE S&P 500 SINCE
YE 2010*
 |
|
* Cumulative
total shareholder returns, including dividends reinvested, are from December 31, 2011 through December 31, 2021. |
$600
$400 $200 $0 2011 2012 2013 2014 2015 2016 2017 2018 2019 2020 2021 $100 is now worth $509 S&P 500 $462
2022 Proxy Statement 7
Table of Contents
Spotlight on Our Corporate Responsibility Initiatives
At Comcast, our most significant environmental, social and governance
(“ESG”) issues are reviewed with our Board of Directors and its committees. Our Audit Committee oversees cybersecurity
and significant business continuity risks. Our Compensation and Human Capital Committee reviews programs and strategies with respect
to human capital management and employee engagement and oversees succession planning. Our Governance and Corporate Responsibility
Committee oversees significant environmental and social issues, risks and trends, including diversity, equity and inclusion (“DE&I”)
and harassment and discrimination matters, as well as privacy and political and lobbying activities. For more information about
our Board’s oversight of ESG issues, see “Corporate Governance and Board Matters – Board Structure and Responsibilities
– Board and Committee Strategy, Risk and ESG Oversight Responsibilities.”
We provide reports on various ESG issues and initiatives that are of interest
to our stakeholders, including our shareholders, employees, customers, suppliers, and the communities where we operate, on our
ESG Reporting website at www.cmcsa.com/esg-reporting, including our Impact Report,
EEO-1 Data Report, Sustainability Accounting Standards Board (“SASB”) Report, Task Force on Climate-Related Financial
Disclosures (“TCFD”) Report and reporting on our political and trade association activity. None of the statements,
reports, policies, resources or other content on our website, or any other websites or reports referenced or discussed in this
proxy statement, are deemed to be part of, or incorporated by reference into, this proxy statement.
Digital Equity
As a media and technology company, we have a unique opportunity to address
digital inequities to help create a more equitable society. Over the last decade, we have connected a cumulative total of more
than 10 million low-income Americans to the internet through our Internet Essentials program. At the same time, we have sought
to improve access to digital tools and resources, invested in organizations that help people build digital skills, and partnered
with cable industry peers, schools, governments, nonprofits, businesses and communities to help bridge the digital divide.
In 2021, we continued our efforts to extend our broadband services to
underserved and unserved Americans by:
| ● |
Promoting and sponsoring our Internet Essentials program as America’s
leading broadband product for low-income families, including by expanding eligibility and providing affordable opportunities
for school districts and other organizations to connect students to broadband access at home. |
| |
|
| ● |
Supporting and participating in the federal government’s broadband
benefits programs to provide discounted internet service to those in need, namely the Emergency Broadband Benefit program
that launched in May 2021 and its successor, longer-term Affordable Connectivity Program that launched at the end of 2021.
Through these programs, which enable qualifying low-income customers to apply a financial subsidy to our broadband services,
customers can receive our Internet Essentials service or our new enhanced Internet Essentials Plus service with twice the
download speed – up to 100 Mbps — effectively for free. |
| |
|
| ● |
Participating in federal, state and local programs designed to fund
the expansion of broadband to unserved Americans and extending our broadband network to new areas where reliable, high-speed
internet services had been unavailable. |
| |
|
| ● |
Continuing our initiatives established in response to the global
pandemic that provided internet access to those without it, including by offering 60 days of free internet service to eligible
new customers, making our 1.5 million public Wi-Fi hotspots available for free and creating flexible payment plans that allowed
customers and small businesses to retain their services. |
| |
|
| ● |
Partnering with non-profit organizations and city leaders to create,
through the end of 2021, more than 1,000 Lift Zones in community centers nationwide where students in need of internet-equipped
spaces for remote learning can connect to the internet to participate in distance learning, with an additional 250 planned
by the end of 2022. |
8
Table of Contents
Diversity, Equity & Inclusion
Our commitment to DE&I is long-standing. We believe that a diverse,
equitable and inclusive company helps to foster creativity, innovation and success. We embrace diversity of background, perspective,
culture and experience throughout our business, and we use our resources – our people, programming and platforms –
to work toward racial equity in areas where we can have a meaningful impact. Our ongoing efforts and continued progress in this
regard are reviewed and discussed by our Board and/or its committees, our senior leadership teams and our external DE&I Advisory
Council, which is chaired by our Chief Diversity Officer.
Board of Directors and Workforce
(Workforce statistics based on U.S. full-time employees as of year-end
2021)
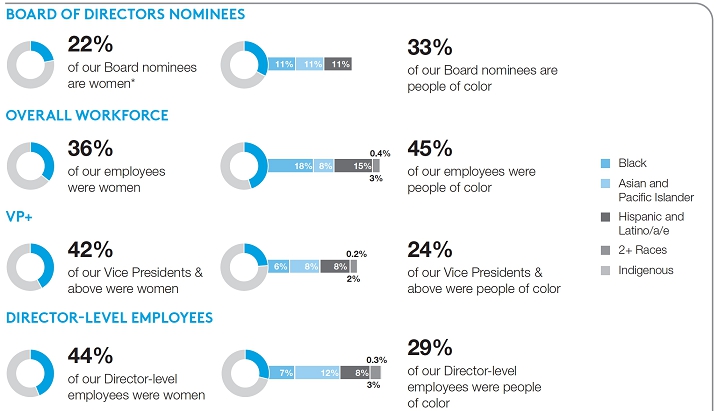
BOARD OF DIRECTORS NOMINEES 22% of our Board nominees are women* 11% 11% 11% 33% of our Board nominees are people of color Black Asian and Paci_c Islander Hispanic and Latino/a/e 2+ Races Indigenous OVERALL WORKFORCE 36% of our employees were women 18% 15% 0.4% 8% 3% 45% of our employees were people of color VP+ 42% of our Vice Presidents & above were women 6% 8% 0.2% 8% 2% 24% of our Vice Presidents & above were people of color DIRECTOR-LEVEL EMPLOYEES 44% of our Director-level employees were women 7% 8% 0.3% 12% 3% 29% of our Director-level employees were people of color
| * |
As of December 31, 2021, 30% of our Board of Directors
were women and 50% of our directors were diverse by gender, race or ethnicity. See “Corporate Governance and Board Matters
– Board of Directors Nominees – Director Skills, Experience and Diversity” for more information. |
| |
|
| ● |
Diverse Talent Development Efforts: We
seek to hire, promote and develop people from a diversity of backgrounds and experiences. To best serve our unique workforce,
we offer both tailored programs designed for specific audiences to accelerate the development of prioritized talent, as well
as broad-based leadership development programs designed for employees to lead inclusively and with cultural competence. Some
of our learning experiences include foundational leadership development programs to help employees embrace their leadership
potential, a year-long networking experience for women of color and a coaching and online learnings platform designed for
women. |
| |
|
| ● |
DE&I Education and Training: We
offer a variety of training programs and initiatives focused on creating a more inclusive workplace culture, including monthly
company-wide forums like our DE&I speaker series designed to inform, inspire dialogue and foster employee engagement through
a curated experience anchored by external scholars, authors and thought leaders focusing on a variety of DE&I topics.
Additionally, we offer an enterprise-wide learning catalog with digital eLearning modules and self-directed curated learning
guides, as well as instructor-led virtual workshops covering inclusion topics such as: Interrupting Unconscious Bias, Social
Identities/Dimensions of Diversity, Allyship and Neurodiversity, among others. Our various DE&I newsletters and communications
cover essential DE&I topics such as inclusive leadership behaviors, updates on training opportunities, employee-driven
DE&I events and DE&I data milestones, to name a few. |
2022 Proxy Statement 9
Table of Contents
| ● |
Employee Resource Groups (“ERGs”):
We support nine ERGs for Asian Pacific American, Black, People
with Disabilities, LGBTQ+, Hispanic/Latino, Veteran, Young Professional, Women and Indigenous employees. Our ERGs have 35,000
members in over 200 chapters, and are voluntary, employee-led organizations dedicated to developing the careers of our employees,
contributing to community service and building on an inclusive and collaborative workplace and culture. Each ERG has two executive
sponsors, and further support is provided for ERG projects, programs and events from a $500,000 annual fund. |
Supplier Diversity and Small Business Support
Our supplier diversity program is designed to promote, increase and improve
the participation of diverse businesses within our corporate supply chain — including companies owned by women, people of
color, veterans, people with disabilities and LGBTQ+ individuals. We have been a member of the Billion Dollar Roundtable since
2015, which recognizes corporations that achieve spending of at least $1 billion each year with diverse suppliers, and have spent
at least $3 billion each year with diverse suppliers during the past 5 years. In 2021, we spent over $4.3 billion with diverse
Tier 1 vendors (with direct purchases from approximately 3,250 diverse suppliers) and over $390 million with diverse Tier 2 subcontractors.
Through Comcast RISE, a program aimed at small businesses owned by people of color and women, we have also supported more than
6,700 small businesses with over $60 million in grants and in-kind marketing and technology support through 2021.
In 2021, we also invested $25 million in the Seibert Williams Shank Clear
Vision Impact Fund, a diverse-led and diverse-serving financial institution that provides direct support to local community businesses,
and $10 million in the Inclusiv Racial Equity and Resilience Investment Fund, which is aimed at building equity in credit unions
led by and/or serving people of color in an effort to help increase lending to people of color-owned businesses, homeowners and
consumers by providing financial opportunities to traditionally underserved and underbanked communities.
Diverse Programming and Platforms
We strive to have diverse perspectives that resonate with a wide range
of audiences in our programming at NBCUniversal and in the content we distribute on our Xfinity platforms. We have created opportunities
in front of and behind the camera, including by offering a wide range of programs designed to build a diverse pipeline of talent,
including directors, writers, actors, music composers and journalists.
Examples of programs we have developed that seek to build additional opportunities
for diverse talent include NBCUniversal’s innovative, multiplatform journalism training and development program for students
at Historically Black Colleges and Universities and diverse-serving institutions, as well as a multi-year $3.5 million scholarship
fund for underrepresented students. NBCUniversal also created a fellowship program awarding diverse documentary filmmakers grants
to support feature-length nonfiction films highlighting social issues and identities, with seven groundbreaking filmmakers named
in 2021 for the first inaugural fellowship.
Through our media platforms, we have worked to amplify diverse voices
and cultures, including through a vast ecosystem of diverse content on Xfinity, including curated On Demand destinations, as well
as through NBCUniversal’s ‘The More You Know’ series of public service announcements that have kept audiences
informed and educated on issues that include a campaign to speak out against systemic racism and speaking up for social justice,
equality and equity, to name a few. For more information on our diverse programming and platforms, see pages 66-67 of this proxy
statement.
Community
Building on our longstanding commitment to DE&I, in 2020 we developed
a comprehensive, multi-year plan to allocate $100 million in cash and in-kind support to fight injustice and inequality against
any race, ethnicity, gender identity, sexual orientation or ability. We are well on track to fulfill this commitment by
the end of 2022. This is on top of the existing commitments Comcast makes to thousands of organizations supporting underrepresented
communities nationwide through our social impact programs and the Comcast NBCUniversal Foundation.
10
Table of Contents
Human Capital Management
As a global media and technology company, we have a wide range of employees,
including management professionals, technicians, engineers, call center employees, theme park employees and media talent and production
employees. Our human capital management policies, programs and initiatives are tailored to the specific employee populations within
our businesses and include the following:
| ● |
Employee Engagement: We
seek to create an engaged workforce through proactive listening and constructive dialogue, including through employee engagement
surveys, the nine ERGs described above and our open reporting environment where employees can speak up without fear of retaliation.
Our Board, through its committees, also receives periodic reports on our employee engagement surveys and employee concerns
reported through our Comcast NBCUniversal Listens and Sky Listens programs. |
| |
|
| ● |
Talent Development and Succession Planning:
We provide a wide variety of opportunities for professional growth
for employees with in-classroom and online trainings and on-the-job experience, including as described above in “Diversity,
Equity & Inclusion.” We also offer education tuition assistance to full-time employees in the United States. Our
Board discusses succession planning for our CEO and the remainder of our senior executive management team. Throughout the
year, our senior executive management team and other executives throughout our businesses make presentations to the Board
and its committees and interact with our directors informally outside of regularly scheduled Board meetings, which provides
directors with meaningful insight into our current pool of talent, what attracts and retains our executives and our company
culture. See “Corporate Governance and Board Matters – Corporate Governance Practices, Policies and Processes
– Succession Planning” for additional information. |
| |
|
| ● |
Health and Welfare Benefits: We
offer a portfolio of services and tools to support our employees’ health and well-being. In 2021, we enhanced benefits
related to virtual care, telehealth options and back-up family care resources and support services and launched new behavioral
health and counseling tools to support emotional well-being. We provide female and male employees the same paid parental leave
options, including for adoption/surrogacy, and provide specialized support teams to help manage the first months of parenthood.
In response to the global pandemic, we completed hundreds of thousands of COVID-19 tests, made physician-directed COVID-19
screening, testing, vaccine and treatment available at no out-of-pocket cost to benefit-enrolled employees and their dependents
and hosted onsite vaccine clinics. |
| |
|
| ● |
Financial Benefits: We
seek to attract and retain employees by providing competitive compensation and benefits packages within the applicable market.
Financial benefits that we provide include 401(k) retirement plans in the United States with a company match and other retirement
arrangements internationally, employee stock purchase plans in the United States, United Kingdom, Ireland and several other
European countries where most of our full-time and part-time employees can purchase our stock at a discount, and financial
literacy training and counseling to support employees in making their own financial decisions. We also grant restricted stock
units and stock options on an annual basis to a meaningful portion of our employees, with over 18,000 employees receiving
equity awards in 2021. |
Environmental Sustainability
In 2021, we continued to take steps to lessen our environmental footprint
and established a goal to become carbon neutral by 2035 for Scope 1 and 2 emissions across our global operations. Our largest
source of emissions, representing approximately 75% of emissions, is due to purchased electricity powering our global operations,
and as a result, we are focused on renewable energy procurement as we seek to reduce our greenhouse gas (“GHG”) emissions.
The remaining emissions come from our owned and operated vehicle fleet and from generators, cooling systems and purchased steam,
cooling and heating.
Because purchased electricity accounts for the majority of our Scope 1
and 2 emissions, we have further developed our renewable energy procurement strategy, signing in 2021 a long-term purchase agreement
for renewable electricity to power approximately 12% of our current U.S. electricity use beginning in 2024-2025. To provide transparency
and help drive improvement, we report data using the Greenhouse Gas (GHG) Protocol consistent with the Sustainability Accounting
Standards Board (SASB) and Task Force on Climate-Related Financial Disclosures (TCFD) frameworks.
2022 Proxy Statement 11
Table of Contents
Cybersecurity and Privacy
Protecting the security and integrity of the information and systems under
our control and safeguarding the privacy of our customer and employee information has long been a priority at Comcast. In fact,
cybersecurity and privacy risks are among the core enterprise risks for Board-level oversight identified through our annual Enterprise
Risk Management (“ERM”) assessment.
Our cybersecurity strategy, policies and practices are overseen by a Cybersecurity
Leadership Council, headed by our Chief Financial Officer and Chief Legal Officer. Other members include the Chief Information
Security Officers (“CISOs”), Chief Technology Officers (“CTOs”), Chief Financial Officers and General
Counsels of Comcast Cable, NBCUniversal and Sky, along with our head of Internal Audit. Our information security programs cover
a comprehensive range of capabilities, including network security, endpoint security, vulnerability management, antivirus and
malware protection, encryption and access control. We are committed to data protection, perform annual third-party certifications/audits
where appropriate, and engage an independent firm to perform a cyber capability maturity assessment every three years. Our Board,
including through our Audit Committee, reviews and discusses our cybersecurity risks, practices and protections with our CISOs
and CTOs at least twice per year. In addition, our Audit Committee receives regular updates on our cybersecurity posture throughout
the year from our head of Internal Audit as appropriate.
We also have a Privacy Council, which includes our Chief Legal Officer
and our Chief Compliance Officer, and the Chief Privacy Officers and General Counsels of Comcast Cable, NBCUniversal and Sky,
that reviews and assesses privacy risks throughout our businesses and shares best practices. We respect the privacy rights of
individuals and have implemented tailored privacy compliance programs for our businesses. Our Board, through our Governance and
Corporate Responsibility Committee, reviews and discusses our privacy program, processes and priorities with our Chief Privacy
Officers.
Political and Trade Association Activities
Our code of conduct, statement on political and trade association activities,
semi-annual political contributions reports and annual tax-exempt organization disclosures provide information about our political,
lobbying and trade association activities. Our Governance and Corporate Responsibility Committee is responsible for overseeing
our political, lobbying and trade association activities. In 2021, we received the leading “Trendsetter” designation
from the CPA Zicklin Index of Corporate Political Disclosure and Accountability for our transparency and accountability in political
and trade association disclosure, policy and oversight.
Integrity
Our company’s culture is built on integrity and respect, and we
believe that all of our employees have a responsibility to promote the highest ethical standards and comply with the law everywhere
we operate. As set forth in our code of conduct, our principles of business conduct guide us to act with integrity in everything
we do, including a commitment to do what’s right for our employees, customers, audiences, investors and the communities
we serve. We are committed to creating an environment where employees feel comfortable asking questions, raising concerns and
speaking up without fear of retaliation, and we believe that we have effective and well-communicated channels in place for employees
to report concerns.
12
Table of Contents
Corporate Governance and Board
Matters
Proposal 1: ELECTION OF DIRECTORS
|
 |
Our Board unanimously recommends that shareholders vote “FOR” the election of each of the nominees for director. |
Board
of Directors Nominees
Board Snapshot

| * |
See “—Director Skills, Experience
and Diversity” below and Nasdaq Board Diversity Matrix in Appendix B for additional information. |
| ** |
Audit Committee Financial Expert |
Board Nominees Non-independent – 1 I
Kenneth J. Bacon, 67 Independent Director Director Since: November 2002 Committee Membership: Governance and Corporate Responsibility
Committee Madeline S. Bell, 60 Independent Director Director Since: February 2016 Committee Membership: Governance and Corporate
Responsibility Committee Edward D. Breen, 66 Lead Independent Director Director Since: February 2014 Committee Membership: Compensation
and Human Capital Committee Gerald L. Hassell, 70 Independent Director Director Since: May 2008 Committee Membership: Compensation
and Human Capital Committee Jeffrey A. Honickman, 65 Independent Director Director Since: December 2005 Committee Membership: Audit**
and Governance and Corporate Responsibility Committees Maritza G. Montiel, 70 Independent Director Director Since: June 2018 Committee
Membership: Audit Committee** Asuka Nakahara, 66 Independent Director Director Since: February 2017 Committee Membership: Audit
Committee David C. Novak, 69 Independent Director Director Since: December 2016 Committee Membership: Compensation and Human Capital
Committee Brian L. Roberts, 62 Chairman of the Board, President and CEO Director Since: March 1988 Committee Membership: None INDEPENDENCE
DIVERSITY (GENDER & RACE)* INDEPENDENT DIRECTOR TENURE Independent: 89% Independent - 8 Non-independent - 1 Diverse: 44% Female
- 22% Racial/Ethnic Diversity - 33% Average Tenure: 10 years < 6 years - 3 >10 years - 3 6-10 years - 2
2022 Proxy Statement 13
Table of Contents
Director Skills, Experience and
Diversity
As baseline director qualifications, our Board seeks,
and each of our directors possesses, key attributes that we deem critical in being a director, including strong and effective
decision-making, communication and leadership skills; high ethical standards, integrity and values; and a commitment to representing
the long-term interests of our shareholders. Our Board also strives to balance the need to have directors with a diversity of
skills, backgrounds, experiences, perspectives and viewpoints, areas of expertise and knowledge, while including gender and racial
and ethnic representation.
Our Board and each of its committees assess their
effectiveness in this regard as part of their annual self-assessment which, among other things, evaluates the overall composition
of our Board, including the diversity of skills and backgrounds of our directors. Our Governance and Corporate Responsibility
Committee focuses on certain specific director qualifications and skills, including those highlighted below, to select directors
that bring to the Board a diversity of experience, qualifications, skills, viewpoints and perspectives to oversee and address
the current issues facing our company. Our Governance and Corporate Responsibility Committee considers these qualifications, including
with respect to gender and racial and ethnic diversity, as it seeks to identify and evaluate potential new directors. In evaluating
current directors for renomination to the Board or reappointment to Board committees, the Committee also assesses the director’s
performance, as well as the current challenges and needs of the Board and each committee.
To eliminate even the appearance of a potential
conflict stemming from a directorship of a family member of Ms. Naomi Bergman on the board of Discovery following its merger with
WarnerMedia, Ms. Bergman is not a nominee for director at our 2022 annual meeting and her term will end on the date of our annual
meeting in June. We are grateful to Ms. Bergman for her service on our Board. The size of the Board will be reduced to nine directors,
effective upon the convening of the 2022 annual meeting. Our Governance and Corporate Responsibility Committee recognizes the
value of diversity of backgrounds and experiences among its membership and is committed to diversity on our Board as it seeks
to identify its next director.
The Governance and Corporate Responsibility Committee
also considers each director’s ability to dedicate sufficient time, energy and attention to the fulfillment of his or her
duties when it nominates directors each year. In accordance with our corporate governance guidelines, an independent director
who is a chief executive officer of a public company may serve on the boards of no more than two other public companies in addition
to our Board, while all other independent directors may serve on up to five public company boards in total. The Board also considers
directors’ other obligations and commitments, including leadership positions the director may hold on other boards, in assessing
directors’ ability to serve on our Board. In renominating directors for election at our 2022 annual meeting, the Committee
and Board have determined that each of our directors is currently in compliance with our corporate governance guidelines and has
sufficient time, energy and attention to serve on our Board. For example, as part of this determination, the Committee and the
Board have considered that Mr. Breen serves as the executive chairman and chief executive officer of DuPont de Nemours, Inc. and
serves as a director of International Flavors & Fragrances, Inc., which merged with DuPont’s nutrition and biosciences
business in 2021.
14
Table of Contents
Below are the skills of our director nominees:
| |
|
 |
 |
 |
 |
 |
 |
 |
 |
 |
 |
Current/Former CEO/President/Executive
Officer |
 |
|
|
|
|
|
|
|
|
 |
Internet/Video/Wireless Industry |
|
|
|
|
|
|
|
|
|
 |
Media Industry |
|
|
|
|
|
|
|
|
|
 |
Consumer Products/Customer-Oriented |
|
|
|
|
|
|
|
|
|
 |
Technology |
|
|
|
|
|
|
|
|
|
 |
Financial/Accounting |
|
|
|
|
|
|
|
|
|
 |
Risk Management Oversight |
|
|
|
|
|
|
|
|
|
 |
International |
|
|
|
|
|
|
|
|
|
 |
Government Affairs |
|
|
|
|
|
|
|
|
|
 |
Human Capital Management |
|
|
|
|
|
|
|
|
|
 |
Non-Profit/Educational/Philanthropic |
|
|
|
|
|
|
|
|
|
 |
Gender* |
M |
F |
M |
M |
M |
F |
M |
M |
M |
 |
Race/Ethnicity* |
B |
W |
W |
W |
W |
H |
A |
W |
W |
| * |
F – Female; M – Male; A – Asian;
B – Black or African American; H – Hispanic or Latinx; W – White. |
| |
See also Nasdaq Board Diversity Matrix in Appendix B. |
2022 Proxy Statement 15
Table of Contents
Director Nominee Biographies
Kenneth J. Bacon
INDEPENDENT
Partner at RailField Partners
Age: 67
Director since: November 2002
Committees: Governance and Corporate Responsibility
OTHER CURRENT
PUBLIC COMPANY DIRECTORSHIPS:
Ally Financial Inc., Arbor Realty Trust, Inc., Welltower Inc.
FORMER
PUBLIC COMPANY DIRECTORSHIPS:
Forest City Realty Trust
|
 |
CAREER
HIGHLIGHTS:
| ● |
Partner, RailField Partners, a financial advisory and asset management firm,
2012 – Present |
| ● |
Executive Vice President of the multifamily mortgage business, Fannie Mae,
2005 – 2012 |
| ● |
Interim Executive Vice President, Housing and Community Development, Fannie
Mae, January 2005 – July 2005 |
| ● |
Member, National Multifamily Housing Council |
QUALIFICATIONS:
We believe that Mr. Bacon’s significant experience
in senior executive leadership, regulatory and government affairs, risk management and the financial and housing industries renders
him qualified to serve as one of our directors.
Madeline S. Bell
INDEPENDENT
President and Chief Executive
Officer of The Children’s Hospital of Philadelphia
Age: 60
Director since: February 2016
Committees: Governance and Corporate Responsibility
|
 |
CAREER
HIGHLIGHTS:
| ● |
President and Chief Executive Officer, The Children’s Hospital of Philadelphia
(“CHOP”), a top-ranked children’s health system and research institute with 23,000 employees and over $3.2 billion
of annual revenue, 2015 – Present |
| ● |
Multiple Leadership Roles, including Chief Operating Officer, CHOP, 1995
– 2015 |
| ● |
Began career as a pediatric nurse in 1983, moved from a variety of different
nursing roles into hospital administration in 1989 and holds a Master of Science in Organizational Dynamics from the University
of Pennsylvania |
| ● |
Board Chair, Federal Reserve Bank of Philadelphia |
| ● |
Board Member, Leonard Davis Institute of Health Economics |
| ● |
Board Member, Solutions for Patient Safety |
| ● |
Executive Committee Member, Greater Philadelphia Chamber of Commerce and
Member, CEO Council for Growth |
QUALIFICATIONS:
We believe that Ms. Bell’s experience and
leadership of CHOP, including her oversight of risk management efforts, and her experience in the non-profit community render
her qualified to serve as one of our directors.
16
Table of Contents
Edward D. Breen
LEAD
INDEPENDENT DIRECTOR
Chief Executive Officer and Executive
Chairman of DuPont de Nemours, Inc.
Age: 66
Director since: February 2014
Committees: Compensation and Human Capital
OTHER
CURRENT PUBLIC COMPANY DIRECTORSHIPS:
DuPont de Nemours, Inc., International Flavors &
Fragrances, Inc.
FORMER
PUBLIC COMPANY DIRECTORSHIPS:
Corteva, Inc., DowDuPont Inc.
|
 |
CAREER
HIGHLIGHTS:
| ● |
Chief Executive Officer (since 2020) and Executive Chairman (since 2019),
DuPont de Nemours, Inc., a provider of technology-based materials, ingredients and solutions |
| ● |
Chief Executive Officer and Chairman, DowDuPont and predecessors, 2015 –
2019 |
| ● |
Chief Executive Officer, Tyco International Ltd., 2002 – 2012; Chairman
until 2016 |
| ● |
Previous President and Chief Operating Officer, Motorola, and multiple leadership
roles, Motorola’s Networks Sector and Motorola’s Broadband Communications Sector |
| ● |
Chairman, President and CEO, General Instrument Corporation, 1997 –
2000 |
| ● |
Previously a director of Comcast from 2005 – 2011 |
| ● |
Chair of the Board of Trustees, Grove City College |
| ● |
Member of the Board of Trustees, Lebanon Valley College |
| ● |
Member of the Board of Trustees, The Hun School of Princeton |
QUALIFICATIONS:
We believe that Mr. Breen’s extensive experience
in the technology, equipment supplier and consumer product sectors, notably as those sectors relate to the internet, video and
wireless industries, including his various experiences as a president and chief executive officer and in the oversight of business
strategies and risk management efforts, renders him qualified to serve as one of our directors.
Gerald L. Hassell
INDEPENDENT
Former Chief Executive Officer
of The Bank of New York Mellon
Age: 70
Director since: May 2008
Committees: Compensation and Human Capital
OTHER CURRENT
PUBLIC COMPANY DIRECTORSHIPS:
MetLife, Inc.
FORMER
PUBLIC COMPANY DIRECTORSHIPS:
The Bank of New York Mellon
|
 |
CAREER
HIGHLIGHTS:
| ● |
Chief Executive Officer and Chairman, The Bank of New York Mellon, a financial
services corporation, 2011 – 2017 |
| ● |
President, The Bank of New York Company, Inc. and The Bank of New York, 1998
– 2011 |
| ● |
Member of the Board of Trustees, Duke University |
| ● |
Member of the Board of Directors, Duke University Health System |
QUALIFICATIONS:
We believe that Mr. Hassell’s significant
experience and leadership in the financial industry, including with respect to consumer financial products, as well as his prior
experience as a president and chief executive officer and in the oversight of risk management efforts, render him qualified to
serve as one of our directors.
2022 Proxy Statement 17
Table of Contents
Jeffrey A. Honickman
INDEPENDENT
Chief Executive Officer of Pepsi-Cola &
National Brand Beverages, Ltd.
Age: 65
Director since: December 2005
Committees: Audit and Governance and Corporate Responsibility
|
 |
CAREER
HIGHLIGHTS:
| ● |
Chief Executive Officer, Pepsi-Cola & National Brand Beverages,
Ltd., a bottling and distribution company, which includes among its affiliates Pepsi-Cola Bottling Company of New York, Inc. and
Canada Dry bottling companies from New Jersey to Virginia, 1990 – Present |
| ● |
Vice President and Secretary of Antonio Origlio Inc., a beverage distributor
based in Philadelphia, Pennsylvania, which does business as Origlio Beverages, 1987 – Present |
| ● |
Member of the Board of Directors, American Beverage Association |
| ● |
Member of Board of Trustees, Barnes Foundation |
| ● |
Member of President’s Advisory Council, Sidney Kimmel Cancer Center,
Jefferson Health |
QUALIFICATIONS:
We believe that Mr. Honickman’s significant
experience in the wholesale and consumer products industries, including his experience as a chief executive officer, renders him
qualified to serve as one of our directors.
Maritza G. Montiel
INDEPENDENT
Former Deputy Chief Executive
Officer and Vice Chairman of Deloitte LLP
Age: 70
Director since: June 2018
Committees: Audit
OTHER
CURRENT PUBLIC COMPANY DIRECTORSHIPS:
AptarGroup, Inc., McCormick & Company,
Incorporated, Royal Caribbean Group
|
 |
CAREER
HIGHLIGHTS:
| ● |
Deputy Chief Executive Officer and Vice Chairman, Deloitte LLP, 2011 – 2014 |
| ● |
Numerous senior management roles at Deloitte, including: |
| |
● |
Managing Partner (Leadership Development and Succession, Deloitte University),
2009 – 2011 |
| |
● |
Regional Managing Partner, 2001 – 2009 |
| ● |
Advisory Partner for many public company clients where Deloitte was the principal auditor |
| ● |
Member of Deloitte’s U.S. and Global Board of Directors |
| ● |
Member of the Board of Trustees, Baptist Health South Florida |
QUALIFICATIONS:
We believe that Ms. Montiel’s extensive experience
and leadership in the accounting profession, including her experience as the former Deputy Chief Executive Officer and Vice Chairman
of Deloitte and in the oversight of risk and compliance efforts, render her qualified to serve as one of our directors.
18
Table of Contents
Asuka Nakahara
INDEPENDENT
Partner at Triton Atlantic Partners
Age: 66
Director since: February 2017
Committees: Audit
OTHER CURRENT
PUBLIC COMPANY DIRECTORSHIPS:
CBRE Global Real Estate Income Fund
|
 |
CAREER
HIGHLIGHTS:
| ● |
Partner, Triton Atlantic Partners, a real estate advisory firm and investment
vehicle that he co-founded, 2009 – Present |
| ● |
Associate Director, Zell-Lurie Real Estate Center, and Practice Professor,
Real Estate Department, Wharton School of the University of Pennsylvania, 1999 – Present |
| ● |
Trammell Crow Company, various leadership roles including Chief Financial
Officer (overseeing finance, capital markets, mergers and acquisitions, marketing, Trammell Crow University, human resources and
other new business initiatives), 1980 – 1999 |
QUALIFICATIONS:
We believe that Mr. Nakahara’s extensive knowledge
of real estate and general advisory matters, including his leadership and academic experiences, as well as his prior experience
as a chief financial officer, render him qualified to serve as one of our directors.
David C. Novak
INDEPENDENT
Founder of David Novak Leadership,
Inc.
Age: 69
Director since: December 2016
Committees: Compensation and Human Capital
|
 |
CAREER HIGHLIGHTS:
| ● |
Founder of David Novak Leadership, Inc., which provides online leadership
training to transform managers into confident, capable, engaging leaders, 2020 – Present |
| ● |
Executive Chairman of the Board, YUM! Brands, Inc., 2015 – 2016 |
| ● |
Chairman of the Board, YUM! Brands, Inc., 2001 – 2014 |
| ● |
Chief Executive Officer, YUM! Brands, Inc., 2000 – 2014 |
| ● |
Board Member, Lift-a-Life Novak Family Foundation |
| ● |
Author of O GREAT ONE! A little Story About the Awesome Power of Recognition,
Taking People With You: The Only Way to Achieve Big Things and co-author of Take Charge of You, dedicated to developing
leaders at every stage of life |
QUALIFICATIONS:
We believe that Mr. Novak’s extensive knowledge
of customer service-oriented business practices and talent management, as well as his prior experience as a chief executive officer
and chairman, render him qualified to serve as one of our directors.
2022 Proxy Statement 19
Table of Contents
Brian L. Roberts
Chairman, President and Chief
Executive Officer of Comcast
Age: 62
Director since: March 1988
Committees: None
|
 |
CAREER
HIGHLIGHTS:
| ● |
Chairman of the Board, Comcast, 2004 – Present |
| ● |
Chief Executive Officer, Comcast, 2002 – Present |
| ● |
President, Comcast, 1990 – Present |
| ● |
Director Emeritus, CableLabs, the cable industry’s research and development
consortium |
As of December 31, 2021, Mr. Roberts, through his
ownership of our Class B common stock, had sole voting power over 33 1/3% of the combined voting power of our two classes of voting
common stock.
QUALIFICATIONS:
We believe that Mr. Roberts’ extensive experience
and leadership in the internet, video, phone, media and entertainment and wireless industries, including as our Chairman, President
and Chief Executive Officer and in the oversight of business strategies and risk management efforts, render him qualified to serve
as one of our directors.
Independence Determinations
Our Board has determined that each of our nine nonemployee
directors (including Ms. Bergman, who is not a nominee for director at our 2022 annual meeting) is independent in accordance with
the director independence definition specified in our corporate governance guidelines, which are posted under “Corporate
Governance” in the Investors section of our website at www.cmcsa.com, and in
accordance with applicable Nasdaq rules. In making its independence determinations, our Board considered transactions and relationships
between each director or any member of his or her immediate family and us, including those reported under “Related Party
Transactions Policy and Certain Transactions” below. The Board also considered that in the ordinary course of business we
have, during the current year and the past three fiscal years, sold products and services to, purchased products and services
from, and/or made charitable donations (including by certain of our executive officers) to companies and organizations at which
certain of our directors are currently an executive officer or a significant shareholder. In each case, the amount paid or donated
to or received from these companies and organizations each year was below 1% of the recipient company’s or organization’s
total consolidated gross revenues, which is far below the 5% limit prescribed by Nasdaq rules.
Retirement Age, Director Tenure
and Director Emeritus Program
Our corporate governance guidelines require that
our independent directors not stand for re-election to the Board after reaching the age of 72. We believe that our retirement
policy and natural turnover achieve the appropriate balance between maintaining longer-term directors with deep institutional
knowledge and refreshing the Board with new directors and different areas of expertise and knowledge, while including gender and
racial and ethnic representation.
Our Board considers director tenure in connection
with its independence determinations, even though neither our corporate governance guidelines nor Nasdaq or SEC rules deem a long-tenured
director not independent. Following the annual meeting of shareholders, if all director nominees are elected to serve as our directors,
the average tenure of our independent directors will be 10 years.
Our Board has created a director emeritus program
to avail itself of the counsel of retiring directors who have made and can continue to make a unique contribution to the deliberations
of the Board. A director emeritus may provide advisory services as requested from time to time and may be invited to attend meetings
of the Board, but may not vote, be counted for quorum purposes or have any of the duties or obligations imposed on our directors
or officers under applicable law or otherwise be considered a director. Sheldon M. Bonovitz was designated as a director emeritus
following our 2020 annual meeting.
20
Table of Contents
Director Nominations
Identifying
and Evaluating Director Nominees
Our Governance and Corporate Responsibility Committee
will consider director candidates nominated or recommended by shareholders and will evaluate any such candidates in a similar
manner as any other candidates. In identifying and evaluating candidates, whether recommended by the Committee or by shareholders,
the Committee will consider an individual’s professional knowledge, business, financial and management expertise, industry
knowledge, entrepreneurial background and experience, as well as applicable independence requirements. The Committee also gives
significant consideration to the current composition and diversity of our Board, including with respect to the skills set forth
above, as well as age, backgrounds, experiences, perspectives, viewpoints and gender and racial and ethnic representation.
Shareholder
Nominees
To submit a nomination for
the election of directors, shareholders must provide a written notice in accordance with Section 3.10 of our by-laws. For the
election of directors at the 2023 annual meeting of shareholders, if such meeting is called for a date between May 2, 2023
and July 1, 2023, we must receive written notice at the mailing address given on page 82 on or after February 1, 2023 and no
later than March 3, 2023. If we call the 2023 annual meeting of shareholders for any other date, we must receive written
notice no later than the close of business on the tenth day following the day we mailed notice of, or announced publicly, the
date of the meeting, whichever occurs first. In addition to satisfying the deadlines in the advance notice provisions of our
by-laws, a shareholder who intends to solicit proxies in support of nominees submitted under these advance notice provisions
must provide the notice required under Rule 14a-19 no later than April 2, 2023.
In addition, in accordance with Section 3.11 of
our by-laws, a shareholder or group of up to 20 shareholders owning at least 3% of the aggregate number of our outstanding shares
of common stock continuously for at least three years may nominate and include in our proxy materials director nominees constituting
up to the greater of 20% of our Board or two directors, provided the shareholder(s) and nominee(s) satisfy the requirements in
our by-laws. Written notice of proxy access director nominees for the election of directors at the 2023 annual meeting of shareholders,
if such meeting is called for a date between May 2, 2023 and July 1, 2023, must be received at the mailing address given on page
82 on or after November 23, 2022 and no later than December 23, 2022. If such meeting is called for any other date, we must receive
written notice no later than the close of business on the later of the date that is 180 days prior to such meeting or the tenth
day following the date the meeting is first publicly announced or disclosed.
Shareholders can obtain a copy of our by-laws by
writing to Thomas J. Reid, Secretary, Comcast Corporation, at the mailing address given on page 82. A copy of our by-laws is filed
with the SEC as an exhibit to our Annual Report on Form 10-K for the year ended December 31, 2021 and is posted on our website
under “Corporate Governance” in the Investors section of our website at www.cmcsa.com.
Board
Structure and Responsibilities
Board Leadership Structure
Our Board believes that we and our shareholders
are best served by maintaining the flexibility for the Board to split or combine the offices of Chairman and Chief Executive Officer
based upon a contemporaneous determination of what is in the best interests of our company at a given point in time. To that end,
our Board regularly reviews our Board leadership structure.
Our Board believes that we and our shareholders
are currently best served by having Mr. Roberts serve as both our Chairman and Chief Executive Officer. Mr. Roberts is a strong
and effective leader, at both the company and Board levels, who provides critical leadership in carrying out our strategic initiatives
and confronting our challenges. Mr. Roberts serves as an effective bridge between the Board and management, facilitating strong
collaboration and encouraging open lines of communication with the Board.
Our independent directors are led by our Lead Independent
Director, who ensures a strong, independent and active Board by promoting effective communication and consideration of matters
presenting significant risks to the Company through his role in developing the Board’s meeting agendas, advising committee
chairs and facilitating communications between independent directors and the Chairman and Chief Executive Officer. Our independent
directors provide guidance and oversight of senior management and regularly meet without management as part of Board and committee
meetings to review, among
2022 Proxy Statement 21
Table of Contents
other things, our strategy, performance, management
effectiveness and succession planning. As part of our annual Board assessment process, our independent directors also provide
input on key business and director educational topics for the following year’s Board and committee meeting agendas.
Edward
D. Breen
LEAD INDEPENDENT DIRECTOR
|
In accordance with our corporate governance guidelines,
our Board has a strong Lead Independent Director position, currently filled by Mr. Breen. The Lead Independent Director:
| ● |
Chairs meetings of the Board at which the Chairman
is not present. |
| ● |
Facilitates communication between the Chairman and the independent
directors and encourages director participation by fostering an environment of open dialogue and constructive feedback among
independent directors. |
| ● |
Communicates periodically as necessary between Board meetings and
executive sessions with our independent directors, following discussions with management and otherwise on topics of importance
to our independent directors. |
| ● |
Consults with our independent directors concerning the need for an
executive session in connection with each regularly scheduled Board meeting. |
| ● |
Is authorized to schedule meetings of the independent
directors, including executive sessions of the independent directors. |
| ● |
Consults, reviews and has the opportunity to provide input on meeting
agendas and meeting schedules for the Board. |
| ● |
With the Compensation and Human Capital Committee, organizes the
annual Board evaluation of the performance of our Chief Executive Officer and senior management. |
| ● |
With the Governance and Corporate Responsibility Committee, reviews
and approves the process for the annual self-assessment of our Board and its committees. |
| ● |
Represents independent directors in communications with external
constituencies, as appropriate. |
The role of Lead Independent Director is filled
by an independent director recommended by the Governance and Corporate Responsibility Committee, which is composed entirely of
independent directors, and appointed by the Board annually.
In addition to the Lead Independent Director position,
our Board believes that Board independence and oversight of management are effectively maintained through the Board’s composition,
where 89% of our director nominees are independent, and through our Audit, Compensation and Human Capital and Governance and Corporate
Responsibility Committees, which are composed entirely of independent directors. Moreover, having one individual perform the roles
of Chairman and Chief Executive Officer is not restricted or prohibited by current laws or regulations, and all of our directors,
including our Chairman, are bound by fiduciary obligations under law to act in a manner that they believe to be in the best interests
of our company.
Board Meetings and Attendance
Our Board and various committees of the Board meet
throughout the year. During 2021, there were five meetings of our Board and a total of 21 committee meetings. Each director attended
more than 75% of the aggregate number of Board meetings and the number of meetings held by all of the committees on which he or
she served.
We require our directors to participate in the annual
meeting of shareholders, barring unusual circumstances. Each director then in office participated in the 2021 annual meeting of
shareholders.
Our independent directors have the opportunity to
meet separately in executive session following each regularly scheduled Board and committee meeting and, under our corporate governance
guidelines, are required to meet in executive session at least two times each year. In 2021, executive sessions were held at each
regularly scheduled Board meeting, and most regularly scheduled committee meetings.
22
Table of Contents
Committees of Our Board
Our Board has three standing committees: Audit,
Compensation and Human Capital, and Governance and Corporate Responsibility. All of these committees are composed entirely of
independent directors under applicable Nasdaq and SEC requirements.
The Board makes committee and committee chair assignments
annually at its meeting immediately preceding the annual meeting of shareholders, although further changes may be made from time
to time as deemed appropriate by the Board.
Each committee has a Board-approved charter, which
is reviewed annually by the respective committee, with the Governance and Corporate Responsibility Committee annually reviewing
all charters and our corporate governance guidelines. Each committee has the authority to retain independent advisors to assist
it in carrying out its responsibilities. Committee charters are posted under “Corporate Governance” in the Investors
section of our website at www.cmcsa.com.
Audit Committee
Members
Jeffrey A. Honickman (Chair)
Naomi G. Bergman*
Maritza G. Montiel
Asuka Nakahara
Meetings
in 2021: 10
|
 |
KEY RESPONSIBILITIES
| ● |
Reviews the quality and integrity of our financial
statements. |
| ● |
Reviews the financial statements and “Management’s Discussion
and Analysis of Financial Condition and Results of Operations” in our Forms 10-Q and 10-K and our quarterly earnings
press releases. |
| ● |
Monitors our internal control over financial reporting and disclosure
controls and procedures. |
| ● |
Reviews the performance and responsibilities of our internal audit
function and activities. |
| ● |
Appoints and evaluates the qualification, performance and independence
of our independent auditors. |
| ● |
Reviews financial risk assessment and management, cybersecurity and
significant business continuity risks. |
| ● |
Reviews process with respect to our ERM assessment. |
| ● |
Reviews risks facing our company as disclosed in “Risk Factors”
in our Form 10-K. |
| ● |
Reports its discussions to the full Board for consideration and action
when appropriate. |
Each member of our Audit Committee is financially
literate for audit committee purposes, and our Board has concluded that Jeffrey A. Honickman and Maritza G. Montiel qualify as
audit committee financial experts.
The Audit Committee Report is included on page 59.
| * |
Ms. Bergman is not a nominee for director at our
2022 annual meeting. |
2022 Proxy Statement 23
Table of Contents
Compensation and Human Capital Committee
Members
Edward D. Breen (Chair)
Gerald L. Hassell
David C. Novak
Meetings
in 2021: 6
|
 |
KEY RESPONSIBILITIES
| ● |
Oversees and sets compensation for our senior
executives. |
| ● |
Performs an annual review of our compensation philosophy, executive
compensation programs and the performance of senior executives, including our named executive officers (“NEOs”). |
| ● |
Evaluates annually whether there are any risks associated with our
executive compensation program. |
| ● |
Oversees succession planning for senior management. |
| ● |
Reviews compensation and benefit plans and policies generally, including
with respect to compensation of our senior executives and other employees. |
| ● |
Reviews programs and strategies with respect to human capital management,
including with respect to talent recruitment, development and retention, employee engagement and workforce composition. |
| ● |
Reports its discussions to the full Board for consideration and action
when appropriate. |
Each member of our Compensation and Human Capital
Committee qualifies as a “non-employee director” under Rule 16b-3 under the Securities Exchange Act of 1934.
The Compensation and Human
Capital Committee Report is included on page 46.
Governance and Corporate Responsibility Committee
Members
Kenneth J. Bacon (Chair)
Madeline S. Bell
Jeffrey A. Honickman
Meetings
in 2021: 5
|
 |
KEY RESPONSIBILITIES
| ● |
Provides general oversight of corporate governance. |
| ● |
Oversees culture of compliance and ethical business conduct, including
compliance program. |
| ● |
Reviews significant legal and regulatory compliance risks, such as
privacy. |
| ● |
Oversees, monitors and receives reports on workplace harassment and
discrimination matters. |
| ● |
Reviews and assesses our corporate social responsibility report and
significant environmental and social issues, risks and trends, including by receiving periodic reports on DE&I initiatives
and matters. |
| ● |
Oversees our approach to political and lobbying activities, including
by receiving periodic reports on our political contributions, lobbying and trade association activities. |
| ● |
Reports its discussions to the full Board for consideration and action
when appropriate. |
24
Table of Contents
Board
and Committee Strategy, Risk and Environmental, Social and Governance (“ESG”) Oversight Responsibilities
Our Board and its committees provide guidance to and oversight of
management with respect to our business strategy throughout the year. Various elements of strategy are discussed at every Board
meeting, and our management is charged with executing the business strategy and updating the Board on progress and execution throughout
the year.
While active risk management is primarily the responsibility of our
management, our Board understands the significant risks facing our company, including those related to relevant ESG issues, and
exercises, as a whole and through its committees, an appropriate degree of risk oversight. Our management, with involvement and
input from our Board, performs a companywide enterprise risk management (“ERM”) assessment to identify key risks and
to manage and mitigate the significant strategic, operational and legal risk areas for our company. Our executive management team
has the overall responsibility for, and oversight of, this process, and an ERM steering committee composed of legal, financial
and business executives manages the process, with one or more senior business executives then monitoring and managing each of the
identified risks. Regular business presentations and discussions throughout the year at the Board or its committees highlight significant
relevant risks and exposures, including those listed below as core enterprise risks identified through our ERM process.
Our Board and its committees exercise their respective roles in strategy,
risk oversight and oversight of significant ESG matters in a variety of ways, as set forth below. Certain matters may be addressed
by both the Board and its committees. Our Board oversees the core enterprise risks identified through our ERM process for Board-level
oversight (either as a whole or as delegated to its committees), and each Board committee addresses the risks that fall within
its area of responsibility. Each committee also reports its discussions to the full Board for consideration and action when appropriate.
| |
| |
Board
of Directors |
|
| |
Oversight
of Core Enterprise Risks |
|
| |
Competitive
Risks |
Reputational
Risks |
Succession
Planning |
Capital
Allocation |
Cybersecurity &
Privacy |
Legal &
Regulatory |
|
| |
|
|
|
|
|
|
|
 |
|
|
|
|
Audit
Committee |
|
Compensation &
Human
Capital Committee |
|
Governance &
Corporate
Responsibility Committee |
|
Oversight of ERM assessment process, as well as:
● Financial reporting
and accounting matters
● Internal controls
● Financial risks
● Cybersecurity and business
continuity |
|
Oversight of:
● Executive compensation
program
● Nonemployee director
compensation
● Human capital management,
including talent recruitment, development and retention, employee engagement and workforce composition |
|
Oversight of:
● Corporate governance
and compliance
● Legal and regulatory
matters, including privacy
● Harassment and discrimination
matters
● DE&I matters
● Political and lobbying
activities
● Annual corporate responsibility
reporting, which includes significant environmental and social issues, risks and trends |
2022 Proxy Statement 25
Table of Contents
Corporate
Governance Practices, Policies and Processes
Corporate
Governance Highlights
As described in more detail elsewhere in this proxy statement, below
are highlights of our corporate governance structure.
| |
|
|
|
|
| |
Board
Independence/Composition |
|
Corporate
Governance |
|
| |
● Strong Lead Independent Director,
with Defined Role and Responsibilities
● 89% of Director Nominees
are Independent
● Director Tenure Considered
in Annual Board Director Independence Determinations
● All Members of Board Committees
are Independent
● Opportunity for Executive
Sessions at Every Board and Committee Meeting
● 44% of Director Nominees
are Diverse by Gender or Race
● 33% Racial/Ethnic Diversity
● 22% Female
● Compensation and Human Capital
Committee Directly Retains Independent Compensation Consultant |
|
● 3 New Independent Directors
within Past 6 Years
● Average Tenure of Independent
Directors is 10 Years
● Mandatory Independent Director
Retirement at 72
● Director “Overboarding”
Policy
● Annual Board Assessment Process
● Robust Shareholder Engagement
Program
● Met with over 40 investors
owning over 50% of Class A common stock on Governance, Compensation and other ESG matters
● Annual Director Elections
● Proxy Access By-Law
● Recoupment (“Clawback”)
Policy for Executive Compensation
● No Automatic Acceleration
of Vesting in Connection with a Change in Control |
|
| |
|
|
|
|
| |
|
|
|
|
| |
Board Performance |
|
Stock Ownership
Requirements |
|
| |
● Annual Board and Committee
Evaluations
● Board/Committee Oversight
of Strategy, Significant Company Risks and ESG Matters
● Annual Board and Compensation
and Human Capital Committee Discussion of Succession Planning for CEO and Senior Executives
● Director Education on Key
Company Topics and Issues, Including as Requested by Independent Directors |
|
● NEOs and Nonemployee Directors
Subject to and in Compliance with Robust Stock Ownership Requirements
● CEO = 10x Salary
● Other NEOs = 3x Salary
● Nonemployee Directors = 5x
Annual Cash Retainer
● No Dividend Equivalents Paid
on Unearned Restricted Stock Units (“RSUs”) or on Any Stock Options
● Prohibition on Hedging and
Pledging Comcast Stock |
|
26
Table of Contents
Succession
Planning
Ensuring that we have the appropriate senior management talent to
successfully pursue our strategies is one of the Board’s primary responsibilities. To this end, the Board discusses succession
planning for our CEO and the remainder of our senior executive management team in private sessions at most of its regularly scheduled
meetings. To help fulfill the Board’s responsibility, our Compensation and Human Capital Committee is required, pursuant
to our corporate governance guidelines, to ensure that we have in place appropriate planning to address CEO succession both in
the ordinary course of business and in emergency situations. Our CEO succession planning includes criteria that reflect our business
strategies, such as identifying and developing internal candidates. Our corporate governance guidelines also require that our Compensation
and Human Capital Committee ensures that we have appropriate succession planning for the remainder of our senior executive management
team, including our NEOs. Each year, our Board and Compensation and Human Capital Committee formally discuss succession planning
for our senior executive management team and their respective direct reports.
Board and Committee Evaluations
Every year, our Board and each of its committees perform a self-assessment
to evaluate their effectiveness. As part of these assessments, each director completes a detailed questionnaire for the Board and
any committees on which he or she serves, addressing topics such as Board structure and composition, Board responsibilities, Board
meetings and materials, Board and management interactions and ethics and compliance. The questionnaire seeks both quantitative-based
responses and general comments. The Governance and Corporate Responsibility Committee reviews and approves the process and the
questionnaires to be used, with outside counsel also reviewing the questionnaires. The results of the assessments are compiled
anonymously and are reviewed and discussed with the Board and the Governance and Corporate Responsibility Committee (as it relates
to both the Board and all committees), each committee (as it relates to such committee) and, as appropriate, any individual director.
In addition to the formal evaluation process, directors provide feedback on the Board’s and its committees’ performance
on an ongoing basis. The Governance and Corporate Responsibility Committee develops action plans for items that may require follow-up,
and it also coordinates recommendations for key business and director educational topics for the following year’s Board and
committee meeting agendas.
Corporate
Governance Guidelines and Code of Conduct
Our Board has adopted corporate governance guidelines that address
items such as the standards, qualifications and responsibilities of our directors and director candidates and corporate governance
policies and standards applicable to us in general. We also have a code of conduct that applies to all of our employees, including
our executive officers, and our directors. Both the guidelines and the code of conduct applicable to our executive officers and
directors are posted under “Corporate Governance” in the Investors section of our website at www.cmcsa.com.
We will disclose under “Corporate Governance” in the Investors section of our website any amendments to, or any waivers
under, the code of conduct that are required to be disclosed by the rules of the SEC or Nasdaq.
2022 Proxy Statement 27
Table of Contents
Shareholder
Engagement
We have an active, broad-based and year-round investor relations outreach
program to solicit input and to communicate with shareholders on a variety of topics. In addition to our regular investor relations
program that reviews our business and strategy with buy-side investors and securities analysts, we engage with investors on various
corporate governance, compensation and other environmental and social (“E&S”) topics. This dialogue provides an
opportunity to discuss governance matters generally, including our directors’ skills and tenure, Board oversight roles and
responsibilities, E&S initiatives and executive compensation.
The key elements of our investor relations outreach program are below:

• Focused, one-on-one meetings with investors, senior management
and, at times, independent directors, on a range of governance, compensation and E&S matters, as well as general business and
strategy updates • Meetings with proxy advisory firms • Live webcasts of quarterly earnings presentations • Live
webcasts of CEO, CFO and other business leaders speaking at investor conferences • Met with over 350 investors on strategy
and business results through a combination of group meetings and one-on-one meetings • Discussions with most proponents of
shareholder proposals before proxy statement filed • Meetings with investors to discuss annual meeting proposals • Review
and consider shareholder voting results Governance and E&S Engagements Annual Meeting Round Engagement Investor Relations Year-
Investor Feedback Outcomes from • Board and/or its committees review and consider annual meeting voting results and investor
feedback received from engagements • As a result of these meetings, over the past year: • Implemented multiple changes
to our executive compensation program (see pages 31-32) • Provided additional E&S disclosures in 2021, available on our
ESG Reporting website www.cmcsa.com/esg-reporting, including: • supplementing our current DE&I reporting with information
from EEO-1 reports • increasing information on trade association lobbying • reporting for the first time consistent with
both SASB and TCFD frameworks
| |
| Over past year, met with over 40 investors owning over 50% of Class A common stock on governance,
compensation and E&S matters. |
Our Board has established a process for shareholders and other interested
parties to communicate with its members. Correspondence may be addressed to the Board, the Lead Independent Director, any other
particular director, any committee of the Board or any other group of directors, in care of Thomas J. Reid, Secretary, Comcast
Corporation, at the mailing address provided on page 82 or the following e-mail address: audit_committee_chair@comcast.com. The
Secretary, or his designee, promptly reviews all such correspondence and, as appropriate, forwards it to the Board or other addressee
based on the subject matter of the correspondence. Any such correspondence relating to accounting, internal accounting controls
or auditing matters is handled in accordance with procedures established by the Audit Committee.
28
Table of Contents
Executive Compensation
| Proposal 2: ADVISORY VOTE TO APPROVE EXECUTIVE COMPENSATION |
|
The following proposal gives our shareholders the opportunity to cast
a non-binding, advisory vote to approve the compensation of our NEOs. This vote is not intended to address any specific item of
compensation, but rather the overall compensation of our NEOs and our compensation philosophy, policies and practices, as disclosed
below.
We encourage shareholders to review detailed information on our executive
compensation program and the 2021 compensation of our NEOs as set forth in “Executive Compensation — Compensation Discussion
and Analysis,” starting below. Shareholders are being asked to vote “FOR” the adoption of the following resolution:
“RESOLVED, that the compensation paid to Comcast Corporation’s
named executive officers, as disclosed pursuant to Item 402 of Regulation S-K, including the Compensation Discussion and
Analysis, compensation tables and narrative discussion, is hereby APPROVED.”
While we intend to carefully consider the voting results of this proposal,
this vote is advisory in nature, and, therefore, is not binding on us or our Board. Our Board and Compensation and Human Capital
Committee value the opinions of all of our shareholders and will consider the outcome of this vote when making future compensation
decisions for our NEOs. We currently conduct advisory votes to approve the compensation paid to our NEOs on an annual basis. |
 |
Our Board unanimously recommends
that shareholders vote “FOR” approval of the compensation of our named executive
officers. |
Compensation
Discussion and Analysis
This discussion and analysis describes our executive compensation
philosophy, process, plans and practices and gives the context for understanding and evaluating more specific compensation information
in the tables and related disclosures that follow.
Executive Overview
Overall
Performance
Mr. Roberts and our senior leadership team have successfully led our
company over the past two years as the world continued to navigate ongoing challenges from the pandemic, achieving strong operating
and financial results and underscoring the strength and resilience of our business. In the face of unique and ongoing challenges
posed by the pandemic, we pivoted quickly, executed well and came together globally to support employees, customers, guests and
communities.
Our relentless focus on innovation and execution, balanced with financial
discipline, enabled us in 2021 to deliver strong performance across our businesses and invest for the future, while increasing
our return of capital to shareholders. As described above in “About Comcast—2021 Performance Overview,” our 2021
consolidated operating and financial results were strong, with contributions from across our company, underscoring our business
resilience, strategic decision-making and capital allocation priorities, all driven with a view toward growth and creating long-term
value. The strength of our company’s balance sheet both supported our business priorities and investments and enabled us
to return more capital to shareholders sooner than anticipated as our debt leverage ratios returned to target levels following
the Sky acquisition over three years ago.
Comcast Cable continued its strong financial and operating performance
in 2021. The significant investments we have made in our technology and network over the years to stay ahead of demand and to maintain
speed and reliability continued to differentiate our broadband experience, leading to 1.3 million net new broadband customers in
2021 and bringing total broadband subscribers to 31.9 million at year end.
The impact of the global pandemic continued to have some negative
impacts on NBCUniversal and Sky, yet their leadership teams led strong recoveries, posting results that surpassed our expectations
leading into 2021. At NBCUniversal, our theme parks performed exceptionally well, reopening safely with strong attendance and financial
results, while also adding new attractions and opening Universal Beijing Resort. Peacock, our streaming service that launched in
mid-2020, showed significant growth in monthly active accounts and revenue relative to 2020. In 2021, programming and production
levels normalized at both NBCUniversal and Sky, and we continue to monetize our intellectual property through creative new options
for content licensing windows and distribution.
2022 Proxy Statement 29
Table of Contents
Mr. Roberts and our senior leadership team executed exceptionally
well, working together across our complementary, high-performing business units to continue to accelerate convergence in media
and technology. In 2021, as we sought to expand the reach of our proprietary global technology platform and addressable customer
base, we launched Sky Glass in the United Kingdom and XClass TV in the United States. Both of these products are built upon our
existing investments across our company in X1, Flex and Sky Q.
Our Board credits our NEOs for their successful leadership in 2021
– they not only delivered for our shareholders, but also continued to support our stakeholders, including our employees,
customers, suppliers and the communities where we operate. From our dedication to bridging the digital divide by providing more
people with the tools and resources they need to succeed in a digital society, to our ongoing efforts and continued progress in
DE&I and community impact, to taking further steps to lessen our environmental footprint by setting a goal to be carbon neutral
by 2035 for Scope 1 and 2 emissions across our global operations, our senior leadership team continued to lead by example and reinforce
our company’s commitment to doing what’s right while underscoring our commitment to act with integrity. See “Spotlight
on our Corporate Responsibility Initiatives” for additional information.
2021
Compensation Overview
In making compensation decisions for 2021, the Compensation and Human
Capital Committee considered, among other things, the exceptional leadership and performance of our NEOs in successfully managing
our company for the long-term. The Compensation and Human Capital Committee also sought to ensure that the compensation program
for our NEOs aligns compensation with shareholders’ interests and our long-term strategic goals, delivers pay for performance
and reflects shareholder input and prevailing market pay practices.
Below is a brief overview of key executive compensation decisions
that were made in respect of 2021 compensation, all of which are discussed in additional detail under “Our Approach to Compensation”
and “Compensation Decisions” below. Many of these decisions reflect the significant changes to our executive compensation
program design and structure as described in more detail immediately below in “Shareholder Feedback on Executive Compensation
and Compensation-Related Changes.”
| ● |
Dana Strong was appointed the CEO of Sky and became an NEO for the first time in 2021. Ms. Strong previously
was President of Consumer Services for Comcast Cable’s residential businesses in the United States. |
| |
|
| ● |
The Compensation and Human Capital Committee did not increase the base salaries of our NEOs, other than those of Mr. Watson
and Ms. Strong. In November 2021, the Committee and Mr. Roberts agreed to reduce his annual base salary to $2.5 million. |
| |
|
| ● |
Annual cash bonus payouts reflected the strong performance of our company in 2021, paying out at ranges between 125% and
133%. |
| |
|
| ● |
Performance-based restricted stock units (“PSUs”) granted in 2021 have a cumulative three-year performance
period and are earned based on the achievement of financial goals that emphasize capital efficiency, sustained earnings growth
and creation of shareholder value relative to market performance. |
| |
|
| ● |
Eliminated above-market interest earnings on deferred compensation for NEOs and directors. |
As a result of these changes, the vast majority of our NEOs’
compensation is performance-based, strongly aligning the NEOs’ compensation with our shareholders’ interests.
| 2021 CEO COMPENSATION MIX |
|
2021 AVERAGE NEO COMPENSATION MIX
(EXCLUDING CEO) |
| |
|
|
 |
|
 |
| |
|
|
25% Annual Cash Bonus 25% Stock Options 40% PSUs 10% Salary 11%
Salary <1% Other 43% Annual Cash 18% Bonus Stock Options 28% PSUs <1% Other 90% Total Performance- Based 89% Total Performance-
Based
30
Table of Contents
Shareholder
Feedback on Executive Compensation and Compensation-Related Changes
The Compensation and Human Capital Committee carefully considered
the results of our 2021 annual meeting, where our shareholders approved the 2020 compensation of our NEOs on an advisory basis
by 88% of the votes cast. It discussed our executive compensation program and our voting results with Korn Ferry, its independent
compensation consultant.
The Compensation and Human Capital Committee also considered feedback
on our compensation program received from shareholders through our corporate governance roadshows, as well as feedback from two
proxy advisory firms, and has taken significant steps over the past two years to address this feedback. (See “Shareholder
Engagement” on page 28 for additional details on our shareholder engagement program.)
| |
WHAT
WE HAVE HEARD |
|
|
|
WHAT
WE HAVE DONE |
| |
LONG-TERM
INCENTIVE COMPENSATION DESIGN |
| |
|
|
|
|
|
| |
Consider having a multi-year performance period for PSUs |
|
|
|
PSUs granted in 2021 have a 3-year cumulative performance period, with performance goals determined at the beginning of the 3-year period and measured at the end of the three-year period; previously PSUs had five individual 1-year performance periods |
| |
Consider using a relative performance metric
Consider incenting NEOs with a capital allocation performance metric
Consider a PSU performance metric not also used in the annual cash bonus program |
|
|
|
PSUs granted in 2021 have two relative performance metrics relating to Adjusted Earnings Per Share (“EPS”) growth and TSR and include an absolute return on adjusted invested capital (“ROIC”) performance metric; none of these metrics are used in our annual cash bonus program
Specifically:
● PSUs earned based on achievement of two primary performance metrics, each weighted 50%:
● an absolute ROIC metric (calculated for each year during the three-year period and averaged to yield an average ROIC for the cumulative three-year period); and
● relative Adjusted EPS growth to the S&P 100 over the three-year period
● Attainment of primary performance metrics is subject to a relative TSR modifier, interpolated for performance between the bottom and top quartiles (25th – 75th percentile), with no positive modifier applied if TSR is negative over the performance period |
| |
ANNUAL
CASH BONUS |
| |
Consider aligning relative weighting of quantitative financial performance metrics closer to market |
|
|
|
Quantitative financial metrics increased to 70% in 2021 (from 50% in 2020) of the target bonus to closer align with market practice; revenue, Adjusted EBITDA and Free Cash Flow remain the metrics used |
| |
Consider improving the transparency and objectivity of non-financial performance metrics |
|
|
|
15% of the target bonus in 2021 is based on strategic operating performance goals such as customer experience, product churn, Peacock user growth, Flex rollout, Xfinity Mobile performance and organizational collaboration
15% of the target bonus in 2021 is based on a qualitative assessment of our progress on stakeholder and sustainability initiatives such as continued leadership in addressing the “digital divide,” further progress on our DE&I and environmental sustainability initiatives, and further enhancing our strong culture of integrity and respect |
| |
DEFERRED
COMPENSATION |
| |
Concerns relating to “above-market” interest in deferred compensation program |
|
|
|
Eliminated all above-market interest earnings for NEOs (effective as of March 2021) and directors (effective as August 2020) such that they now may only invest deferred compensation in third-party mutual or exchange funds or a Comcast stock fund |
| |
|
|
|
|
|
2022 Proxy Statement 31
Table of Contents
The Compensation and Human Capital Committee considered our executive
compensation program holistically as it evaluated how to further enhance our program design while ensuring that the resulting structure
will attract, retain and motivate our senior executives and align them with shareholders over the long term. With this view in
mind, it determined that, in addition to the changes described above, the vesting terms of our PSUs and options should be reduced
to align with broader market practice, with PSUs cliff-vesting at the end of 3 years (as opposed to over 5 years) and options vesting
over 5 years (as opposed to over 9.5 years), and that the potential payout of PSUs should be increased to up to 250% (from 125%)
of target to reward senior executives for outperformance against rigorous goals.
Our Compensation and Human Capital Committee and management team are
committed to continued engagement with shareholders to understand their viewpoints and to discuss and demonstrate the important
connection between our compensation program, on the one hand, and our business strategy, goals and financial and operating performance,
on the other hand. Our Compensation and Human Capital Committee, with the assistance of Korn Ferry, continues to evaluate our compensation
program design. The Compensation and Human Capital Committee believes that its policies and decisions are consistent with our compensation
philosophy and objectives and align the interests of our NEOs with our long-term goals and the interests of our shareholders without
incenting inappropriate risk taking.
Executive
Compensation Best Practices
| What
We Do |
|
|
|
 Employ rigorous PSU performance
conditions. Employ rigorous PSU performance
conditions.
Maintain robust stock ownership
guidelines. A person not in compliance cannot sell or otherwise dispose of stock until the applicable ownership requirement
is met.
● CEO = 10x base salary
● NEOs = 3x base salary
● Nonemployee
directors = 5x annual cash retainer
Prohibit our executive officers and directors
from (i) pledging Comcast stock as collateral or holding it in margin accounts and (ii) using any strategies or products
to hedge against potential changes in the value of our stock.
Have an incentive compensation
recoupment (or “clawback”) policy applicable to our executive officers.
Compensation and Human Capital
Committee directly engages Korn Ferry as its own independent compensation consultant.
Use net-settled options,
which results in fewer shares issued and less dilution to our shareholders than stock options exercised with a cash payment. |
|
|
What We Don’t Do
 Do not permit the repricing
of options of any kind. Do not permit the repricing
of options of any kind.
Do not maintain any defined
benefit pension plans or supplemental executive retirement plans for our NEOs.
None of our equity plans
has automatic (“single-trigger”) accelerated vesting provisions in connection with a change in control. Mr.
Roberts’ employment agreement has a “double-trigger” change in control provision. No other NEO has any
change in control provisions in his or her employment agreement.
Do not pay dividends or dividend
equivalents in respect of any unearned PSUs or RSUs or on any stock options.
Do not provide premium payments
or reimbursements, or tax payments, to our NEOs under any life or any other insurance policies.
Do not provide for any excise
or other tax gross-ups for our executive officers.
|
32
Table of Contents
Our Approach to Compensation
In designing our compensation program, we evaluate both our business
objectives and the need to attract and retain uniquely talented and experienced individuals who think strategically for the long
term and perform for our highly competitive businesses, particularly in light of the challenging and evolving competitive, technological
and regulatory environments in which we operate. We employ a variety of elements that further our shareholders’ interests
by securing our executives’ services in an exceedingly competitive talent market and aligning the long-term interests of
our executives to create shareholder value.
| ● |
To motivate and retain our executives, we provide pay opportunity levels that are highly competitive. |
| |
|
| ● |
Our compensation program is designed to achieve an appropriate balance of elements to reward our NEOs for their performance
and create long-term shareholder value. In addition to fixed compensation, we provide short-term and long-term performance-based
compensation that includes company-specific performance goals, as well as relative performance goals that measure our shareholder
value creation relative to market performance. |
| |
|
| ● |
Our short-term annual bonus program includes quantitative financial performance goals that are based, in part, on enterprise-wide
and business unit consolidated budgets that are prepared annually and take into consideration the cyclicality of working capital
in our business, capital spending plans for the upcoming year, target product rollout numbers and other relevant factors.
We balance out our annual bonus program by also incenting attainment of strategic operating performance goals and key stakeholder
and sustainability initiatives. |
| |
|
| ● |
Our annual long-term incentive program is composed of grants of PSUs and stock options. PSUs awarded in 2021 have meaningful
performance conditions for vesting measured over a three-year period based on two relative performance metrics relating to
Adjusted EPS growth and TSR as well as an absolute ROIC performance metric, all of which balance internal goals and relative
market performance. Stock options are inherently performance-based in that our stock price must appreciate for the options
to deliver any value. |
| |
|
| ● |
The primary financial quantitative metrics used in our 2021 incentive compensation programs generally reflect those used
internally to measure our performance and externally to report to investors. Many of these measures are tied to cash generation,
capital efficiency and generating sustained profitable growth over time, as well as measure our growth and increase in shareholder
value relative to market peers. As a result, the financial metrics used in our 2021 executive compensation program were: |
| |
|
Annual
Cash
Bonus |
Revenue |
Serves as the top line component to cash generation |
| Adjusted EBITDA |
Reflects the operational performance of our businesses, taking into account the costs of operating these businesses |
| |
Free Cash Flow |
Measures, among other things, cash remaining after capital investments that allows us to repay indebtedness, make strategic
investments and return capital to shareholders |
Long-Term
Incentive
Program |
Average ROIC |
Measures how well capital (equity and debt) is used to generate earnings over a three-year period |
| Relative Adjusted EPS Growth |
Measures earnings performance compared to equally sized peers over a three-year period |
| Relative TSR |
Measures total company achievement of shareholder returns compared to equally sized peers over a three-year period |
Taken together, the interplay of these elements provided a pay program
that is strongly aligned with shareholder interests and long-term value creation, retains a high-quality executive team and compensates
the executive team when it does the right things to help our businesses succeed. We believe that the significant changes we made
to our compensation program for 2021, as discussed above in “Shareholder Feedback on Executive Compensation and Compensation-Related
Changes” and below in “Design and Structure of Executive Compensation — Equity-Based Incentive Compensation”
further enhance the performance-based nature of our executive compensation program.
2022 Proxy Statement 33
Table of Contents
Design and Structure of Executive Compensation
Elements
of Compensation Program
We view the executive compensation program on a “portfolio”
basis to achieve an appropriate balance of compensation elements to motivate and reward our NEOs for their performance and create
long-term shareholder value. The following chart illustrates our view of the significant aspects of the portfolio used for 2021.
(See “Shareholder Feedback on Executive Compensation and Compensation-Related Changes” above and “Equity-Based
Incentive Compensation” below for more information about enhancements we made to our compensation program design for 2021.)
| TYPE |
ELEMENT |
WHY WE USED IT |
COMPENSATION
HIGHLIGHTS |
 |
Base Salary |
● Necessary to attract and
retain our NEOs.
● Serves as a baseline measure
of an NEO’s value.
● Guaranteed compensation
in exchange for investing in a career with us. |
● Salary level is based on individual performance,
position within the organization and any increase in duties and responsibilities. |
 |
Annual
Cash Bonus |
● Provides a competitive annual
cash bonus opportunity and completes our competitive total annual cash compensation package.
● Target bonus is based on
the Compensation and Human Capital Committee’s assessment of the optimal mix of base salary and annual cash bonus
compensation.
● Supports our objective that
NEOs must balance achieving satisfactory or better current year (short-term) results with long-term value creation. |
● Based on objective quantitative
financial performance metrics and quantitative and qualitative goals relating to key operating performance goals.
● Includes a qualitative portion
based on stakeholder and sustainability initiatives such as continued leadership in addressing the “digital divide,”
further progress on our DE&I and environmental sustainability initiatives, and further enhancing our strong culture
of integrity and respect. |
 |
Annual PSU
Grants |
● Fosters a long-term commitment,
motivates executives to improve the long-term market performance of our stock and focuses them on the long-term creation
of shareholder value.
● Links the NEOs’ decision-making
with the long-term outcomes of those decisions.
● Creates a meaningful retention
tool and ties value ultimately realized to longer-term performance. |
● Cliff vest after three years.
● Vesting is dependent upon
achievement of absolute and relative performance metrics established at the beginning of the three-year period.
● Ultimate value of shares
acquired upon vesting depends on attainment of metrics and stock price. |
| Annual Stock
Option Grants |
● Fosters a long-term commitment,
motivates executives to improve the long-term market performance of our stock and focuses them on the long-term creation
of shareholder value.
● Links the NEOs’ decision-making
with the long-term outcomes of those decisions.
● Relatively long vesting
period creates a significant retention tool and ties value ultimately realized to our long-term performance. |
● Vest over a five-year period.
● Stock price must appreciate
for stock options to deliver value.
● Options are net settled,
resulting in fewer shares issued upon exercise. |
VARIABLE,
LONG-TERM, PERFORMANCE-BASED VARIABLE, SHORT-TERM, PERFORMANCE-BASED FIXED
34
Table of Contents
Compensation Decisions
Base Salary
In 2021, the Compensation and Human Capital Committee did not increase
the base salaries of our NEOs, other than those of Mr. Watson and Ms. Strong. The Compensation and Human Capital Committee increased
Mr. Watson’s base salary after considering his exceptional leadership as CEO of Comcast Cable and Ms. Strong’s base
salary as a result of her appointment as CEO of Sky.
In November 2021, the Compensation and Human Capital Committee and Mr.
Roberts agreed to reduce his annual base salary to $2.5 million, which will further lower the proportion of his fixed versus variable
compensation, and to use this reduced salary for purposes of calculating his annual cash bonus as if the reduction had been in
effect since the beginning of 2021.
Annual Cash Bonus
Our short-term incentive program includes meaningful performance-based
elements tied to financial goals, as well as incentives for attainment of operational goals tied to key strategic initiatives
and progress toward key stakeholder and sustainability initiatives.
| ● |
The target bonus opportunity in 2021 was 300%
of salary for each NEO. |
| ● |
Below are the target weightings for each element of the annual cash
bonus plan for our NEOs in 2021. The maximum bonus achievable was 185%, based on a maximum weight of 140% for all of the financial
metrics and of 22.5% for each of the operating performance and stakeholder and sustainability-related goals. |
| |
|
|
|
|
|
|
|
|
|
|
| Financial (70%)* |
|
Operating Performance (15%) |
|
Stakeholder & Sustainability
Initiatives (15%) |
| |
|
|
|
|
|
|
|
|
|
|
|
|
|
| |
|
|
|
|
|
|
|
|
|
|
|
|
|
Adjusted
EBITDA
(35%) |
|
Free
Cash Flow
(28%) |
|
Revenue
(7%) |
|
Customer Experience, Product Churn, Peacock User Growth, Flex Rollout, Xfinity Mobile Performance & Organizational Collaboration |
|
Bridging the Digital Divide, Diversity, Equity and Inclusion, Environmental Sustainability & Company Culture |
| |
|
|
|
|
|
|
|
|
|
|
|
|
|
| * |
For Messrs. Watson and Shell and Ms. Strong, the
same financial metrics and weightings apply, calculated 50% at the Comcast consolidated level and 50% at their respective
business unit level. |
2021 Financial Metrics and Results
The performance ranges below were used as the financial performance metrics
for the NEOs’ 2021 target bonus. Achievement for each financial metric would be zero if performance is below the minimum
threshold of the metric’s range, with potential payouts ranging from 14% if achievement for all three financial metrics
is at the low end of the range to a maximum of 140% for achievement of all three metrics at the top end of the range. See “2021
Performance” above for a description of our Company’s strong financial performance in 2021.
| |
|
PERFORMANCE
RANGE(1)
($ IN BILLIONS) |
|
ACTUAL
ACHIEVEMENT(2)(3) |
| Adjusted EBITDA |
|
29.725 – 32.853 |
|
70% |
| Free Cash Flow |
|
8.439 – 11.417 |
|
56% |
| Revenue |
|
107.114 – 118.390 |
|
11% |
| (1) |
Amounts reflected are on a consolidated basis
and have been adjusted to reflect Sky results on a constant currency basis. |
| (2) |
Achievement percentages are interpolated linearly between specified
achievement levels and are presented based on the maximum weighted levels of achievement described in the section immediately
above. |
| (3) |
Because Messrs. Watson and Shell and Ms. Strong’s annual cash
bonus was based 50% on the above consolidated financial metrics and 50% on the same metrics for their respective business
unit levels, their respective achievement for all the financial metrics (on a combined basis) varied as follows: Watson: 135%;
Shell: 137%; and Strong: 121%. |
Table of Contents
In setting financial metrics for 2021, the Compensation and Human Capital
Committee and management were mindful of the inherent uncertainty regarding the extent and duration of potential continued negative
impacts of COVID-19 on our businesses. However, as vaccination rates increased and restrictive government mandates subsided at
various points throughout the course of 2021, the exceptional leadership of our NEOs helped our business operations and financial
performance to rebound more quickly than expected as compared to 2020 performance. For example, as described above in “2021
Performance Overview,” our theme parks performed exceptionally well, with strong attendance and financial results as we
adapted to find safe and creative ways to operate. Peacock, our streaming service that launched in mid-2020, beat our own internal
monthly active account and revenue targets in 2021, and we continued to find innovative ways to monetize our intellectual property
through new options for content licensing windows.
2021 Operating Performance Goals and Results
Operating performance goals accounted for 15% of the 2021 target annual
bonus, with potential payouts ranging from 0% to 22.5%. The following goals and performance against those goals were evaluated
by the Compensation and Human Capital Committee in determining that achievement could merit target payout levels. These considerations
included both quantifiable outcomes as to whether we met or exceeded expectations of achievement and the Compensation and Human
Capital Committee’s holistic evaluation of the NEOs’ performance, collectively and individually, in executing against
strategic operational priorities as described immediately below and in “2021 NEO Performance.” Certain details about
the performance of our operating goals are not disclosed due to competitive concerns.
| GOALS |
|
2021
PERFORMANCE CONSIDERATIONS |
| Product Churn |
|
Product churn relates to the stability of our cable customer base
and customer net additions. Comcast Cable’s customer relationship net additions were driven by 1.3 million net new broadband
customers in 2021, bringing total broadband subscribers to 31.9 million at year end. Customer churn, particularly in our U.S.
broadband business and in the United Kingdom at Sky, remained at historically low levels during 2021. |
| Peacock User Growth |
|
Peacock continued its growth of monthly active accounts in the United
States, ending 2021 with more accounts than we had initially planned. We also plan to rollout Peacock content across Sky territories,
and have begun providing Sky customers in the United Kingdom and Ireland with early access to Peacock. |
| Xfinity Mobile Performance |
|
Comcast Cable wireless customer line net additions were 1.2 million,
the best annual result since we launched Xfinity Mobile in 2017. Our wireless business also reached profitability on a standalone
basis for the first time since it was launched. |
| Customer Experience Metrics |
|
Customer experience includes our relational net promoter score, unique
contact rate and other customer experience metrics. In 2021, our agent-handled calls were reduced by 14%, truck rolls were
reduced by 18%, and our net promoter scores increased by 20% — collectively showing that our self-help tools and processes
continue to improve customer experience metrics. |
| Flex Rollout |
|
Comcast Cable continued its rollout of Flex, deploying over 2 million
additional boxes in 2021. Through our global technology platform, we have expanded the reach of our Flex investment in the
United States through the deployment of our XClass TV. |
| Organizational Collaboration |
|
Our businesses continued their strong collaboration with one another.
In 2021, we launched Sky Glass in the United Kingdom and XClass TV in the United States, with both products leveraging our
proprietary, global technology platform as we continue to work to provide more ways to bring the best of our entertainment
operating system to more consumers. Peacock’s user base has benefited from distribution domestically through Comcast
Cable’s X1 video service and Flex customers, as well as internationally from Sky as noted above. |
36
Table of Contents
2021 Stakeholder and Sustainability-Related
Goals
Stakeholder and sustainability-related goals accounted for 15% of the
2021 target annual bonus, with potential payouts ranging from 0% to 22.5%. The following goals and performance against those goals
were considered by the Compensation and Human Capital Committee in determining that achievement could merit target payout levels.
Rather than reducing our stakeholder and sustainability goals to any one metric or set of metrics, these considerations were primarily
based on the Compensation and Human Capital Committee’s independent and holistic evaluation of the NEOs’ efforts,
collectively and individually, to further progress key stakeholder and sustainability initiatives and priorities as described
immediately below and in “2021 NEO Performance.”
| GOALS |
|
2021 PERFORMANCE CONSIDERATIONS |
| Bridging the Digital Divide |
|
We continued our strong leadership in bridging the digital divide
by actively sponsoring and participating in programs designed to extend our broadband services to underserved and unserved
Americans in 2021 by:
● Promoting
and sponsoring our Internet Essentials program as America’s leading broadband product for low-income families,
including by expanding eligibility and providing affordable opportunities for school districts and other organizations
to connect students to broadband access at home; to date, we have collaborated with hundreds of schools and organizations across the country.
● Supporting
and participating in the federal government’s broadband benefits programs to provide discounted internet
service to those in need, namely the Emergency Broadband Benefit program that launched in May 2021 and its successor,
longer-term Affordable Connectivity Program that launched at the end of 2021. Through these programs, which enable qualifying low-income customers to apply a financial subsidy to our broadband services, customers can receive
our Internet Essentials service or our new enhanced Internet Essentials Plus service with twice the download speed
– up to 100 Mbps – effectively for free.
● Participating
in federal, state and local programs designed to fund the expansion of broadband to unserved Americans and extending
our world class network to new areas where reliable, high-speed internet services had been unavailable.
● Continuing
the initiatives we had established in 2020 in response to the global pandemic aimed at providing internet access
to those who did not have it, including providing eligible new customers with 60 days of free service, making our
1.5 million public Wi-Fi hotspots available for free, waiving bad-debt program eligibility and creating affordable
and flexible payment plans to allow customers and small businesses to retain their services.
● Partnering
with non-profit organizations and city leaders to create, through the end of 2021, more than 1,000 Lift Zones in
community centers nationwide where students in need of internet-equipped spaces for remote learning can connect
to the internet to participate in distance learning. |
| DE&I |
|
Our DE&I efforts focus on areas where we believe we can make
the most impact given the nature of our business, such as workforce, the programming we create and distribute and the
supplier relationships we have.
● In
2021, we continued our efforts to increase representation in leadership roles, increasing representation of women
and people of color in vice president-level and above positions in the United States to approximately 42% and 24%,
respectively.
● We
continued to amplify diverse voices and cultures through our media platforms, including through Xfinity’s
curated On Demand special collections, NBCUniversal’s ‘The More You Know’ series of public service
announcements and NBC News’ ‘The Racism Virus’ on the stark rise in anti-Asian discrimination,
to name a few examples. NBCUniversal also launched NBCU Academy, an innovative, multiplatform journalism training
and development program for students at Historically Black Colleges and Universities and diverse-serving institutions,
as well as a multi-year $3.5 million scholarship fund for underrepresented students. |
Table of Contents
| GOALS |
|
2021
PERFORMANCE CONSIDERATIONS |
| |
|
● In
2021, we spent over $4.3 billion with diverse Tier 1 vendors (with direct purchases from over 3,250 diverse suppliers)
and over $390 million with diverse Tier 2 subcontractors.
● In
2021, we invested $25 million in the Seibert Williams Shank Clear Vision Impact Fund, a diverse-led and diverse-serving
financial institution that provides direct support to local community businesses, and $10 million in the Inclusiv
Racial Equity and Resilience Investment Fund, which is aimed at building equity in credit unions led by and/or
serving people of color. |
| Environmental Sustainability |
|
Led by our senior leadership team, we set a goal to be carbon
neutral by 2035 in Scope 1 and 2 greenhouse gas emissions across our global operations in May 2021. We also created an
enterprise steering committee, led by Mr. Cavanagh and our Chief Legal Officer, to help facilitate progress toward our
carbon neutral goal and further environmental initiatives. Knowing that purchased electricity accounts for the majority
of our Scope 1 and 2 emissions, we have further developed our renewable energy procurement strategy, signing in 2021 a
long-term purchase agreement for renewable electricity to power approximately 12% of our current U.S. electricity use
beginning in 2024-2025.
We also reported for the first time under both the SASB and TCFD
frameworks in 2021. |
| Culture of Integrity and Respect |
|
Individually and as a whole, our NEOs provided critical leadership
in furthering each of the important stakeholder and sustainability initiatives described above. They also reinforced our strong
commitment to a workplace culture that emphasizes integrity and respect and intolerance of harassment and discrimination. |
2021
NEO Performance
In evaluating the strategic operating performance goals and stakeholder and sustainability initiatives portions of the annual cash bonus, the Compensation and Human Capital Committee also considered the contribution of each NEO toward our company’s overall achievement of, and progress toward, those goals, as well as each NEO’s overall management and leadership of our company.
|
| Brian L. Roberts |
|
Mr. Roberts led our company’s strategic focus on connectivity,
aggregation and streaming, which we believe will better position our company for the long-term. Mr. Roberts set the tone for
our businesses to execute at the highest level, to work together across our complementary, high-performing businesses at Comcast
Cable, NBCUniversal and Sky and to continue to accelerate convergence in media and technology and leverage our global technology
platform. At the same time, he continued to guide our company’s overall response to the pandemic and reinforce our stakeholder
and sustainability initiatives, all with a focus on doing the right thing for all of our stakeholders and society at large. |
| Michael J. Cavanagh |
|
Mr. Cavanagh led our businesses in responding to and reemerging from
the depths of the global pandemic. Mr. Cavanagh continued to focus on capital allocation, balance sheet strength and our liquidity.
He led important decisions about return of capital alternatives, including raising our dividend to $1.08 a share on an annualized
basis for 2022, an increase of 8% year-over-year, and resuming our share repurchase program in May 2021 after having paused
it in 2019 to accelerate the reduction of indebtedness incurred in connection with the Sky acquisition. In addition to his
financial leadership, Mr. Cavanagh framed and led the execution of key decisions on critical strategic and operational initiatives
across all of our businesses, as well as providing leadership alongside Mr. Roberts to the entire company as we continue to
adapt to the post-pandemic environment. |
38
Table of Contents
| David N. Watson |
|
Mr. Watson successfully led Comcast Cable, adding
1.3 million net new broadband customers and continuing our efforts to keep America connected and employees safe throughout
the pandemic. Under Mr. Watson’s leadership, we continue to invest significantly in our broadband network to better
optimize performance, deliver faster internet speeds and proactively fix problems. In 2021, for example, we completed a series
of tests that demonstrated the success of DOCSIS 4.0 technology, culminating in a prototype modem capable of delivering multi-gigabit
speeds. Under his leadership, Comcast Cable continued its strong financial and operational performance in 2021, with its revenue
increasing by 7.1% to $64.3 billion and its Adjusted EBITDA increasing by 11.2% to $28.1 billion. |
| Jeffrey Shell |
|
Mr. Shell continued to successfully lead and mitigate negative pandemic
impacts on NBCUniversal in 2021. Under Mr. Shell’s leadership, our theme parks performed exceptionally well, and we
opened Universal Beijing Resort in September 2021. He also continued to lead our strategy for Peacock, which experienced significant
growth in monthly active accounts and revenue. NBCUniversal has also innovated to create new pay windows for early viewing
opportunities to better monetize our content and intellectual property, including on Peacock. NBCUniversal’s financial
performance rebounded well in 2021, with its revenue increasing by 26.1% to $34.3 billion and its Adjusted EBITDA increasing
by 6.0% to $5.7 billion, including Peacock losses. |
| Dana Strong |
|
Ms. Strong, in her first year as CEO of Sky, provided strong leadership
that resulted in increased Sky Q penetration, the launch of Sky Glass and securing the majority of Sky’s key content
rights through 2025. Under Ms. Strong’s leadership, Sky continued to progress its environmental sustainability leadership
in 2021, sponsoring the United Nations’ 26th Climate Conference (COP26) in Glasgow in which Ms. Strong participated
as a speaker. Sky’s financial performance rebounded well in 2021, with its revenue increasing 9.1% to $20.3 billion,
or 3.1% excluding the impact of foreign currency. Sky Adjusted EBITDA increased 20.8% to $2.4 billion, or 10.2% excluding
the impact of foreign currency. See Appendix A for a reconciliation. |
2021 Bonus Achievement
Performance relative to the metrics and goals described above would result
in potential bonuses for the NEOs ranging from 151%-167% in light of our strong operating and financial performance and exceptional
NEO leadership in 2021. After considering the faster than expected rebound of our businesses due to progress in the control of
the pandemic and its effects generally, however, the Compensation and Human Capital Committee, following discussion with management,
reduced the NEO bonuses to the levels set forth below. The Compensation and Human Capital Committee also determined, at Mr. Roberts’
request, to compute his bonus based on his reduced annual salary of $2.5 million, as if the reduction had been implemented at
the beginning of 2021.
| |
|
ROBERTS |
|
CAVANAGH |
|
WATSON |
|
SHELL |
|
STRONG |
| Total Paid (% of Target) |
|
125% |
|
125% |
|
133% |
|
133% |
|
133% |
| Total Cash Bonus Paid |
|
$8,625,586 |
|
$8,625,001 |
|
$8,969,828 |
|
$9,975,000 |
|
$8,247,836(1) |
| (1) |
Ms. Strong’s bonus was paid in British pounds
sterling and was converted to U.S. dollars using the 2021 average of daily spot rates of £1 to $1.3757. |
Equity-Based Incentive Compensation
To continue to promote the alignment of our executive compensation program
and long-term shareholder value creation, and after considering feedback received from our shareholders, the Compensation and
Human Capital Committee adopted a new approach to our equity-based compensation program for 2021. The Compensation and Human Capital
Committee believes that this refocused approach reinforces our performance culture by incorporating the achievement of longer-term
absolute and relative financial and share-based performance metrics into our PSU awards as a further complement to the annual
financial and operational metrics used under our annual cash bonus program. For a discussion of the key changes made to our equity
compensation program for 2021, please see “Shareholder Feedback on Executive Compensation and Compensation-Related Changes”
above.
Table of Contents
The table below reflects the key features of our equity compensation program
for 2021:
| KEY
FEATURES |
|
2021
EQUITY COMPENSATION PROGRAM |
| Performance Period |
|
● Three-year
cumulative performance period, with all performance goals measured over the three-year period
● Cliff-vests
based on payout levels three years following grant |
| Performance Goals |
|
● PSUs
earned based on achievement of two primary performance metrics, each weighted 50%: (1) absolute ROIC and (2) relative
Adjusted EPS growth
● Attainment
of primary performance metrics is subject to a relative TSR modifier |
| PSU Award Payouts |
|
● Performance
must be achieved through a cumulative three-year period
● Potential
payout up to 250% of target, which rewards for outperformance against rigorous goals and significant returns to
our investors |
| Stock Option Vesting Period |
|
● Stock
options vest over a five-year period to more closely align with broader market practice, while still retaining a longer vesting
period than many companies to reinforce a long-term focus |
We believe that the new PSU structure closely aligns the interests of
our NEOs with shareholders and long-term value creation, with the ROIC and relative Adjusted EPS growth metrics serving as meaningful
inputs to value creation and the relative TSR modifier providing an output measure of value creation. The combination of these
performance metrics, together with the financial metrics (revenue, Adjusted EBITDA and Free Cash Flow), operating performance
goals and the evaluation of stakeholder and sustainability initiatives under our annual cash bonus program, provide company-specific
performance goals that are directly linked with our NEOs’ management of our company, while also satisfying shareholder return
expectations. The maximum payout under the PSU awards increased in 2021 from 125% to 250% of target to provide additional incentive
for outperformance and in recognition of the fact that a significant portion of our NEOs’ compensation is delivered in the
form of at-risk PSU awards, the value of which may only be realized by our NEOs upon achievement of financial and shareholder
return performance measures over a three-year period.
Consistent with historical practice, our 2021 equity compensation program
for NEOs consisted of a mix of both PSU awards and stock options — in 2021, 60% of the target value of our NEOs’ equity
awards was in the form of PSUs and 40% was in the form of stock options. In determining the total value of equity-based compensation,
the Compensation and Human Capital Committee considers, among other things, the overall performance mix of an NEO’s total
direct compensation and the value of awards made to other executives, as well as the value of equity-based compensation awarded
to comparable NEOs at our peer companies.
PSUs
2021 PSU Awards
For PSUs granted in 2021, we established two equally weighted primary
performance metrics that are each measured over a cumulative three-year performance period beginning January 1 in the year of
grant:
| ● |
ROIC: measured on an absolute basis for each year
during the three-year period and averaged to yield an average ROIC for the cumulative three-year period |
| ● |
Relative Adjusted EPS Growth: compound annual growth rate measured
on a relative basis at the end of the cumulative three-year performance period against the companies comprising the S&P
100 Index |
The ultimate payout of the PSUs is then subject to a relative TSR performance
modifier based on the percentile ranking of our TSR over the three-year performance period relative to that of the companies comprising
the S&P 100 Index (“Relative TSR Modifier”). We believe this modifier more directly links our equity compensation
program to shareholder returns by rewarding our executives for sustained market outperformance, as well as regulating payouts
for market underperformance, even if financial metrics are achieved at or above target.
We believe the combination of these performance goals closely aligns the
potential payout of the PSUs to the value ultimately realized by shareholders over a similar time horizon.
40
Table of Contents
Earned PSUs will cliff-vest on the third anniversary of the date of grant,
generally subject to continued employment through such date.
The target PSU values that the Compensation and Human Capital Committee
approved for 2021 PSUs are set forth below. These target values are lower than the accounting values required to be set forth
in the Summary Compensation Table for 2021 as a result of certain assumptions and valuation methodologies required under applicable
accounting standards.
| NAME |
|
PSUs
($) |
| Mr. Roberts |
|
12,720,000 |
| Mr. Cavanagh |
|
9,480,000 |
| Mr. Watson |
|
6,300,000 |
| Mr. Shell |
|
5,160,000 |
| Ms. Strong |
|
3,150,000 |
For more information on PSUs granted in 2021, see “Grants of Plan-Based
Awards” table below.
Prior PSU Award Vestings in 2021
PSUs granted to NEOs before 2021 were earned based on a sliding-scale
tied to increases in annual year-over-year Adjusted EBITDA (which were measured each year for a total of five years). For PSU
awards granted in 2017 through 2020, vestings were based on the highest vesting percentage of any prior vesting tranche, or such
higher vesting percentage as may be attained for a subsequent tranche based on the same performance condition and achievement
ranges provided for in the applicable PSU award. Any portion of PSUs that fail to vest in a year is permanently forfeited, as
occurred with the first tranche of vesting for PSUs granted in 2020. The achievement for 2021 of the Adjusted EBITDA performance
metrics for PSUs granted in 2017 through 2020 resulted in maximum achievement at 125% for all remaining tranches of PSUs.
Stock Options
Approximately 40% of the target value of our NEOs’ 2021 equity awards
was in the form of stock options. While the stock options granted to our NEOs do not have any express performance conditions,
the value ultimately realized for such awards is dependent on the appreciation of our stock price from the date of grant, which
further aligns our NEOs’ interests with those of our shareholders.
For the stock options granted to our NEOs beginning in 2021, the Compensation
and Human Capital Committee determined to shift away from our historical practice of granting options with a 9.5-year vesting
schedule and instead granted stock options with a five-year vesting schedule, with 40% of the options vesting in year two and
the remaining 60% vesting in equal annual installments over the next three years. We believe this vesting schedule is more closely
aligned with current market practice, making our stock option program more competitive for attracting and retaining senior executives
in the competitive talent market in which we operate while continuing to focus on the long term.
Deferred Compensation
Since March 2021, amounts that our NEOs deferred under our deferred compensation
plans must be notionally invested in either a company stock fund, which tracks the value of our Class A common stock, or several
third-party mutual and exchange funds, which eliminates above-market interest earnings that had previously been earned through
investments in an income fund with a fixed rate of return. Our deferred compensation plan is described in more detail below in
the “Nonqualified Deferred Compensation in and as of Fiscal Year-End” table.
Procedures for Determining Compensation
Compensation and Human Capital
Committee’s Role, Process and Validation
The Compensation and Human Capital Committee approves the nature and amount
of compensation paid to, and the employment and related agreements entered into with, our executive officers, and oversees broad-based
cash bonus and equity-based plans, approving guidelines for grants of awards under these plans and determining and overseeing
our compensation and benefits policies generally.
Table of Contents
In 2021, the Compensation and Human Capital Committee reviewed for our
NEOs:
| ● |
Each element of our NEOs’ compensation for internal consistency. |
| ● |
Various analyses provided by its independent compensation consultant, including: |
| |
● |
an assessment of the composition of our peer groups; |
| |
● |
a competitive pay assessment (comparing NEO compensation to that
of executives holding comparable positions at our peer group companies as disclosed in proxy statements and to broad groups
of companies in published surveys, and analyzing components of pay compared to those of our peer group companies (e.g., target
pay levels, fixed vs. variable, components of long-term equity)); |
| |
● |
a financial performance review (comparing our performance relative
to our peer group companies with respect to growth in adjusted EBITDA, free cash flow, revenue and TSR, based on financial
data from a third-party source); |
| |
● |
a compensation sharing analysis (analyzing the actual pay delivered
to our NEOs as a percentage of our Adjusted EBITDA and Free Cash Flow as compared to our peer group companies); |
| |
● |
an incentive compensation design analysis (analyzing various annual
bonus and long-term incentive design elements); and |
| |
● |
an analysis of equity dilution resulting from, and annual usage rates
in, our equity-based compensation plans as compared to our peer group companies (i.e., overhang and burn rates). |
| |
|
|
| ● |
After taking into account the analyses above, the Compensation and Human Capital Committee evaluated our financial performance, as compared to our peers over time, as it related to our strongly competitive compensation philosophy. |
| ● |
The Compensation and Human Capital Committee also reviews, but does not give significant weight to, aggregate amounts realized or realizable from prior years’ compensation when making decisions regarding current compensation. It believes that value realized on prior years’ compensation from stock appreciation is the reward for the NEOs’ work over that period and reflects the achievement of our long-term goals and, conversely, that lesser amounts realized on prior years’ compensation reflect a lack of achievement of our long-term goals. As such, the Compensation and Human Capital Committee believes that realized or realizable equity compensation is inherently aligned with our long-term performance and shareholders’ interests. |
| ● |
In addition, the Compensation and Human Capital Committee annually reviews the nature and mix of compensation elements, as well as compensation plan design and award terms, to ensure that our compensation program does not include inadvertent incentives for our NEOs to take inappropriate business risks by making decisions that may be in their best interests but not in the best interests of our shareholders. In conducting this review, the Compensation and Human Capital Committee also considers specific business risks identified through our ERM process. |
Following these reviews and assessments, and with these goals in mind,
the Compensation and Human Capital Committee determines what it believes to be an appropriate current year compensation package
for each NEO. This process includes subjective criteria and involves the exercise of discretion and judgment. Based on these reviews,
the Compensation and Human Capital Committee believes the design of the compensation program for 2021 is appropriate.
Role of Compensation Consultants
The Compensation and Human Capital Committee has directly engaged Korn
Ferry as its own independent compensation consultant. In determining 2021 compensation, the Compensation and Human Capital Committee
directed Korn Ferry to provide it with various compensation analyses as described below; Korn Ferry did not recommend or determine
compensation levels or elements, performance targets or compensation plan design.
The Compensation and Human Capital Committee assessed Korn Ferry’s
work as required under SEC rules and concluded that its work for the Compensation and Human Capital Committee in 2021 did not
raise any conflicts of interest. The Compensation and Human Capital Committee reached this determination by reviewing fees paid
to Korn Ferry and evaluating its work under applicable SEC and Nasdaq rules on conflicts of interest.
Compensation Consultant Services
Korn Ferry provides research, analysis and input as to the form and amount
of executive and director compensation, which generally includes market research utilizing information derived from proxy statements,
surveys and its own consulting experience and insight, as well as the provision of other methodological standards and policies
in accordance with its established procedures. This research, analysis and input has been provided to both our Compensation and
Human Capital Committee and to management. The Compensation and Human Capital Committee collaborated with Korn Ferry to
42
Table of Contents
determine and approve the parameters used to conduct the assessment work,
including items such as the composition of peer groups, the relevant market statistical reference points within the data (e.g.,
median) and the elements of compensation. Korn Ferry did not determine or recommend the form or amount of compensation of our
NEOs for 2021.
In 2021, we paid Korn Ferry approximately $330,000 for services related
to executive and director compensation and approximately $1,097,000 for leadership, succession, organizational strategy and talent
consulting services and executive search services.
As part of their job responsibilities, certain of our executive officers
participate both in gathering and presenting facts related to compensation and benefits matters as requested by the Compensation
and Human Capital Committee and in formulating and making recommendations to the Compensation and Human Capital Committee in these
areas. These executives, together with our employees who work in the compensation area, also conduct research and consult with
compensation consultants, legal counsel and other expert sources to keep abreast of developments in these areas. All decisions,
however, regarding the compensation of our NEOs are made by the Compensation and Human Capital Committee and are reviewed by the
Board, following reviews and discussions held in executive sessions.
Use of Competitive Data
While peer group and various compensation survey analyses are considered
important and valuable by the Compensation and Human Capital Committee, the Compensation and Human Capital Committee does not
make any determination of, or change to, compensation in reaction to market data alone. Rather, it uses this information as one
of several considerations to inform its decision and put it in context in determining compensation levels (and when to change
compensation levels).
Peer Group
The Compensation and Human Capital Committee, advised by Korn Ferry, reviewed
the criteria for selecting members of our peer groups and determined to combine the entertainment/media and transmission/distribution
peer groups that had been previously used into one core peer group given the accelerating convergence in media and technology
and the complementary nature of, and consolidation in, the media and distribution industries.
Below are the companies in our core peer group for 2021, which are unchanged
from our 2020 peers:
● Alphabet,
Inc.
● AT&T
Inc.
● Charter
Communications, Inc.
● Warner
Bros. Discovery, Inc. (f/k/a Discovery, Inc.)
● DISH
Network Corporation
● Fox
Corp
● Lumen
Technologies, Inc. |
|
● Meta
Platforms, Inc. (f/k/a Facebook, Inc.)
● Netflix,
Inc.
● Paramount
Global (f/k/a ViacomCBS Inc.)
● T-Mobile
US, Inc.
● The
Walt Disney Company
● Verizon
Communications Inc. |
Our peer group analyses indicate that overall, our “pay at risk”
practices are generally aligned with peer group practices.
| ● |
Comparisons for (i) Mr. Roberts were made to peer
chief executive officers for the peer group, (ii) Mr. Cavanagh were made to peer chief financial officers for the peer group,
and (iii) Messrs. Watson and Shell and Ms. Strong were made by ordinal rank (i.e., the position in the Summary Compensation
Table), with supplemental comparisons to peer chief executive officers of the peer group. |
| ● |
As a supplemental reference point to further inform the Compensation
and Human Capital Committee, comparisons were made to general industry peer groups with revenues similar in size to our business
as a whole and our business units. |
| ● |
The Compensation and Human Capital Committee does not determine an
NEO’s target compensation solely based on a specific reference point within our peer group; instead, it reviews our
peer group analyses, as well as the other analyses discussed in “Compensation and Human Capital Committee’s Role,
Process and Validation,” both to validate our compensation program design and to inform its judgment in determining
target compensation. |
Table of Contents
Assessing NEO Performance
In determining an NEO’s individual compensation, the Compensation
and Human Capital Committee:
| ● |
Sets specific factors to be used in evaluating
Mr. Roberts, and Mr. Roberts discusses with the Compensation and Human Capital Committee the performance of our other NEOs. |
| ● |
Assesses each NEO’s responsibilities and roles with respect
to overall corporate policy-making, management, operations and administration, as well as the importance of retaining the
NEO. |
| ● |
Evaluates each NEO’s prior year performance, both in terms
of their contribution to our performance and as compared to their individual performance goals. |
| ● |
Evaluates our overall prior year performance, both in terms of financial
results and progress on strategic initiatives, including a comparison of our performance to our competitors. |
The Compensation and Human Capital Committee employs a rigorous process
to evaluate our NEOs’ performance that informs its compensation decisions for the year, including those related to an NEO’s
base salary and annual equity awards and the attainment of qualitative objectives for our annual cash bonus. This design allows
our Compensation and Human Capital Committee to employ a holistic evaluation process with extensive performance reviews, taking
into account factors in and out of management’s control, while balancing it with our financial and shareholder outcomes,
to get to a better result than a purely formulaic calculation would provide.
Each year, our Compensation and Human Capital Committee establishes a
set of defined objectives for the qualitative portion of our annual cash bonus, which may be tied to an NEO’s or our company’s
overall performance, strategic operating performance goals or stakeholder and sustainability initiatives, such as continued leadership
in addressing the “digital divide,” further progress on our DE&I and environmental sustainability initiatives,
and further enhancing our strong culture of integrity and respect, at the time it determines the quantitative metrics. In determining
payout levels on the qualitative metrics, the Compensation and Human Capital Committee critically evaluates our company and NEO
performance and progress based on the defined objectives.
See “Compensation Decisions” above for information on NEO
performance and decisions made in respect of 2021.
Other Compensation Policies and Considerations
Executive Stock Ownership Policy
We have a stock ownership policy for members of our senior management,
including our NEOs, that is designed to increase our executives’ ownership stake in our company and align their interests
with those of our shareholders.
| |
MULTIPLE
OF BASE SALARY
REQUIRED |
COMPLIANCE
STATUS AS OF
DECEMBER 31, 2021 |
| Brian L. Roberts |
10x |
In compliance |
| Michael J. Cavanagh |
3x |
In compliance |
| David N. Watson |
3x |
In compliance |
| Jeffrey Shell |
3x |
In compliance |
| Dana Strong |
3x |
In compliance |
“Ownership” includes (i) stock owned directly or indirectly,
(ii) shares credited under our employee stock purchase plan, which must be held for one year from the date credited, and (iii)
60% of deferred vested shares, shares deemed invested in the company stock fund under our deferred compensation plans and the
pre-tax net number of shares deliverable upon the exercise of vested stock options. There is a phase-in period of six years after
the year in which an executive first becomes
44
Table of Contents
subject to the policy to allow the executive to meet the full stock ownership
requirement. If an executive is subject to a phase-in period, we consider them to be in compliance with the policy if they meet
the reduced stock ownership requirements over time under such phase-in. In determining compliance, the Compensation and Human
Capital Committee may consider any noncompliance that occurs solely or primarily from a decline in the market price of our stock.
If an executive is not in compliance, he or she is prohibited from selling our stock (unless a hardship exemption is granted).
Policies Regarding Trading
Activities and Prohibitions on Hedging and Pledging
Our trading policy prohibits our executive officers, certain other high-level
employees and directors from buying or selling any of our securities during specified blackout periods, and, when outside of those
blackout periods, they may only buy or sell our securities with prior approval in accordance with internal procedures. This seeks
to ensure that our executive officers and directors will not trade in our securities at a time when they are in possession of
material, nonpublic information.
Our policies prohibit our executive officers and directors from (i) using
any strategies or products (including derivative securities, such as put or call options, or short-selling techniques) to hedge
against potential changes in the value of our stock and (ii) holding our stock in margin accounts or pledging our stock as collateral
for a loan.
No Automatic Payments in Connection
with a Change in Control
We generally do not have any benefits, such as accelerated vesting of
equity awards, that are “triggered” automatically as a result of a “change in control” (a “single
trigger”) or the occurrence of one or more specified events (a “double trigger”) that may follow a change in
control, such as termination of employment without cause. Instead, we believe it is in the best interests of our company for our
Board and Compensation and Human Capital Committee, who are subject to fiduciary obligations to act in a manner they believe to
be in the best interests of our company and shareholders, to retain the discretion to determine whether it is appropriate to accelerate
the vesting of stock options and/or stock units or provide other benefits in connection with a particular change in control transaction.
Mr. Roberts’ employment agreement provides that if his employment
is terminated following a change in control, that termination will be treated as a termination without cause for the purpose of
determining his benefits in those circumstances under his employment agreement. The Compensation and Human Capital Committee approved
this provision as a fair and reasonable protection for our Chief Executive Officer in the event of a change in control.
Payments in Connection with
a Termination of Employment
Payments to our NEOs upon a termination of employment are described under
the “Potential Payments upon Termination or Change in Control” table below. These compensation arrangements are contained
in each NEO’s employment or other agreements and are not a factor in the Compensation and Human Capital Committee’s
determination of current year compensation elements. These arrangements were arrived at as a result of arm’s-length negotiations
in connection with entering into each such agreement, based on the Compensation and Human Capital Committee’s decision that
it was appropriate to provide more favorable arrangements than those offered to nonexecutive employees upon termination of employment.
Recoupment (or “Clawback”)
Policy
We have an incentive compensation recoupment (or “clawback”)
policy providing that, if it is determined by our Board that gross negligence, intentional misconduct or fraud by one of our executive
officers or former executive officers caused or partially caused the restatement of all or a portion of our financial statements,
the Board, in its sole discretion, may, to the extent permitted by law and our benefit plans, policies and agreements, and to
the extent it determines in its sole judgment that it is in our best interests to do so, require repayment of all or a portion
of any annual cash bonus, vested stock units (time- or performance-based) or other incentive-based compensation paid to such executive
officer or former executive officer (and/or effect the cancellation of unvested stock units) if: (i) the amount or vesting of
the incentive-based compensation was calculated based upon, or contingent on, the achievement of financial or operating results
that were the subject of or affected by the restatement and (ii) the amount or vesting of the incentive-based compensation would
have been less had the financial statements been correct. The Compensation and Human Capital Committee and the Governance and
Corporate Responsibility Committee review this policy from time to time, and they will review it following the SEC’s adoption
of a final rule under the Dodd-Frank Act regarding incentive-based compensation recoupment.
Table of Contents
Award Timing
Our annual equity incentive awards are granted in accordance with pre-established
grant dates.
Tax and Accounting Considerations
The Compensation and Human Capital Committee considers accounting and
tax implications of our compensation and benefit programs, including with respect to the tax deductibility of our executive compensation.
Section 162(m) of the Internal Revenue Code generally limits the tax deductibility of compensation paid by public companies to
certain executive officers to $1 million. In the exercise of its business judgment and in accordance with its compensation philosophy,
the Compensation and Human Capital Committee has previously awarded, and continues to have the flexibility to award, compensation
that is not tax deductible if it determines that such award is in our shareholders’ best interests.
In addition, the Internal Revenue Code limits the amount that companies
can deduct for the personal use of Company-provided aircraft to the amount recognized as income by the executives who used the
aircraft. In 2021, the total amount of our disallowed tax deduction resulting from the personal use of Company-provided aircraft
by our NEOs and any guests was approximately $9.3 million.
Other Considerations
The Compensation and Human Capital Committee is aware that Mr. Roberts
is our shareholder with the greatest beneficial voting power. The Compensation and Human Capital Committee maintains an objective
stance toward Mr. Roberts’ compensation. The Compensation and Human Capital Committee uses the same methods, tools and processes
to determine Mr. Roberts’ compensation as it does for our other NEOs.
Compensation and Human Capital
Committee Report
We, the members of the Compensation and Human Capital Committee of the
Board of Directors, have reviewed and discussed with management the Compensation Discussion and Analysis. Based on this review
and discussion, we have recommended to the Board of Directors that the Compensation Discussion and Analysis be included in this
proxy statement.
Members of the Compensation and Human Capital
Committee
Edward D. Breen (Chair)
Gerald L. Hassell
David C. Novak
46
Table of Contents
Executive
Compensation Tables
Summary
Compensation Table
Our NEOs are: our Chairman of the Board, President and Chief Executive
Officer (Mr. Brian L. Roberts), our Chief Financial Officer (Mr. Michael J. Cavanagh) and our next three most highly compensated
executive officers (Messrs. David N. Watson and Jeffrey Shell and Ms. Dana Strong). Information is presented only for 2020 and
2021 for Mr. Shell, who first became an NEO with respect to 2020, and only for 2021 for Ms. Strong, who first became an NEO with
respect to 2021.
NAME AND
PRINCIPAL POSITION | |
YEAR | |
SALARY(1)
($) | |
STOCK
AWARDS(2)
($) | |
OPTION
AWARDS(3)
($) | |
NON-EQUITY
INCENTIVE PLAN
COMPENSATION(4)
($) | |
CHANGE IN
PENSION
VALUE AND
EARNINGS
ON
NONQUALIFIED
DEFERRED
COMPENSATION(5)
($) | |
ALL OTHER
COMPENSATION(6)
($) | |
TOTAL
($) |
Brian L. Roberts
Chairman
of the Board, President and Chief Executive Officer | |
2021 | |
| 3,249,415 | | |
| 13,512,534 | | |
| 8,475,488 | | |
| 8,625,586 | | |
| 1,832 | | |
| 113,726 | | |
| 33,978,581 | |
| |
2020 | |
| 3,439,245 | | |
| 10,585,278 | | |
| 10,600,149 | | |
| 7,738,302 | | |
| 150,134 | | |
| 200,159 | | |
| 32,713,267 | |
| |
2019 | |
| 3,291,832 | | |
| 5,330,304 | | |
| 5,350,324 | | |
| 9,974,249 | | |
| 7,560,231 | | |
| 4,863,243 | | |
| 36,370,183 | |
Michael J. Cavanagh
Chief Financial Officer | |
2021 | |
| 2,300,000 | | |
| 10,072,244 | | |
| 6,315,164 | | |
| 8,625,001 | | |
| 0 | | |
| 44,587 | | |
| 27,356,996 | |
| |
2020 | |
| 2,388,462 | | |
| 7,039,868 | | |
| 7,050,441 | | |
| 5,374,039 | | |
| 3,335,892 | | |
| 62,088 | | |
| 25,250,790 | |
| |
2019 | |
| 2,285,908 | | |
| 6,725,376 | | |
| 4,749,955 | | |
| 6,926,300 | | |
| 3,831,120 | | |
| 2,280,818 | | |
| 26,799,477 | |
David N. Watson
CEO of Comcast Cable | |
2021 | |
| 2,248,077 | | |
| 6,695,556 | | |
| 4,195,328 | | |
| 8,969,828 | | |
| 565,527 | | |
| 57,625 | | |
| 22,731,941 | |
| |
2020 | |
| 2,039,794 | | |
| 4,195,048 | | |
| 4,199,443 | | |
| 5,943,952 | | |
| 3,285,243 | | |
| 25,651 | | |
| 19,689,131 | |
| |
2019 | |
| 1,813,904 | | |
| 3,237,696 | | |
| 3,251,010 | | |
| 4,580,108 | | |
| 2,522,306 | | |
| 1,534,454 | | |
| 16,939,478 | |
Jeffrey Shell
CEO of NBCUniversal | |
2021 | |
| 2,500,000 | | |
| 5,481,336 | | |
| 3,438,588 | | |
| 9,975,000 | | |
| 50,907 | | |
| 114,104 | | |
| 21,559,935 | |
| |
2020 | |
| 2,614,534 | | |
| 3,744,972 | | |
| 3,750,179 | | |
| 5,882,702 | | |
| 545,769 | | |
| 10,000 | | |
| 16,548,156 | |
Dana Strong(7)
CEO of Sky | |
2021 | |
| 2,080,679 | | |
| 3,347,778 | | |
| 2,097,664 | | |
| 8,247,836 | | |
| 23,974 | | |
| 174,091 | | |
| 15,972,022 | |
| |
|
| (1) |
In November 2021, the Compensation and Human Capital Committee and Mr. Roberts agreed
to reduce his annual base salary to $2.5 million. See “Compensation Discussion and Analysis — Compensation Decisions
— Base Salary” above for additional information. Salary amounts for 2020 included an extra bi-weekly pay period
as compared to 2019 and 2021. |
| |
|
| (2) |
Amounts represent the aggregate grant date fair value of PSUs and RSUs granted to the NEOs in
accordance with Financial Accounting Standards Board Accounting Standards Codification Topic 718, Compensation — Stock
Compensation (“FASB ASC Topic 718”). These amounts, which do not correspond to the actual values that may be realized
by the NEOs or to the values approved by the Compensation and Human Capital Committee, were calculated using the valuation
assumptions discussed in the “Share-Based Compensation” footnote to the financial statements in our Annual Reports
on Form 10-K for the years ended December 31, 2019, 2020 and 2021. The amounts were determined by multiplying the Class A
common stock closing price on the date of grant by the number of shares subject to the grant and, for PSUs as defined in the
Glossary to FASB ASC Topic 718, taking into account the probable outcome of the PSUs’ performance conditions as of the
date of grant and excluding the effect of estimated forfeitures in accordance with SEC rules. The amounts were also discounted
to consider that dividend equivalents that accrue during the vesting period are not paid out until the underlying shares vest.
The following are the values of the PSUs granted in 2021 as of their grant date assuming attainment of the maximum level of
performance: Mr. Roberts ($33,781,335), Mr. Cavanagh ($25,180,610), Mr. Watson ($16,738,890), Mr. Shell ($13,703,340) and
Ms. Strong ($8,369,445). See also “Compensation Discussion and Analysis — Compensation Decisions — Equity-Based
Compensation” for the target PSU values that the Compensation and Human Capital Committee approved for 2021, which are
lower than the amounts required to be reported in this table. |
| |
|
| (3) |
Amounts represent the aggregate grant date fair value of stock options granted to the NEOs in
accordance with FASB ASC Topic 718. Under SEC rules, the amounts shown exclude the impact of estimated forfeitures. These
amounts, which do not correspond to the actual values that may be realized by the NEOs, were calculated using the Black-Scholes
option pricing model, based upon the following valuation assumptions for options granted in March 2021 to our NEOs for their
annual option awards: an expected volatility of 22.8%, an expected term to exercise of 5.9 years, an interest rate of 0.92%
and a dividend yield of 1.84%. For information on valuation assumptions with respect to grants made before 2021, refer to
the footnotes in the “Summary Compensation Table” in our definitive proxy statements filed with the SEC in 2020
and 2019. See the “Grants of Plan-Based Awards” table below for additional information on options granted in 2021. |
| |
|
| (4) |
Amounts represent annual performance-based bonuses. Mr. Roberts’ bonus was based on his
reduced annual salary of $2.5 million, as if the reduction had been implemented at the beginning of 2021. See the “Grants
of Plan-Based Awards” table below and “Compensation Discussion and Analysis —Compensation Decisions —
Annual Cash Bonus” above for additional information on these bonuses and the achievement of specified metrics in 2021. |
| |
|
| (5) |
Amounts represent the dollar value of interest earned on compensation deferred in “income
funds” under our deferred compensation plans in excess of 120% of the long-term applicable federal rate. Effective March
2021, NEOs were prohibited from deferring compensation into the income fund and no longer earn interest above the applicable
federal rate. See “Nonqualified Deferred Compensation in and as of Fiscal Year-End” below. |
2022 Proxy Statement 47
Table of Contents
| (6) |
Amounts for 2021 include: (a) company contributions in January 2021 to our retirement-investment plan
accounts in the amount of $10,000 for each NEO; (b) amounts on account of personal use of Company-provided aircraft (Mr. Roberts,
$103,726; Mr. Cavanagh, $34,587; Mr. Watson, $47,625; Mr. Shell, $104,104; and Ms. Strong, $0), (c) certain relocation benefits
provided to Ms. Strong in connection with her appointment as CEO of Sky and her relocation from the United States to the United
Kingdom, in the amount of $150,639 and (d) costs related to executive medical benefits in the United Kingdom provided to Ms.
Strong in the amount of $13,452. Where applicable, amounts for Ms. Strong were converted from British pounds sterling to U.S.
dollars using the 2021 average of daily spot rates of £1 to $1.3757. |
| |
|
| |
For security and business reasons, Company practices and policy strongly encourage, and in some cases may require, Mr.
Roberts to use Company-provided aircraft for business and personal travel. Our other NEOs also have access to Company-provided
aircraft for personal travel, as it affords all of our NEOs greater security, allows travel time to be used productively and
enables them to be immediately available to respond to business priorities from any location. |
| |
|
| |
Our policy allows an NEO to bring guests, such as family members, on flights on Company-provided aircraft. The NEOs are
required to pay us for personal use of Company-provided aircraft in amounts determined by Company policy. The NEOs are imputed
income for costs related to use of Company-provided aircraft when required under Internal Revenue Code guidelines. We do not
reimburse the NEOs for any taxes incurred as a result of imputed income. In addition, the Internal Revenue Code limits the
amount that we can deduct for the personal use of Company-provided aircraft to the amount recognized as income by our executives
who use the aircraft; the amounts in the table above do not include our 2021 disallowed tax deduction of $9.3 million resulting
from the personal use of Company-provided aircraft by our NEOs and any guests. |
| |
|
| |
The amounts reflected for each NEO on account of personal use of Company-provided aircraft indicate the extent to which
the incremental cost of such use exceeds the amount paid to us by the NEO. The aggregate incremental cost for a personal flight
on a charter plane is the cost of the flight as charged to us by the charter company. The aggregate incremental cost for a
personal flight taken on a third party-owned plane that is serviced by us includes all variable costs attributable to that
flight (including for repositioning flights), such as fuel, trip and allocable maintenance expenses and third-party lease
payments. The aggregate incremental cost for a personal flight on a Company plane includes all variable costs for the year,
such as fuel, maintenance and other trip expenses, to arrive at a variable cost per hour that we then multiply by the number
of hours the NEO used the aircraft for personal travel (including the hours for repositioning flights). These methodologies
exclude fixed costs, as these costs do not change based on usage. Ms. Strong also has access to a Company-provided car for
personal travel, but she has fully reimbursed the Company for the incremental costs associated with such use. |
| |
|
| |
For all other benefits that would otherwise be considered perquisites, our NEOs are required to pay us in full (and have
paid us in full) for such benefits. |
| |
|
| (7) |
Ms. Strong became an executive officer in 2021 and was not an NEO for 2020 or 2019. For 2021, the portion of Ms. Strong’s
base salary paid in British pounds sterling was £1,464,072 and her cash bonus (paid in March 2022) was £5,995,374.
The amount of British pounds sterling was converted to U.S. dollars using the 2021 average of daily spot rates of £1
to $1.3757. |
Grants
of Plan-Based Awards
The table below provides information about equity and non-equity awards
granted to our NEOs in 2021 as follows: (1) the grant date for equity awards; (2) the estimated future payouts under non-equity
incentive plan awards (columns (a), (b) and (c)); (3) the estimated future payouts under equity incentive plan awards, which consist
of PSUs (columns (d), (e) and (f)); (4) option awards, which consist of the number of shares underlying stock options (column (g));
(5) the exercise price of the stock option awards, which reflects the closing price of our Class A common stock on the date of
grant (column (h)); and (6) the grant date fair value of each equity award computed in accordance with FASB ASC Topic 718 (column
(i)).
| | |
| |
ESTIMATED
FUTURE PAYOUTS UNDER
NON-EQUITY INCENTIVE PLAN
AWARDS(1)
($) | |
ESTIMATED
FUTURE PAYOUTS
UNDER EQUITY
INCENTIVE PLAN AWARDS(2) | |
ALL OTHER
OPTION
AWARDS:
NUMBER
OF
SECURITIES
UNDERLYING | |
EXERCISE
OR BASE
PRICE OF
OPTION
AWARDS | |
GRANT DATE
FAIR VALUE
OF STOCK
AND OPTION
AWARDS(4) |
| NAME | |
GRANT
DATE | |
THRESHOLD
(a) | |
TARGET
(b) | |
MAXIMUM
(c) | |
THRESHOLD
(d) | |
TARGET
(e) | |
MAXIMUM
(f) | |
OPTIONS(3)
(g) | |
($)
(h) | |
($)
(i) |
| Brian L. Roberts | |
— | |
| 1,364,754 | | |
| 9,748,245 | | |
| 18,034,253 | | |
| | | |
| | | |
| | | |
| | | |
| | | |
| | |
| |
3/1/2021 | |
| | | |
| | | |
| | | |
| 43,818 | | |
| 233,700 | | |
| 584,250 | | |
| | | |
| | | |
| 13,512,534 | |
| |
3/1/2021 | |
| | | |
| | | |
| | | |
| | | |
| | | |
| | | |
| 879,200 | | |
| 54.45 | | |
| 8,475,488 | |
| Michael J. Cavanagh | |
— | |
| 966,000 | | |
| 6,900,000 | | |
| 12,765,000 | | |
| | | |
| | | |
| | | |
| | | |
| | | |
| | |
| |
3/1/2021 | |
| | | |
| | | |
| | | |
| 32,662 | | |
| 174,200 | | |
| 435,500 | | |
| | | |
| | | |
| 10,072,244 | |
| |
3/1/2021 | |
| | | |
| | | |
| | | |
| | | |
| | | |
| | | |
| 655,100 | | |
| 54.45 | | |
| 6,315,164 | |
| David N. Watson | |
— | |
| 944,192 | | |
| 6,744,231 | | |
| 12,476,827 | | |
| | | |
| | | |
| | | |
| | | |
| | | |
| | |
| |
3/1/2021 | |
| | | |
| | | |
| | | |
| 21,712 | | |
| 115,800 | | |
| 289,500 | | |
| | | |
| | | |
| 6,695,556 | |
| |
3/1/2021 | |
| | | |
| | | |
| | | |
| | | |
| | | |
| | | |
| 435,200 | | |
| 54.45 | | |
| 4,195,328 | |
48
Table of Contents
| | |
| |
ESTIMATED
FUTURE PAYOUTS UNDER
NON-EQUITY INCENTIVE PLAN
AWARDS(1)
($) | |
ESTIMATED
FUTURE PAYOUTS
UNDER EQUITY
INCENTIVE PLAN AWARDS(2) | |
ALL
OTHER
OPTION
AWARDS:
NUMBER OF
SECURITIES
UNDERLYING | |
EXERCISE
OR BASE
PRICE OF
OPTION
AWARDS | |
GRANT DATE
FAIR VALUE
OF STOCK
AND OPTION
AWARDS(4) |
| NAME | |
GRANT
DATE | |
THRESHOLD
(a) | |
TARGET
(b) | |
MAXIMUM
(c) | |
THRESHOLD
(d) | |
TARGET
(e) | |
MAXIMUM
(f) | |
OPTIONS(3)
(g) | |
($)
(h) | |
($)
(i) |
| Jeffrey Shell | |
— | |
| 1,050,000 | | |
| 7,500,000 | | |
| 13,875,000 | | |
| | | |
| | | |
| | | |
| | | |
| | | |
| | |
| |
3/1/2021 | |
| | | |
| | | |
| | | |
| 17,775 | | |
| 94,800 | | |
| 237,000 | | |
| | | |
| | | |
| 5,481,336 | |
| |
3/1/2021 | |
| | | |
| | | |
| | | |
| | | |
| | | |
| | | |
| 356,700 | | |
| 54.45 | | |
| 3,438,588 | |
| Dana Strong(5) | |
— | |
| 868,193 | | |
| 6,201,381 | | |
| 11,472,555 | | |
| | | |
| | | |
| | | |
| | | |
| | | |
| | |
| |
3/1/2021 | |
| | | |
| | | |
| | | |
| 10,856 | | |
| 57,900 | | |
| 144,750 | | |
| | | |
| | | |
| 3,347,778 | |
| |
3/1/2021 | |
| | | |
| | | |
| | | |
| | | |
| | | |
| | | |
| 217,600 | | |
| 54.45 | | |
| 2,097,664 | |
| |
|
| (1) |
Represents annual performance-based bonus awards granted under our cash bonus plans.
The actual amounts earned with respect to these bonuses are included in the “Summary Compensation Table” above
under the “Non-Equity Incentive Plan Compensation” column. |
| |
|
| (2) |
The amounts in columns (d) through (f) represent shares of Class A common stock underlying PSUs granted under our
2002 Restricted Stock Plan that vest 100% over three years based on the achievement of the performance conditions. PSUs
will be earned based on achievement of two primary performance metrics over a three year period beginning in 2021, each
weighted 50%: (i) ROIC, calculated based on our ROIC for each year during the three-year performance period and averaged at
the end of such period to yield an average ROIC for the cumulative three-year period; and (ii) Relative Adjusted EPS Growth, calculated at the end of the cumulative three-year performance period based on the percentile
ranking of our Adjusted EPS compound average annual growth rate during the performance period relative to that of the companies
comprising the S&P 100 Index. The actual number of PSUs earned will be based on (x) the three-year average ROIC measured
against a pre-established target approved by the Compensation and Human Capital Committee in February of 2021, with achievement
level payouts ranging from 50% for threshold performance to 200% for maximum performance (with 100% as the target and linear
interpolation between specified achievement levels) and (y) Relative Adjusted EPS Growth over the three year period, with
payouts ranging from 50% for performance at the 25th percentile to 200% for performance at or above the 75th percentile, and
setting the target payout for performance at the median. For both metrics, payouts are zero for performance below the threshold. |
| |
|
| |
After calculating the ROIC and Relative Adjusted EPS Growth components, the Relative TSR Modifier
is applied, which is based on the percentile ranking of our TSR during such period relative to that of the companies comprising
the S&P 100 Index, as modified to account for changes in the index companies such as due to merger and acquisition activity.
TSR will be determined based on the average stock price of each company for the 20 trading days prior to each of the first
and last day of the performance period and will be calculated assuming the reinvestment of dividends. The actual number of
PSUs earned will be determined after multiplying the payout levels for the two primary performance metrics by 25% for top
quartile TSR performance or (25)% for bottom quartile performance, with performance in between straight-line interpolated.
If our absolute TSR over the performance period is negative, then, irrespective of our TSR percentile ranking, no positive
adjustment will be made to the payouts under the ROIC and Relative Adjusted EPS Growth components. See “Compensation
Discussion and Analysis — Design and Structure of Executive Compensation — Equity-Based Incentive Compensation”
above for additional information. Dividend equivalents accrue on shares underlying PSUs, although the amounts will only be
paid (without interest) if and when the shares underlying PSUs vest. |
| |
|
| (3) |
The amounts in this column represent shares of our Class A common stock underlying stock options
granted under our 2003 Stock Option Plan. Options become exercisable as follows: 40% of the shares become exercisable on the
second anniversary of the date of grant and an additional 20% on each of the third, fourth and fifth anniversaries of the
date of grant. |
| |
|
| (4) |
The amounts in this column represent the grant date fair value of PSUs and stock options computed in accordance with FASB
ASC Topic 718. These amounts do not necessarily correspond to the actual value that may be realized by the NEOs. The grant date
fair value of PSUs was determined as described in footnote (2) to the “Summary Compensation Table.” Amounts with respect
to stock options were calculated using the Black-Scholes option pricing model, based upon the assumptions set forth in footnote
(3) to the “Summary Compensation Table.” |
| |
|
| (5) |
For 2021, Ms. Strong’s estimated future payouts in British pounds sterling under our annual cash bonus plan at threshold,
target and maximum levels were £631,092, £4,507,800 and £8,339,431 respectively. The amount of British pounds
sterling was converted to U.S. dollars using the 2021 average of daily spot rates of £1 to $1.3757. |
2022 Proxy Statement 49
Table of Contents
Outstanding
Equity Awards at Fiscal Year-End
The following table provides information on the holdings of stock
options and stock awards by our NEOs as of December 31, 2021. This table includes unexercised vested and unvested options to purchase
shares of Class A common stock (see columns (a), (b), (c) and (d)), unvested RSUs with respect to shares of Class A common stock
(see columns (e) and (f)) and unvested PSUs with respect to shares of Class A common stock (see columns (g) and (h)). The vesting
schedules for these grants are disclosed in the footnotes to this table. The market value of stock awards is based on the closing
market price of a share of our Class A common stock as of December 31, 2021, or $50.33.
| | |
OPTION AWARDS | |
STOCK AWARDS |
| NAME | |
NUMBER OF
SECURITIES
UNDERLYING
UNEXERCISED
OPTIONS
EXERCISABLE
(a) | |
NUMBER OF
SECURITIES
UNDERLYING
UNEXERCISED
OPTIONS
UNEXERCISABLE(2)
(b) | |
OPTION
EXERCISE
PRICE
($)
(c) | |
OPTION
EXPIRATION
DATE
(d) | |
NUMBER OF
SHARES OR
UNITS OF
STOCK THAT
HAVE NOT
VESTED(3)(4)
(e) | |
MARKET
VALUE OF
SHARES OR
UNITS OF
STOCK
THAT HAVE
NOT VESTED
($)
(f) | |
EQUITY
INCENTIVE
PLAN AWARDS:
NUMBER OF
UNEARNED
SHARES,
UNITS OR
OTHER
RIGHTS
THAT HAVE
NOT VESTED(3)(4)
(g) | |
EQUITY
INCENTIVE
PLAN AWARDS:
MARKET VALUE
OR PAYOUT
VALUE OF
UNEARNED
SHARES,
UNITS OR OTHER
RIGHTS THAT
HAVE
NOT VESTED
($)
(h) |
| Brian L. Roberts | |
| | | |
| | | |
| | | |
| | | |
| | | |
| | | |
| 1,138,846 | | |
| 57,318,119 | |
| |
| 1,090,800 | | |
| 121,200 | | |
| 20.610 | | |
| 03/21/2023 | | |
| | | |
| | | |
| | | |
| | |
| | |
| 820,250 | | |
| 144,750 | | |
| 25.000 | | |
| 03/20/2024 | | |
| | | |
| | | |
| | | |
| | |
| | |
| 726,080 | | |
| 181,520 | | |
| 29.725 | | |
| 03/19/2025 | | |
| | | |
| | | |
| | | |
| | |
| | |
| 701,100 | | |
| 233,700 | | |
| 29.880 | | |
| 03/17/2026 | | |
| | | |
| | | |
| | | |
| | |
| | |
| 461,280 | | |
| 307,520 | | |
| 37.460 | | |
| 03/16/2027 | | |
| | | |
| | | |
| | | |
| | |
| | |
| 336,780 | | |
| 411,620 | | |
| 35.830 | | |
| 03/15/2028 | | |
| | | |
| | | |
| | | |
| | |
| | |
| 202,920 | | |
| 473,480 | | |
| 40.470 | | |
| 03/14/2029 | | |
| | | |
| | | |
| | | |
| | |
| | |
| — | | |
| 1,623,300 | | |
| 42.520 | | |
| 03/01/2030 | | |
| | | |
| | | |
| | | |
| | |
| | |
| — | | |
| 879,200 | | |
| 54.450 | | |
| 02/28/2031 | | |
| | | |
| | | |
| | | |
| | |
| Michael J. Cavanagh | |
| | | |
| | | |
| | | |
| | | |
| | | |
| | | |
| 887,736 | | |
| 44,679,753 | |
| |
| 571,968 | (1) | |
| 142,992 | | |
| 28.320 | | |
| 05/14/2025 | | |
| | | |
| | | |
| | | |
| | |
| | |
| 524,400 | (1) | |
| 174,800 | | |
| 29.880 | | |
| 03/17/2026 | | |
| | | |
| | | |
| | | |
| | |
| | |
| 344,820 | (1) | |
| 229,880 | | |
| 37.460 | | |
| 03/16/2027 | | |
| | | |
| | | |
| | | |
| | |
| | |
| 251,865 | (1) | |
| 307,835 | | |
| 35.830 | | |
| 03/15/2028 | | |
| | | |
| | | |
| | | |
| | |
| | |
| 180,150 | | |
| 420,350 | | |
| 40.470 | | |
| 03/14/2029 | | |
| | | |
| | | |
| | | |
| | |
| | |
| — | | |
| 1,079,700 | | |
| 42.520 | | |
| 03/01/2030 | | |
| | | |
| | | |
| | | |
| | |
| | |
| — | | |
| 655,100 | | |
| 54.450 | | |
| 02/28/2031 | | |
| | | |
| | | |
| | | |
| | |
| David N. Watson | |
| | | |
| | | |
| | | |
| | | |
| 13,360 | | |
| 672,409 | | |
| 551,197 | | |
| 27,741,745 | |
| |
| 169,000 | | |
| — | | |
| 14.995 | | |
| 03/22/2022 | | |
| | | |
| | | |
| | | |
| | |
| | |
| 185,460 | | |
| 28,440 | | |
| 20.610 | | |
| 03/21/2023 | | |
| | | |
| | | |
| | | |
| | |
| | |
| 191,760 | | |
| 33,840 | | |
| 25.000 | | |
| 03/20/2024 | | |
| | | |
| | | |
| | | |
| | |
| | |
| 169,920 | | |
| 42,480 | | |
| 29.725 | | |
| 03/19/2025 | | |
| | | |
| | | |
| | | |
| | |
| | |
| 140,450 | | |
| 54,650 | | |
| 29.880 | | |
| 03/17/2026 | | |
| | | |
| | | |
| | | |
| | |
| | |
| 107,700 | | |
| 71,800 | | |
| 37.460 | | |
| 03/16/2027 | | |
| | | |
| | | |
| | | |
| | |
| | |
| 172,980 | | |
| 211,420 | | |
| 35.830 | | |
| 03/15/2028 | | |
| | | |
| | | |
| | | |
| | |
| | |
| 123,300 | | |
| 287,700 | | |
| 40.470 | | |
| 03/14/2029 | | |
| | | |
| | | |
| | | |
| | |
| | |
| — | | |
| 643,100 | | |
| 42.520 | | |
| 03/01/2030 | | |
| | | |
| | | |
| | | |
| | |
| | |
| — | | |
| 435,200 | | |
| 54.450 | | |
| 02/28/2031 | | |
| | | |
| | | |
| | | |
| | |
50
Table of Contents
| | |
OPTION
AWARDS | |
STOCK
AWARDS |
| NAME | |
NUMBER
OF
SECURITIES
UNDERLYING
UNEXERCISED
OPTIONS
EXERCISABLE
(a) | |
NUMBER
OF
SECURITIES
UNDERLYING
UNEXERCISED
OPTIONS
UNEXERCISABLE(2)
(b) | |
OPTION
EXERCISE
PRICE
($)
(c) | |
OPTION
EXPIRATION
DATE
(d) | |
NUMBER
OF
SHARES OR
UNITS OF
STOCK THAT
HAVE NOT
VESTED(3)(4)
(e) | |
MARKET
VALUE OF
SHARES OR
UNITS OF
STOCK
THAT HAVE
NOT VESTED
($)
(f) | |
EQUITY
INCENTIVE
PLAN AWARDS:
NUMBER OF
UNEARNED
SHARES,
UNITS OR
OTHER
RIGHTS
THAT HAVE
NOT VESTED(3)(4)
(g) | |
EQUITY
INCENTIVE
PLAN AWARDS:
MARKET VALUE
OR PAYOUT
VALUE OF
UNEARNED
SHARES,
UNITS OR OTHER
RIGHTS
THAT
HAVE
NOT VESTED
($)
(h) |
| Jeffrey Shell | |
| | | |
| | | |
| | | |
| | | |
| 148,701 | | |
| 7,484,121 | | |
| 330,711 | | |
| 16,644,685 | |
| |
| 90,912 | | |
| 212,128 | | |
| 44.090 | | |
| 12/19/2029 | | |
| | | |
| | | |
| | | |
| | |
| | |
| — | | |
| 574,300 | | |
| 42.520 | | |
| 03/01/2030 | | |
| | | |
| | | |
| | | |
| | |
| | |
| — | | |
| 356,700 | | |
| 54.450 | | |
| 02/28/2031 | | |
| | | |
| | | |
| | | |
| | |
| Dana Strong | |
| | | |
| | | |
| | | |
| | | |
| 92,890 | | |
| 4,675,154 | | |
| 158,341 | | |
| 7,969,303 | |
| |
| 36,528 | | |
| 133,936 | | |
| 31.810 | | |
| 04/26/2028 | | |
| | | |
| | | |
| | | |
| | |
| | |
| 56,850 | | |
| 132,650 | | |
| 40.470 | | |
| 03/14/2029 | | |
| | | |
| | | |
| | | |
| | |
| | |
| — | | |
| 229,600 | | |
| 42.520 | | |
| 03/01/2030 | | |
| | | |
| | | |
| | | |
| | |
| | |
| — | | |
| 217,600 | | |
| 54.450 | | |
| 02/28/2031 | | |
| | | |
| | | |
| | | |
| | |
| |
|
| (1) |
Mr. Cavanagh assigned to a family trust a portion of his vested stock options as follows:
representing 321,732 shares from the stock options expiring on May 14, 2025; representing 419,520 shares from the stock options
expiring on March 17, 2026; representing 258,615 shares from the stock options expiring on March 16, 2027 and representing
167,910 shares from the stock options expiring on March 15, 2028. |
| |
|
| (2) |
The expiration date occurs one day prior to the tenth anniversary of the grant date. Stock options
that expire on or prior to March 1, 2030 have the following vesting schedule: 30%, 15%, 15%, 15%, 5%, 5%, 5%, 5% and 5% on
the second, third, fourth, fifth, sixth, seventh, eighth, ninth, and nine and a half anniversaries of the grant date, respectively.
Stock options that expire on February 28, 2031 have the following vesting schedule: 40%, 20%, 20% and 20% on the second, third,
fourth and fifth anniversaries of the grant date, respectively. |
| |
|
| (3) |
Our equity awards contain provisions for continued vesting upon certain employees attaining retirement
eligible status. This table does not reflect accelerated vesting resulting from the attainment of retirement eligible status.
See “Potential Payments upon Termination or Change in Control” for additional information. |
| |
|
| (4) |
The number of shares underlying each outstanding stock unit(a) for the NEOs that remain
subject to vesting are as follows: |
| |
|
| GRANT
DATE | |
BRIAN
L.
ROBERTS | |
MICHAEL
J.
CAVANAGH | |
DAVID
N.
WATSON | |
JEFFREY
SHELL | |
DANA
STRONG |
| 03/01/2017 | |
| — | | |
| — | | |
| — | | |
| 26,608 | | |
| — | |
| 03/17/2017 | |
| 71,400 | (b) | |
| 53,400 | (b) | |
| 13,360 | | |
| — | | |
| — | |
| 04/14/2017 | |
| — | | |
| — | | |
| 33,660 | (b) | |
| — | | |
| — | |
| 03/01/2018 | |
| — | | |
| — | | |
| — | | |
| 37,631 | | |
| — | |
| 03/16/2018 | |
| 102,643 | (c) | |
| 76,725 | (c) | |
| 52,800 | (c) | |
| — | | |
| — | |
| 04/27/2018 | |
| — | | |
| — | | |
| — | | |
| — | | |
| 25,938 | |
| 02/01/2019 | |
| — | | |
| — | | |
| — | | |
| — | | |
| 13,591 | (d) |
| 03/01/2019 | |
| — | | |
| — | | |
| — | | |
| 44,758 | | |
| — | |
| 03/15/2019 | |
| 115,674 | (e) | |
| 145,950 | (e) | |
| 70,262 | (e) | |
| — | | |
| 25,970 | |
| 10/11/2019 | |
| — | | |
| — | | |
| — | | |
| — | | |
| 10,977 | (f) |
| 12/20/2019 | |
| — | | |
| — | | |
| — | | |
| 39,704 | | |
| — | |
| 03/02/2020 | |
| 264,879 | (g) | |
| 176,161 | (g) | |
| 104,975 | (g) | |
| 93,711 | (g) | |
| 30,005 | |
| 03/01/2021 | |
| 584,250 | (h) | |
| 435,500 | (h) | |
| 289,500 | (h) | |
| 237,000 | (h) | |
| 144,750 | (h) |
2022 Proxy Statement 51
Table of Contents
| (a) |
Except as otherwise described in footnotes below, all stock units granted as of the
respective grant date had the following vesting schedule: 15%, 15%, 15%, 15% and 40% on the 13-month, second, third, fourth
and fifth anniversaries of the grant date, respectively, with Mr. Shell’s first vesting date for his 2017 grant being
twelve months after the grant date. |
| |
|
| (b) |
Reflects the number of shares underlying PSUs that, as of December 31, 2021, has been achieved
at maximum attainment of the performance condition, resulting in 125% vesting of the award. In early 2022, the Compensation
and Human Capital Committee certified performance for the fifth tranche of PSUs, resulting in attainment of the award at the
maximum achievement of 125%. |
| |
|
| (c) |
Reflects the number of shares underlying PSUs that, as of December 31, 2021, has been achieved
at maximum attainment of the performance condition, resulting in 125% vesting of the award. In early 2022, the Compensation
and Human Capital Committee certified performance for the fourth tranche of PSUs, resulting in attainment of the award at
the maximum achievement of 125% of the award. Because the performance condition for the fourth tranche was achieved at 125%
(the maximum performance achievement), all remaining tranches of the PSUs will also be earned at 125% of the target shares. |
| |
|
| (d) |
In late 2021, the Compensation and Human Capital Committee certified performance for the third
tranche of PSUs, resulting in attainment of 100% achievement of the award. The stock units vest one-third on the 13-month,
second and third anniversaries of the grant date, respectively. |
| |
|
| (e) |
Reflects the number of shares underlying PSUs that, as of December 31, 2021, has been achieved
at maximum attainment of the performance condition, resulting in 125% vesting of the award. In early 2022, the Compensation
and Human Capital Committee certified performance for the third tranche of PSUs, resulting in maximum attainment of 125% of
the award. Because the performance condition for the third tranche was achieved at 125% (the maximum performance achievement),
all remaining tranches of the PSUs will also be earned at 125% of the target shares. |
| |
|
| (f) |
The stock units vest one-third on the 13-month, second and third anniversaries of the grant date,
respectively. |
| |
|
| (g) |
Reflects the number of shares underlying PSUs that, as of December 31, 2021, has been achieved
at maximum attainment of the performance condition, resulting in 125% vesting of the award. In early 2022, the Compensation
and Human Capital Committee certified performance for the second tranche of PSUs, resulting in maximum attainment of 125%
of the award. Because the performance condition for the second tranche was achieved at 125% (the maximum performance achievement),
all remaining tranches of the PSUs will also be earned at 125% of the target shares. The PSUs granted to Mr. Shell had the
following vesting schedule: 15%, 15%, 15%, 15% and 40% on the first, second, third, fourth and fifth anniversaries of the
grant date, respectively. |
| |
|
| (h) |
Reflects the number of shares underlying PSUs that, as of December 31, 2021, may be achieved assuming
maximum attainment of the performance condition, which would result in 250% vesting of the award. The Compensation and Human
Capital Committee will certify actual performance achievement of the PSUs in early 2024. The PSUs vest 100% on the 3-year
anniversary of the date of grant. |
Option
Exercises and Stock Vested
The following table provides information, for each of our NEOs, on
the number of options exercised and the value realized upon such exercise, and the number of shares of Class A common stock resulting
from the vesting of stock awards and the value realized before payment of any applicable withholding tax during 2021.
| | |
OPTION
AWARDS | |
STOCK
AWARDS |
| NAME | |
NUMBER OF
SHARES
ACQUIRED ON
EXERCISE | |
VALUE
REALIZED ON
EXERCISE
($) | |
NUMBER OF
SHARES
ACQUIRED
ON VESTING | |
VALUE
REALIZED ON
VESTING
($) |
| Brian L. Roberts | |
| 2,988,000 | | |
| 112,071,190 | | |
| 68,608 | (1) | |
| 3,958,652 | |
| Michael J. Cavanagh | |
| — | | |
| — | | |
| 115,091 | (1) | |
| 6,540,905 | |
| David N. Watson | |
| 409,314 | | |
| 16,460,024 | | |
| 56,349 | | |
| 3,177,501 | |
| Jeffrey Shell | |
| — | | |
| — | | |
| 68,088 | | |
| 3,655,821 | |
| Dana Strong | |
| — | | |
| — | | |
| 42,502 | (1) | |
| 2,248,981 | |
| |
|
| (1) |
Mr. Roberts deferred the receipt of shares relating to 17,691, 21,637 and 21,879 of
these PSUs that vested on March 15, 2021, March 16, 2021 and March 17, 2021, respectively. Mr. Cavanagh deferred the receipt
of shares relating to 47,789 of these PSUs that vested on March 18, 2021. The value of the stock units realized on vesting
is based on the value of a share of Class A common stock on the vesting date, regardless of whether the receipt of the shares
underlying the PSUs had been deferred. The actual value of the stock units realized upon settlement may be different than
the value reflected in this table. The value realized on vesting also is reflected in the “Executive Contributions in
Last FY” column of the “Nonqualified Deferred Compensation in and as of Fiscal Year-End” table immediately
below. |
52
Table of Contents
Nonqualified
Deferred Compensation in and as of Fiscal Year-End
The table below provides information on the nonqualified deferred
compensation of our NEOs in and as of the end of 2021.(1)
| NAME | |
TYPE
OF
INVESTMENT
FUND | |
EXECUTIVE
CONTRIBUTIONS
IN LAST FY(2)
($) | |
AGGREGATE
EARNINGS IN
LAST FY(3)
($) | |
AGGREGATE
WITHDRAWALS/
DISTRIBUTIONS
($) | |
AGGREGATE
BALANCE AT
LAST FYE(4)
($) |
| Brian L. Roberts | |
Income Fund | |
| — | (5) | |
| 2,132 | | |
| (1,465,395 | ) | |
| — | |
| | |
Market Funds | |
| 11,269,919 | (5) | |
| 10,484,354 | (5) | |
| — | | |
| 139,390,356 | |
| Michael J. Cavanagh | |
Income Fund | |
| — | (5) | |
| — | | |
| — | | |
| — | |
| | |
Market Funds | |
| 2,669,971 | (5) | |
| 2,608,840 | (5) | |
| (14,393,021 | ) | |
| 70,668,620 | |
| David N. Watson | |
Income Fund | |
| — | | |
| 662,811 | | |
| — | | |
| — | |
| | |
Market Funds | |
| — | | |
| 1,360,173 | | |
| — | | |
| 39,324,396 | |
| Jeffrey Shell | |
Income Fund | |
| — | | |
| 62,676 | | |
| (4,507,626 | ) | |
| — | |
| | |
Market Funds | |
| 4,186,131 | | |
| (361,695 | ) | |
| — | | |
| 8,049,434 | |
| Dana Strong | |
Income Fund | |
| 69,902 | | |
| 29,517 | | |
| — | | |
| — | |
| | |
Market Funds | |
| 896,003 | (5) | |
| 135,548 | (5) | |
| — | | |
| 3,212,982 | |
| |
|
| (1) |
Amounts in this table have been deferred under our deferred compensation plans, except
for deferrals of stock units with respect to shares of Class A common stock under our restricted stock plan, as more fully
described in footnote (5) to this table. Eligible employees and directors may participate in these plans. Since March 1, 2021,
amounts credited to an NEO’s account must be invested notionally in a third-party mutual or exchange fund or our company’s
common stock fund. Before March 2021, NEOs were permitted to invest amounts instead in an income fund with an interest crediting
rate of 9%, or 12% for certain grandfathered amounts. |
| |
|
| |
Under our restricted stock plan, eligible employees may defer the receipt of shares that may, subject
to an award of stock units, vest in the future. Upon vesting, deferred stock units are invested in our company stock fund.
An employee who has elected to defer stock units may also make a “diversification election” of the shares subject
to such stock units (or such greater percentage authorized by the Compensation and Human Capital Committee) to have the value
of such stock units transferred to our deferred compensation plans. |
| |
|
| |
During 2021, (i) the annual rates of return under the third-party mutual or exchange funds were
as follows: 5.93%, -1.7%, 28.69%, 12.45%, 25.44%, -10.36%, 7.76%, 1.36% and 11.50%, and (ii) the annual rate of return under
our company stock fund was -2.22%. |
| |
|
| (2) |
These amounts (other than amounts related to deferrals of PSUs) are reported as compensation in
the “Summary Compensation Table” above under the columns “Salary” and “Non-Equity Incentive
Plan Compensation.” |
| |
|
| (3) |
The portion of these amounts that represents interest earned in excess of 120% of the long-term
applicable federal rate is reported as compensation in the “Summary Compensation Table” above under the column
“Change in Pension Value and Earnings on Nonqualified Deferred Compensation.” |
| |
|
| (4) |
All amounts contributed in prior years under our deferred compensation plans have been reported
in the Summary Compensation Table in previously filed proxy statements in the year earned to the extent an individual was
an NEO for purposes of the SEC’s executive compensation disclosure. The grant date fair value of stock units deferred
under our restricted stock plan has been reported in the year granted in the Summary Compensation Table in previously filed
proxy statements. Fiscal year-end balances for each fund include net transfers between funds that occurred during the year. |
| |
|
| (5) |
Pursuant to our restricted stock plan, as described in footnote (1) to this table, (i) Mr. Roberts
deferred the settlement of 17,691 PSUs, 21,637 PSUs and 21,879 PSUs that vested on March 15, 2021, March 16, 2021 and March
17, 2021, respectively, and (ii) Mr. Cavanagh deferred the settlement of 47,789 PSUs that vested on March 18, 2021. The amounts
shown in the “Market Funds” row of the “Executive Contributions in Last FY” column reflect the aggregate
value of (i) stock units that were deferred in 2021 as of their respective vesting dates and (ii) amounts deemed invested
in third-party mutual or exchange funds under our deferred compensation plans; the amounts shown in the “Market Funds”
row of the “Aggregate Earnings in Last FY” column reflect the value of any aggregate gain or loss in 2021. |
Agreements
with Our Named Executive Officers
Each of our NEOs has an employment agreement with us that has the
following key provisions. Mr. Roberts’ agreement was effective as of August 1, 2017 and provides for an initial term of employment
through July 31, 2020, which term will be extended automatically by one additional day for each day that elapses after August 1,
2017 (so that the term of the agreement will always be three years), unless otherwise terminated by either party in accordance
with the employment agreement. Mr. Cavanagh’s agreement was entered into on December 21, 2018 and secures his employment
through December 31, 2023. Mr. Watson’s agreement was entered into on March 1, 2018 and, as amended, secures his employment
through June 30, 2025. Mr. Shell’s agreement was entered into on February 19, 2020 and secures his employment through December
31, 2024. Ms. Strong’s agreement was entered into on January 1, 2021 and secures her employment through December 31, 2025.
2022 Proxy Statement 53
Table of Contents
Each of the employment agreements provides for a base salary either
as specified in the agreement or otherwise then in effect. An NEO’s salary may not be reduced, except under an overall plan
to reduce the salary on a basis consistent with other senior executives at their respective levels. The NEOs also are eligible
to receive an annual performance bonus, payable in cash, of a percentage of their respective base salaries for the applicable year.
Each NEO’s target bonus opportunity may not be less than 300% of their respective base salaries if all performance targets
are achieved. Our NEOs are also entitled to receive certain severance benefits under their respective agreements in the event of
a qualifying termination of employment as described under the “Potential Payments upon Termination or Change in Control”
table below.
Under the agreements, each NEO has agreed not to compete with us during
their employment and, in the event their employment terminates other than by us without cause or by them with good reason, for
one year after termination of their employment.
Each of our NEOs has agreed not to solicit our employees or customers
for one year after termination of their employment and is subject to confidentiality covenants. Each has agreed to maintain the
confidentiality of our information and not to use such information, except for our benefit, at all times during and after their
employment with us.
Potential
Payments upon Termination or Change in Control
The table below describes the payments and benefits to which each
of our NEOs would have been entitled (i) had their employment terminated on December 31, 2021 (a) by us without cause or by them
with good reason, (b) because of their death, (c) due to their disability or (d) upon their retirement or (ii) upon a change in
control. In addition to the specific payments and benefits described below for each NEO, our NEOs also would have been entitled
to receive any benefits due under the terms of our benefit plans and programs, including our deferred compensation plans described
in further detail in the “Nonqualified Deferred Compensation in and as of Fiscal Year-End” table above. All amounts
are estimates only, and actual amounts will vary depending upon the facts and circumstances applicable at the time of the triggering
event.
| NAME | |
BASE
SALARY
CONTINUATION
($) | |
ANNUAL
CASH BONUS
CONTINUATION
($) | |
ACCRUED
ANNUAL CASH
BONUS
($) | |
ACCELERATION/
CONTINUED
VESTING &
EXERCISABILITY
OF UNVESTED
STOCK
OPTIONS(1)
($) | |
ACCELERATION/
CONTINUED
VESTING OF
UNVESTED
STOCK UNITS(1)
($) | |
HEALTH
BENEFIT
CONTINUATION
($) | |
TOTAL
($) |
| Brian L. Roberts | |
| |
| |
| |
| |
| |
| |
|
| Without Cause/With Good Reason(2) | |
| 7,500,000 | | |
| 22,500,000 | | |
| 9,748,245 | | |
| 43,060,724 | | |
| 34,852,317 | | |
| 35,176 | | |
| 117,696,462 | |
| Death(3) | |
| — | | |
| — | | |
| 9,748,245 | | |
| 43,060,724 | | |
| 34,852,317 | | |
| 211,056 | | |
| 87,872,342 | |
| Disability(4) | |
| 7,500,000 | | |
| 22,500,000 | | |
| 9,748,245 | | |
| 43,060,724 | | |
| 34,852,317 | | |
| — | | |
| 117,661,286 | |
| Retirement(5) | |
| — | | |
| — | | |
| — | | |
| 43,060,724 | | |
| 34,852,317 | | |
| — | | |
| 77,913,041 | |
| Change in Control(6) | |
| — | | |
| — | | |
| — | | |
| — | | |
| — | | |
| — | | |
| — | |
| Michael
J. Cavanagh | |
| | | |
| | | |
| | | |
| | | |
| | | |
| | | |
| | |
| Without Cause/With Good Reason(7) | |
| 4,600,000 | | |
| 6,900,000 | | |
| 6,900,000 | | |
| 10,106,156 | | |
| 5,885,238 | | |
| 30,096 | | |
| 34,421,490 | |
| Death/Disability(8) | |
| 575,000 | | |
| — | | |
| 6,900,000 | | |
| 26,721,185 | | |
| 27,544,502 | | |
| — | | |
| 61,740,687 | |
| Retirement(5) | |
| — | | |
| — | | |
| — | | |
| — | | |
| — | | |
| — | | |
| — | |
| Change in Control(6) | |
| — | | |
| — | | |
| — | | |
| — | | |
| — | | |
| — | | |
| — | |
| David
N. Watson | |
| | | |
| | | |
| | | |
| | | |
| | | |
| | | |
| | |
| Without Cause/With Good Reason(7) | |
| 4,600,000 | | |
| 6,900,000 | | |
| 6,744,231 | | |
| 4,870,550 | | |
| 4,007,728 | | |
| 23,451 | | |
| 27,145,960 | |
| Death/Disability(8) | |
| 575,000 | | |
| — | | |
| 6,744,231 | | |
| 15,544,286 | | |
| 17,214,018 | | |
| — | | |
| 40,077,535 | |
| Retirement(5) | |
| — | | |
| — | | |
| — | | |
| 15,544,286 | | |
| 17,214,018 | | |
| — | | |
| 32,758,304 | |
| Change in Control(6) | |
| — | | |
| — | | |
| — | | |
| — | | |
| — | | |
| — | | |
| — | |
54
Table of Contents
| NAME | |
BASE
SALARY
CONTINUATION
($) | |
ANNUAL
CASH BONUS
CONTINUATION
($) | |
ACCRUED
ANNUAL CASH
BONUS
($) | |
ACCELERATION/
CONTINUED
VESTING &
EXERCISABILITY
OF UNVESTED
STOCK
OPTIONS(1)
($) | |
ACCELERATION/
CONTINUED
VESTING OF
UNVESTED
STOCK UNITS(1)
($) | |
HEALTH
BENEFIT
CONTINUATION
($) | |
TOTAL
($) |
| Jeffrey Shell | |
| |
| |
| |
| |
| |
| |
|
| Without Cause/With Good Reason(7) |
| 5,000,000 | | |
| 7,500,000 | | |
| 7,500,000 | | |
| 1,629,230 | | |
| 3,432,506 | | |
| 29,803 | | |
| 25,091,539 | |
| Death/Disability(8) | |
| 625,000 | | |
| — | | |
| 7,500,000 | | |
| 5,808,962 | | |
| 16,028,645 | | |
| — | | |
| 29,962,607 | |
| Retirement(5) | |
| — | | |
| — | | |
| — | | |
| — | | |
| — | | |
| — | | |
| — | |
| Change in Control(6) | |
| — | | |
| — | | |
| — | | |
| — | | |
| — | | |
| — | | |
| — | |
| Dana Strong | |
| | | |
| | | |
| | | |
| | | |
| | | |
| | | |
| | |
| Without Cause/With Good Reason(7) |
| 4,134,254 | | |
| 6,201,380 | | |
| 6,201,380 | | |
| 1,494,722 | | |
| 2,139,126 | | |
| 60,378 | | |
| 20,231,240 | |
| Death/Disability(8) | |
| 516,782 | | |
| — | | |
| 6,201,380 | | |
| 5,581,600 | | |
| 8,273,296 | | |
| — | | |
| 20,573,058 | |
| Retirement(5) | |
| — | | |
| — | | |
| — | | |
| — | | |
| — | | |
| — | | |
| — | |
| Change in Control(6) | |
| — | | |
| — | | |
| — | | |
| — | | |
| — | | |
| — | | |
| — | |
| |
|
| (1) |
Based on the closing market price of a share of our Class A common stock as of December
31, 2021 ($50.33), minus, in the case of stock options, the exercise price. PSUs are also based on the target vesting. |
| |
|
| (2) |
Mr. Roberts’ termination without cause or with good reason would entitle him to (i) payment
of his base salary on a monthly basis for three years after the termination date, (ii) payment of his annual cash bonus (appropriately
prorated for partial calendar years), assuming full achievement of performance goals, on an annual basis for three years and
(iii) vesting of his unvested stock options and stock units in accordance with their terms as if his employment had continued.
Mr. Roberts’ receipt of the payments and benefits is subject to his execution of our standard agreement containing certain
mutual releases. Mr. Roberts is also entitled to receive a prorated annual cash bonus for the year of his termination, assuming
full achievement of the performance goals, and to continued health and welfare benefits for three years after the termination
date. |
| |
|
| (3) |
Upon Mr. Roberts’ death, his unvested stock options and stock units will vest in full and
his options will remain exercisable for the remainder of their terms. His spouse or his or her estate will receive payment
of his annual cash bonus, prorated to reflect the number of days he was employed during the year of his death (assuming full
achievement of the performance goals), and his spouse will receive health and welfare benefits during her lifetime. |
| |
|
| (4) |
If Mr. Roberts’ employment is terminated by reason of his disability, we must continue to
pay his base salary on a monthly basis for three years, his annual cash bonus (appropriately prorated for partial calendar
years), assuming full achievement of performance goals, on an annual basis for three years, and his unvested stock options
and stock units will vest in full and his options will remain exercisable for the remainder of their term. In the event of
Mr. Roberts’ death prior to the end of such three-year period, no remaining payments will be made. Mr. Roberts is also
entitled to receive a prorated annual cash bonus for the year of his termination, assuming full achievement of the performance
goals. |
| |
|
| (5) |
Certain senior executives, including our NEOs, are entitled to continued vesting on retirement.
For stock option awards granted before 2021, NEOs who reach the age of 62 are entitled to the continued vesting and exercisability
of options following termination for (a) 36 and 39 months, respectively, with 10 years of service, (b) 60 and 63 months, respectively,
with 15 years of service and (c) 114 and 117 months, respectively, with 20 years of service, provided that no option will
be exercisable after the 10th anniversary of the date of grant. For stock units granted before 2021, NEOs who reach the age
of 62 are entitled to the continued vesting of stock units following termination for (x) 36 months with 10 years of service,
(y) 48 months with 15 years of service and (z) 60 months with 20 years of service. For stock option and PSU awards granted
in 2021, NEOs qualify for continued vesting on retirement when the sum of the NEO’s age and completed years of service
equals or exceeds 70 (provided that the NEO has reached age 62 and completed 5 years of service). |
| |
|
| (6) |
None of our NEOs’ employment agreements provides for the automatic accelerated vesting of
equity awards in connection with a change in control (a “single trigger”), and none of our NEOs’ employment
agreements, other than Mr. Roberts’, provides for the automatic accelerated vesting of equity awards upon the occurrence
of one or more specified events that may follow a change in control, such as a termination of employment (a “double
trigger”). Under Mr. Roberts’ employment agreement, if we were to terminate Mr. Roberts’ employment following
a change in control transaction, it would be treated as a termination without cause and he would be entitled to the same amounts
set forth in the “Without Cause/With Good Reason” category, as described in footnote (2) to this table. |
2022 Proxy Statement 55
Table of Contents
| (7) |
If we terminate such executive’s employment without cause or the executive terminates with good reason, they will receive their then-current base salary for a period of 24 months. Messrs. Cavanagh and Watson are entitled to receive continued health benefits for a period of 24 months, and Mr. Shell and Ms. Strong are entitled to receive continued health benefits for a period of 18 months. If the executive becomes reemployed, these payments will be reduced by the amount of any compensation earned or received by the executive in respect of such period and we will stop providing health and welfare benefits. Such executive will receive the full (non-prorated) amount of the current year’s annual cash bonus (assuming full achievement of performance goals) and the following year’s target annual cash bonus (prorated for time employed during the year of termination and assuming full achievement of performance goals). Stock options and stock units will continue to vest in accordance with their respective terms for 12 months following termination, and vested stock options will remain exercisable for a period equal to the lesser of 15 months or the end of the stock options’ term. Mr. Roberts and Mr. Watson, who are over the age of 62, are entitled to receive retirement-related compensation as set forth in footnote (5) to this table. The executives’ receipt of the payments and benefits described above are subject to execution of our standard agreement containing certain mutual releases. |
| |
|
| (8) |
If such executive’s employment terminates due to his death or disability, the executive or his or her estate will receive three months of base salary and payment of annual cash bonus, prorated for time employed during the year of such termination (assuming full achievement of performance goals), and stock options and stock units will fully vest, with stock options remaining exercisable for the remainder of their terms. |
Equity
Compensation Plan Information
The following table summarizes our equity plan information as of December
31, 2021.
| PLAN CATEGORY | |
NUMBER OF SECURITIES
TO
BE ISSUED UPON EXERCISE
OF OUTSTANDING OPTIONS,
WARRANTS AND RIGHTS(1)
(a) | |
WEIGHTED-AVERAGE
EXERCISE PRICE
OF OUTSTANDING
OPTIONS, WARRANTS
AND RIGHTS(2)
($)
(b) | |
NUMBER OF SECURITIES
REMAINING AVAILABLE FOR
FUTURE ISSUANCE UNDER
EQUITY COMPENSATION PLANS
EXCLUDING SECURITIES
REFLECTED IN COLUMN (A)(3)
(c) |
| Equity compensation plans
approved by security holders | |
| 256,954,530 | | |
| 40.44 | | |
| 488,693,199 | |
| Equity compensation plans not approved by
security holders | |
| — | | |
| | | |
| — | |
| Total | |
| 256,954,530 | | |
| | | |
| 488,693,199 | |
| |
|
| (1) |
Includes shares of Class A common stock under the following plans: 2003 Stock Option
Plan, 2002 Restricted Stock Plan (under which RSUs and PSUs have been granted), Comcast Corporation 2002 Employee Stock Purchase
Plan, Comcast-NBCUniversal 2011 Employee Stock Purchase Plan and 2019 Omnibus Sharesave Plan. Also includes our 2002 and 2005
Deferred Compensation Plans (under which shares of Class A common stock have been credited to participants’ accounts). |
| |
|
| (2) |
The weighted-average exercise price only reflects stock options under our 2003 Stock Option Plan. |
| |
|
| (3) |
The number of shares available for issuance includes the following number of shares of Class A
common stock: 384,544,616 shares available for issuance under the 2003 Stock Option Plan; 74,633,199 shares available for
issuance under the 2002 Restricted Stock Plan; 5,627,980 shares available for issuance under the 2019 Omnibus Sharesave Plan;
1,011,970 shares that were issued in connection with the fourth quarter 2021 purchase period under the Comcast Corporation
2002 Employee Stock Purchase Plan and 12,912,446 shares available for issuance under the Comcast Corporation 2002 Employee
Stock Purchase Plan; and 280,276 shares that were issued in connection with the fourth quarter 2021 purchase period under
the Comcast-NBCUniversal 2011 Employee Stock Purchase Plan and 9,682,712 shares available for issuance under the Comcast-NBCUniversal
2011 Employee Stock Purchase Plan. |
56
Table of Contents
CEO Pay Ratio
We are required under
SEC rules to provide a pay ratio comparing Mr. Roberts’ 2021 compensation to our median employee’s 2021 compensation (excluding
Mr. Roberts). To identify the median employee, we engaged an unaffiliated third-party advisory services firm to conduct a statistical
sampling of approximately 192,392 full-time, part-time, seasonal and temporary employees as of December 31, 2021 (which included approximately
61,189 non-U.S. employees) based on comparisons of base wages.
All of our part-time,
seasonal and temporary employees as of December 31, 2021, including in our theme park and entertainment production businesses, were required
to be taken into account for purposes of identifying our median employee under SEC rules. SEC rules do not permit us to annualize the
compensation paid to these workers as if they were full-time employees, which has the effect of reducing the level of our median employee’s
total compensation relative to what it would have been had the rules permitted us to annualize compensation across our entire workforce
or to use only full-time U.S. employees. As a result, the impact of this rule may be different for us than some companies in our peer
groups given the composition of our workforce across our uniquely diversified company, and year-over-year comparisons may not be meaningful.
We believe putting into context how our median employee was identified highlights why that employee’s compensation and the resulting
pay ratio, and year-over-year changes thereto, should not be compared on an “apples-to-apples” basis.
We have estimated
that our pay ratio for 2021 is 405 to 1, calculated by dividing Mr. Roberts’ 2021 total compensation set forth in the Summary Compensation
Table, adjusted as described below ($33,993,040), by $83,840, which represents the annual total compensation of our median employee.
Our median employee’s annual total compensation was determined using the same methodology we used to determine the annual total
compensation of our NEOs, which, along with Mr. Roberts’ compensation, was then adjusted to include the cost to the Company of
specified employee benefits provided on a non-discriminatory basis, including group health and welfare benefits and the value of courtesy
cable services.
As permitted under
SEC rules, we adjusted our total employee population for purposes of identifying our median employee by excluding approximately 1.6%
of our employee population as follows (all amounts are approximate): 160 in Brazil; 80 in Canada; 1700 in India; 920 in Ireland; 205
in Mexico; and 60 in Russia.
2022
Proxy Statement 57
Table of Contents
Audit Committee
Matters
Proposal
3: RATIFICATION OF APPOINTMENT OF INDEPENDENT AUDITORS
|
 |
Our Board unanimously
recommends that shareholders vote “FOR” ratification of the appointment of Deloitte &
Touche LLP as our independent auditors. |
Selection of Independent
Registered Public Accounting Firm
The Audit Committee
is directly responsible for the appointment, compensation, retention and oversight of our independent auditors, Deloitte & Touche
LLP (“Deloitte”). Deloitte, together with its predecessors, has served as our independent auditors since 1963. The lead engagement
partner from Deloitte is required to be rotated every five years. The process for selection of a new lead engagement partner includes
a meeting between the Chair of the Audit Committee and the candidate for this role, as well as discussion by the full Audit Committee
and meetings with senior management.
Each year, the Audit
Committee, along with our management and internal auditors, reviews Deloitte’s performance as part of the Audit Committee’s
consideration of whether to reappoint the firm as our independent auditors. As part of this review, the Audit Committee considers (i)
the continued independence of Deloitte, (ii) its quality of service provided on prior audits, (iii) evaluations of Deloitte by our management
and internal auditors, (iv) Deloitte’s effectiveness of communications and working relationships with the Audit Committee and our
management and internal auditors, (v) the length of time Deloitte has served as our independent auditors and (vi) the quality and depth
of Deloitte and the audit team’s expertise and experience in our industries in light of the breadth, complexity and global reach
of our businesses.
Following the Audit
Committee’s review of Deloitte’s performance, the Audit Committee appointed Deloitte to serve as our independent auditors
for the year ending December 31, 2022. The Audit Committee and our Board recommend that you ratify this appointment, although your ratification
is not required. A partner of Deloitte will be present at the annual meeting and will be available to respond to appropriate questions.
Fees of Independent
Registered Public Accounting Firm
Set forth below are
the fees paid or accrued for the services of Deloitte, the member firms of Deloitte Touche Tohmatsu and their respective affiliates in
2021 and 2020.
| |
2021 |
|
2020 |
| |
($ IN MILLIONS) |
| Audit
fees |
25.1 |
|
21.5 |
| Audit-related
fees |
1.1 |
|
1.2 |
| Tax
fees |
1.1 |
|
1.6 |
| All
other fees |
— |
|
— |
| Total |
27.4 |
|
24.3 |
Audit fees consisted
of fees paid or accrued for services rendered to us and our subsidiaries for the audits of our annual financial statements, audits of
our internal control over financial reporting (as required by Section 404 of the Sarbanes-Oxley Act of 2002), reviews of our quarterly
financial statements and audit services provided in connection with other statutory, regulatory or contractual requirements.
Audit-related fees
consisted of fees paid or accrued for financial due diligence services and attestation services related to contractual and regulatory
compliance.
58
Table of Contents
Tax fees consisted
of fees paid or accrued for domestic and foreign tax compliance services, including review of tax returns and tax examination assistance.
There were no fees paid or accrued in 2021 and 2020 for tax planning.
Other fees included
fees paid or accrued for subscription services.
Preapproval Policy
of Audit Committee of Services Performed by Independent Auditors
The Audit Committee’s
policy requires that the Committee preapprove all audit and non-audit services performed by the independent auditors to assure that the
services do not impair the auditors’ independence. Unless a type of service has received general preapproval, it requires separate
preapproval by the Audit Committee. Even if a service has received general preapproval, if the fee associated with the service exceeds
$1 million in a single engagement or series of related engagements, it requires separate preapproval. The Audit Committee has delegated
its preapproval authority to its Chair.
Report
of the Audit Committee
The Audit Committee
(as used in this section, “we” or “our”) is composed solely of independent directors meeting the requirements
of the applicable rules of the SEC and The Nasdaq Stock Market LLC. Each member also is financially literate for audit committee purposes
under the Nasdaq rules, and the Board has concluded that Jeffrey A. Honickman and Maritza G. Montiel qualify as audit committee financial
experts. The key responsibilities of our committee are set forth in our charter, which was adopted by us and approved by the Board and
is posted under “Corporate Governance” in the Investors section of Comcast’s website at www.cmcsa.com.
We serve in an oversight
capacity and are not intended to be part of Comcast’s operational or managerial decision-making process. Comcast’s management
is responsible for the preparation, integrity and fair presentation of information in Comcast’s consolidated financial statements,
the financial reporting process and internal control over financial reporting. Deloitte, Comcast’s independent auditors, is responsible
for auditing Comcast’s consolidated financial statements and internal control over financial reporting. Our principal purpose is
to monitor these processes.
In this context, at
each regularly scheduled in-person meeting, we met and held discussions with management, Comcast’s internal auditors and the independent
auditors. Management represented to us that Comcast’s consolidated financial statements were prepared in accordance with generally
accepted accounting principles applied on a consistent basis.
Prior to their issuance,
we reviewed and discussed the quarterly and annual earnings press releases, consolidated financial statements and disclosures under “Management’s
Discussion and Analysis of Financial Condition and Results of Operations” (including the presentation of non-GAAP financial information
and critical accounting judgments and estimates) with management, Comcast’s internal auditors and the independent auditors. We
also reviewed Comcast’s policies and practices with respect to financial risk assessment, as well as its processes and practices
with respect to enterprise risk assessment and management. We discussed with the independent auditors critical audit matters identified
during the course of the audit and other matters required to be discussed by applicable Public Company Accounting Oversight Board (“PCAOB”)
and SEC rules.
We discussed with
the independent auditors the overall scope and plans for their audit and approved the terms of their engagement letter. We also reviewed
Comcast’s internal audit plan. We met with the independent auditors and with Comcast’s internal auditors, in each case with
and without other members of management present, to discuss the results of their respective examinations, the evaluations of Comcast’s
internal controls and the overall quality and integrity of Comcast’s financial reporting. Among other things, in our discussions
with the independent auditors, we sought their perspectives on the appropriateness of the accounting principles selected by management
and their assessment of risk in financial reporting.
Additionally, we reviewed
the performance, responsibilities, budget and staffing of Comcast’s internal auditors. We also have established, and oversaw compliance
with, procedures for Comcast’s receipt, retention and treatment of complaints regarding accounting, internal accounting controls
or auditing matters and its employees’ confidential and anonymous submissions of concerns regarding questionable accounting or
auditing matters.
2022
Proxy Statement 59
Table of Contents
We discussed with
the independent auditors the auditors’ independence from Comcast and its management, including the matters required to be discussed
by the applicable requirements of the PCAOB and SEC. We also reviewed Comcast’s hiring policies and practices with respect to current
and former employees of the independent auditors. We preapproved, in accordance with our preapproval policy described above, all services
provided by the independent auditors and considered whether their provision of such services to Comcast is compatible with maintaining
the auditors’ independence.
Based on the reviews
and discussions referred to above, we recommended to the Board, and the Board approved, that the audited consolidated financial statements
be included in Comcast’s Annual Report on Form 10-K for the year ended December 31, 2021, filed with the SEC.
In addition, as in
prior years, we, along with Comcast’s management and internal auditors, reviewed Deloitte’s performance as part of our consideration
of whether to appoint the firm as independent auditors for 2022 and recommend that shareholders ratify this appointment. As part of this
review, we considered the continued independence of Deloitte, the quality of service provided on prior audits, the results of an evaluation
of Deloitte by Comcast’s management and internal auditors and Deloitte’s effectiveness of communications and working relationships
with us, management and the internal auditors. We also considered the period of time that Deloitte has served as Comcast’s independent
auditors and evaluated the quality and depth of the firm and the audit team’s expertise and experience in our industries in light
of the breadth, complexity and global reach of Comcast’s businesses. Following this review, we have appointed Deloitte as Comcast’s
independent auditors for 2022 and are recommending that Comcast’s shareholders ratify this appointment.
Members
of the Audit Committee
Jeffrey A. Honickman
(Chair)
Naomi M. Bergman
Maritza G. Montiel
Asuka Nakahara
60
Table of Contents
Shareholder Proposals
We received the following
shareholder proposals. To be voted upon at our 2022 annual meeting of shareholders, the proponent of each proposal, or a representative
of the proponent qualified under Pennsylvania law, must be present at the meeting to present the proposal. We provide the name and address
of each proponent, including any co-filer(s), below. We will promptly supply the number of shares of our Class A common stock or, if
not available, the market value of our Class A common stock held by any proponent (including any co-filer(s)), upon oral or written request
to the Secretary.
Other than adding
a brief title, we have included the text of each proposal and the shareholder’s supporting statement. Following each proposal,
we explain why our Board recommends a vote AGAINST it.
Proposal
4: SHAREHOLDER PROPOSAL TO REPORT ON CHARITABLE DONATIONS
|
 |
Our Board unanimously recommends that shareholders vote “AGAINST” this shareholder proposal. |
The following proposal
and supporting statement were submitted by National Legal and Policy Center, 107 Park Washington Court, Falls Church, VA 22046.
Supporting
Statement
Request for Charitable
Donation Disclosure
RESOLVED: The shareholders
request that Comcast Corporation (“Company”) provide a report, published on the company’s website and updated semi-annually
– and omitting proprietary information and at reasonable cost – that discloses, itemizes and quantifies all Company charitable
donations, aggregated by recipient name & address each year for contributions that exceed $999 annually.
This report shall
include:
| |
1. |
Monetary and non-monetary contributions
made to non-profit organizations operating under Section 501(c)(3) and 501(c)(4) of the Internal Revenue Code, and any other public
or private charitable organization; |
| |
|
|
| |
2. |
Policies and procedures for charitable contributions
(both direct and indirect) made with corporate assets; |
| |
|
|
| |
3. |
Rationale for each of the charitable contributions. |
SUPPORTING STATEMENT:
Comcast Corporation’s assets belong to its shareholders. The expenditure or distribution of corporate assets, including charitable
contributions, should be consistent with shareholder interests. Accordingly, the Company’s policies and procedures for charitable
contributions should be disclosed to shareholders.
Company executives
exercise wide discretion over the use of corporate assets for charitable purposes. Absent a system of transparency and accountability
for charitable contributions, Company executives may use Company assets for objectives that are not shared by and may be inimical to
the interests of the Company and its shareholders.
Current disclosure
is insufficient to allow the Company’s Board, its shareholders, and its current and prospective customers to fully evaluate the
charitable use of corporate assets.
There is currently
no single source providing shareholders the information sought by this resolution.
Company
Response to Shareholder Proposal
Comcast strives to
positively affect the communities where our employees, customers and audiences live and work through charitable giving, reporting on
this community impact giving annually. As we have outlined in our 2021 Impact Report, as a company uniquely positioned to inform, entertain
and empower, we seek to bring together diverse communities and inspire our employees, customers and audiences to make a positive social
impact.
2022
Proxy Statement 61
Table of Contents
For example, as set
forth in our 2021 Impact Report(1):
| |
● |
In 2020, we invested $496 million
in the communities where we operate through cash and in-kind donations, including donations of $31 million to organizations led by
and serving people of color and $5 million to organizations led by and serving women. |
| |
|
|
| |
● |
Comcast also empowers employees to give back to their
communities by matching their contributions to eligible, tax-exempt charitable organizations dollar-for-dollar up to $1,000 annually.
In 2020, 6,400 employees participated in the matching gift program, generating over $5 million donated to approximately 5,600 non-profit
organizations recommended by employees. |
On top of our existing
community impact giving efforts, in 2020, we announced an incremental multi-year $100 million commitment to help advance social justice
and equality. We provided an update in 2021 on our progress toward this initiative(2), which we are well on track to fulfill
by the end of 2022.
In addition, the Comcast
NBCUniversal Foundation is committed to supporting the interests and needs of our diverse communities, and invests in programs that serve
diverse individuals seeking equitable access to the advantages of technology and digital skills that lead to improved economic mobility.
Like all private foundations, the Comcast NBCUniversal Foundation is required to annually file IRS Form 990-PF, which provides information
on its mission, programs and finances, as well as a list of the names of each recipient of its grants and contributions, fundraising
or investments, the purpose of such grants and contributions, and the dollar amount received by each recipient.
In sum, we believe
that our charitable donations benefit the communities where we operate, which in turn benefits our company and our shareholders. We report
on these efforts with sufficient detail to provide shareholders with enough information to evaluate our programs and approach to giving.
The effort to create a report – twice a year – for every contribution that is $999 or more would require us to incur unnecessary
expenses to produce a report that provides no material incremental benefit to shareholders.
For the reasons
set forth above, our Board unanimously recommends AGAINST this proposal.
| (1) |
Available at: https://corporate.comcast.com/impact/report/2021. |
| |
|
| (2) |
Available at: https://update.comcast.com/wp-content/uploads/sites/33/dlm_uploads/2021/05/Update-on-our-commitment-compressed.pdf. |
62
Table of Contents
Proposal
5: SHAREHOLDER PROPOSAL TO PERFORM INDEPENDENT RACIAL EQUITY AUDIT
|
 |
Our Board unanimously
recommends that shareholders vote “AGAINST” this shareholder proposal. |
The following proposal
and supporting statement were submitted by the SEIU Master Trust, 1800 Massachusetts Ave NW, Suite 301, Washington, D.C. 20036.
Supporting
Statement
RESOLVED that shareholders
of Comcast Corporation (“Comcast”) urge the Board of Directors to oversee an independent racial equity audit analyzing Comcast’s
adverse impacts on nonwhite stakeholders and communities of color. Input from civil rights organizations, employees, and customers should
be considered in determining the specific matters to be analyzed.
A report on the audit,
prepared at reasonable cost and omitting confidential or proprietary information, should be publicly disclosed on Comcast’s website.
SUPPORTING STATEMENT
High-profile police
killings of Black people have galvanized the movement for racial justice. That movement, together with the disproportionate impacts of
the COVID-19 pandemic, have focused the attention of the media, the public and policy makers on systemic racism, racialized violence
and inequities in employment, health care, and the criminal justice system.
In 2020, Comcast announced
plans to allocate $100 million in cash and advertising to advance programs aimed at inequality against “any race, ethnicity, gender
identity, sexual orientation or ability.”(1) Comcast also announced “diversity, equity and inclusion workforce
initiatives.”(2)
These steps are laudable, but we believe that a racial equity audit remains necessary to help identify,
prioritize, remedy, and avoid adverse impacts on nonwhite stakeholders and communities of color.
According to its EEO-1
data, only 6% of Comcast executives/senior officers are Black, compared to 18.6% of the remaining workforce.(3)
In October
2020, Comcast entered into a conciliation agreement with the U.S. Labor Department to resolve allegations of pay discrimination against
Black and Latino employees after a routine audit found discrimination against Black employees in the engineer and program project management
functions and Hispanic employees in the marketing and strategic planning development functions. Comcast denied the allegations, but agreed
to back pay and interest plus salary adjustments.(4)
In 2020, Comcast settled a lawsuit with television producer Byron Allen,
who alleged that Comcast refused to offer his TV channels in its cable bundles because he’s Black. The settlement gained Allen
various benefits, including carriage for three of his channels in Comcast’s Xfinity packages.(5)
During the 2020 election
cycle, Comcast gave $755,000 to members of Congress who voted to overturn the results of the presidential election,(6) an
action some viewed as an “attack on the voting rights of people of color.”(7) Although Comcast paused such donations,
PACs affiliated with trade associations of which it is a member have continued to donate.(8)
A 2021 study revealed that from
2015 through 2020 Comcast was a leading corporate donor to state lawmakers who support legislation that can discriminate against minorities
by making it more difficult to vote.(9)
We urge Comcast to assess its behavior through a racial equity lens in order to obtain
a complete picture of how it contributes to, and could help dismantle, systemic racism.
| (1) |
https://variety.com/2020/biz/news/comcast-100-million-injustice-inequality-1234627621/ |
| (2) |
https://www.cmcsa.com/static-files/c49ca903-422b-49a9-8d42-91241478c06e |
| (3) |
https://cmcsa.gcs-web.com/static-files/1d6d3ef6-d2d4-4c13-b452-7917b90e0032 |
| (4) |
“U.S Department of Labor and Comcast Corp. Reach
Agreement to Resolve Alleged Pay Discrimination,” DOL, 10/14/20 |
| (5) |
Meg James, “Byron Allen, Comcast settled long-running
battle over alleged racism,” LA Times, June 11, 2020. |
| (6) |
https://edition.cnn.com/interactive/2021/01/business/corporate-pac-suspensions/ |
| (7) |
https://www.nytimes.com/2021/01/15/us/politics/lankford-apology-election-biden.html |
| (8) |
https://update.comcast.com/wp-content/uploads/sites/33/dlm_uploads/2021/06/Trade-Associations-and-Other-501c6-and-501c4-Organization-Disclosure.pdf;
see also, https://www.fec.gov/data/committee/C00082040/?tab=spending |
| (9) |
https://www.citizen.org/article/corporate-sponsors-of-voter-suppression-state-lawmakers-50-million/;
https://www.washingtonpost.com/ politics/2021/07/22/voting-georgia-donations/ |
2022
Proxy Statement 63
Table of Contents
Company
Response to Shareholder Proposal
Comcast has a long-standing
commitment to diversity, equity and inclusion (“DE&I”), including racial equity. Since our founding in 1963, our core
values have been rooted in improving the communities where our employees, customers and audiences live and work. Today, those values,
including upholding our commitment to DE&I within both our workforce and the communities we serve, are embedded in our culture and
governance.
Although we share
the proponent’s intent to advance racial equity, our Board recommends AGAINST this proposal because we feel it does not
take into account, and would divert management’s attention and significant resources away from, the extensive efforts and investments
we are already making in DE&I and racial equity.
As we discuss in more
detail below:
| |
● |
Our ongoing commitments to DE&I
already reflect – and will continue to reflect – recommendations from our external DE&I Advisory Council, as well
as other third-party advisors, partners and employees, on ways to further improve and prioritize our efforts. Because we take
this work so seriously, our management team is supported by a 14-member external DE&I Advisory Council of business, academic,
political and civil rights leaders from Black and African American, Latino, Asian American and Pacific Islander, Indigenous People
and Native American, People with Disabilities and LGBTQ+ communities. Among its members are leaders of the National Urban League,
UnidosUS, National Action Network, Asian Americans Advancing Justice and GLAAD, to name a few. The DE&I Advisory Council helps
us prioritize and identify opportunities in critical DE&I focus areas – both in connection with our workforce and our external
impacts – and facilitates open communication on our development, monitoring and evaluation of these focus areas – most
of which are reported in our 2021 Impact Report. |
| |
|
|
| |
● |
We are actively using our resources – our people,
programming and platforms – to shed light on systemic racial equity issues and work toward solutions in areas where we can
have a meaningful and measurable impact. Our DE&I efforts span a wide range of racial equity-related initiatives and impacts,
including the diversity of our workforce, our efforts to address the digital divide, our focus on creating and distributing content
to amplify diverse voices, and the support of diverse suppliers and the communities where we do business. |
| |
|
|
| |
● |
Our Board is dedicated to overseeing and supporting
management’s efforts to advance our DE&I priorities, including racial equity. Our full Board, with specific support
primarily from our Governance and Corporate Responsibility Committee, has oversight of our DE&I strategy and programs. Our governance
structure is further strengthened by the leadership of our Chief Diversity Officer, who reports to our Chairman and CEO and sits
outside of our human resources department to focus her efforts on our critical DE&I focus areas relating to both our workforce
and our external impacts. Our Chief Diversity Officer is further supported and informed by the external DE&I Advisory Council,
third-party consultants and input from our employees obtained from a variety of sources, including our nine employee resource groups
(“ERGs”) for Asian Pacific American, Black, People with Disabilities, LGBTQ+, Hispanic/Latino, Veteran, Young Professional,
Women and Indigenous employees, internal DE&I councils throughout our company and employee engagement surveys. |
| |
|
|
| |
● |
We are committed to transparency, and our increasingly
granular public reporting provides stakeholders with disclosure necessary to monitor and track our progress. We have provided
public reporting on our DE&I efforts and progress for over ten years. We are committed to the continued evolution of this reporting,
including through additional disclosure aligned with the Sustainability Accounting Standards Board standards and public disclosure
of our EEO-1 reports. |
We strongly believe
that the independent audit called for in this proposal is overly prescriptive in its scope and would not be meaningfully additive to
our existing processes or disclosure. At the same time, we believe that the lack of details and any real consensus as to what specifically
the ‘audit’ would seek to review, evaluate or accomplish for this purpose could significantly distract our company from executing
toward our core DE&I and racial equity efforts. As a result, we believe shareholders would be better served with our resources being
used to further deepen our extensive DE&I and racial equity efforts (outlined in more detail below), rather than diverting management
attention and significant resources to an external audit.
We are proud of the
progress we have made and the transparency we provide, and we believe that our processes and actions fully respond to the spirit of the
proposal. As a result, our Board believes that the proponent’s requested independent audit is not in the best interests of our
shareholders and recommends that shareholders vote AGAINST this proposal.
*********
64
Table of Contents
Our ongoing
commitments to DE&I already reflect – and will continue to reflect – recommendations from our external DE&I Advisory
Committee, as well as other external third-party advisors, partners and our employees, on ways to further improve and prioritize our
efforts.
Realizing that outside
perspectives are needed to further strengthen and deepen our DE&I programs, we believe we have a unique governance structure in that
we are guided by an external DE&I Advisory Council that provides advice regarding our core DE&I initiatives to help ensure accountability
and drive progress across matters relating to both our workforce and our external impacts.
| ● |
The external DE&I Advisory Council
includes 14 external business, academic, political and civil rights leaders from Black and African American, Latino, Asian American
and Pacific Islander, Indigenous People and Native American, People with Disabilities and LGBTQ+ communities. Among its members are
leaders of the National Urban League, UnidosUS, National Action Network, Asian Americans Advancing Justice and GLAAD, to name a few. |
| |
|
| ● |
Our inaugural external DE&I Advisory Council helped
us identify the following five critical DE&I focus areas: workforce, programming/content, supplier diversity, governance and
community impact giving. Progress within each of these focus areas is publicly reported in our 2021 Impact Report(1). |
| |
|
| ● |
The DE&I Advisory Council also receives confidential
reports and briefings on our progress toward these DE&I focus areas so it can better facilitate open communication on their development,
monitoring and evaluation. |
| |
|
| ● |
The DE&I Advisory Council operates as a formal body
with a set of governing policies and procedures. Our Chief Diversity Officer and management present to Council members on a quarterly
basis on various topics across our businesses. Council members serve a two-year term, and no member may serve for more than three
successive terms. In identifying Council members, we seek to maintain an intersectional council with a diversity of strengths, backgrounds,
perspectives and communities represented. |
| |
|
| ● |
For more information on the DE&I Advisory Council,
see our Statement Regarding our Diversity, Equity and Inclusion Initiatives.(2) |
In addition:
| ● |
We routinely partner with third parties,
such as leading DE&I consultants as well as schools and community-based organizations, to help identify causes of inequity, particularly
relating to the digital divide. |
| |
|
| ● |
Our extensive network of ERGs, as well as input from
third-party advisors and results of employee engagement surveys, helps us identify and prioritize certain workplace and culture-related
initiatives and impacts. |
We are actively
using our resources – our people, programming and platforms – to shed light on systemic racial equity issues and work toward
solutions in areas where we can have a meaningful and measurable impact.
Our DE&I efforts
focus on areas where we believe we can make the most impact given the nature of our business. Our most recent 2021 Impact Report highlights
some of the ways that we are working to build, and rebuild, stronger and more inclusive communities to make a positive difference and
how we try to do what’s right for our employees, customers, viewers and the world. These focus areas include:
Workforce
We believe that a
diverse, equitable and inclusive company helps to foster creativity, innovation and success. We embrace diversity of background, perspective,
culture and experience throughout our business. For example:
| ● |
Since our first public report over
ten years ago, we have made progress in representation of people of color in management. As of the end of 2021, people of color represented
29.4% of our director-level employees and 23.8% of our vice president-level and above employees, compared to 19.1% and 15.6%, respectively,
at the end of 2010. |
| |
|
| ● |
We offer a variety of training programs and initiatives
focused on creating a more inclusive workplace culture. These efforts include company-wide forums like our DE&I speaker series
which is designed to educate, inspire dialogue and foster employee engagement through a curated experience anchored by external scholars,
authors and thought leaders focusing on a variety of DE&I topics. |
| |
|
| ● |
We support nine ERGs with 35,000 members in over 200
chapters. |
| |
|
| ● |
We have engaged third-party consultants to review and
evaluate workforce-related programs and recommend opportunities for improvement. |
| (1) |
Available at https://corporate.comcast.com/impact/report/2021. |
| |
|
| (2) |
Available at https://www.cmcsa.com/static-files/c49ca903-422b-49a9-8d42-91241478c06e. |
2022
Proxy Statement 65
Table of Contents
Digital Equity
Comcast has long been
at the forefront of addressing digital inequities, including through Internet Essentials, which we believe is the nation’s largest
and most comprehensive internet adoption program for low-income families. Over the past decade, we have continued to innovate and expand
the eligibility requirements for this program, connecting a cumulative total of over 10 million low-income Americans to the internet.
| ● |
When we launched Internet Essentials
in 2011, it was available only to families of school-aged children eligible to participate in the National School Lunch Program.
Over the past decade, we have continued to expand the reach of this program to cover even more individuals, with eligibility today
including households that receive public housing assistance, Medicaid, Supplemental Nutrition Assistance benefits (SNAP), Social
Security Income (SSI), Federal Pell Grants and various other benefit programs. |
| |
|
| ● |
While the cost of Internet Essentials has remained flat
at $9.95 a month since 2011, we have consistently increased its speeds, which now has a 50 Mbps download speed. With our participation
in the federal government’s broadband benefits programs that enable qualifying low-income customers to apply a financial subsidy
to our broadband services, customers can receive our Internet Essentials service or our new enhanced Internet Essentials Plus service
with twice the download speed – up to 100 Mbps – effectively for free. |
| |
|
| ● |
To respond to the challenges presented by the global
pandemic, among other things, we provided new Internet Essentials customers with 60 days of free service, made our 1.5 million public
Wi-Fi hotspots available for free, waived bad-debt program eligibility and created affordable and flexible payment plans to allow
customers and small businesses to retain their services. |
Over the past two
years, we have launched our new Internet Essentials Partnership Program, which focuses on enabling cities, school districts and community-based
organizations to connect large numbers of students to broadband access at home. To date, we have collaborated with hundreds of schools
and organizations across the country. We also have helped bridge the digital divide through digital skills training initiatives to unlock
opportunities and new career pathways in media and technology – both through our own training programs and through partnerships
with leading organizations that provide support and resources necessary for success, such as Per Scholas and Genesys Works.
As part of our ongoing
commitment to help connect low-income families to the internet, in 2020 we launched our “Lift Zones” effort to create more
than 1,000 WiFi-connected Lift Zones in community centers nationwide. Lift Zones are designed to complement our Internet Essentials program
and help students participate in remote learning who, for a variety of reasons (including homelessness or housing insecurity issues),
are otherwise unable to participate in educational opportunities and the digital economy.
We realize that more
work still needs to be done to expand our digital equity initiatives and that we alone cannot solve the problem. That is why we enlisted
the support of a leading consultancy to help evaluate the barriers to broadband adoption and how we and others can work together to bridge
the digital divide. We have actively sponsored and participated in the federal government’s broadband benefits programs to provide
discounted internet service to those in need, namely the Emergency Broadband Benefit program that launched in May 2021 to immediately
enable qualifying low-income customers to apply a financial subsidy to any tier of our broadband services, including Internet Essentials,
and its successor, the longer-term Affordable Connectivity Program that launched at the end of 2021. We also participate in federal,
state and local programs designed to fund the expansion of broadband to unserved Americans and extend our world class network to new
areas where reliable, high-speed internet services had previously been unavailable.
We are serious about
closing the digital divide and working with the cable industry, schools, governments, nonprofits, businesses and communities to remedy
the many issues that act as barriers to broadband access in the home.
Programming
We strive to have
diverse perspectives that resonate with a wide range of audiences in our programming at NBCUniversal and in the content we distribute
on our Xfinity platforms.
We have created opportunities
in front of and behind the camera, including by offering a wide range of programs designed to build a diverse pipeline of talent, including
directors, writers, actors, music composers and journalists. We regularly report on the percentage of people of color represented on
air and behind the camera. For example, in 2021, people of color represented 36.4% of film talent on screen and 47.6% of on-air talent
at our news assets, as well as 17.2% of film talent behind the camera and 35.1% of talent behind the camera at our news assets.
66
Table of Contents
We have developed
programs that seek to build additional opportunities for diverse talent, including the following examples:
| ● |
NBCUniversal launched an innovative,
multiplatform journalism training and development program for students at Historically Black Colleges and Universities and diverse-serving
institutions, as well as a multi-year $3.5 million scholarship fund for underrepresented students. |
| |
|
| ● |
NBCUniversal created a fellowship program awarding diverse
documentary filmmakers grants to support feature-length nonfiction films highlighting social issues and identities, with seven groundbreaking
filmmakers named in 2021 for the first inaugural fellowship. |
| |
|
| Through our media platforms, we have worked
to amplify diverse voices and cultures. For example: |
| |
| ● |
Our Cable Communications division has created a vast
ecosystem of diverse content on Xfinity, including curated On Demand destinations. Among the content included is the “Black
Experience,” which gives viewers access to Black entertainment programming with collections of stories that showcase the breadth
of Black culture, endorsed by the African American Film Critics Association, and the “¡Mi gente, presente!” curated
collection of bilingual and bicultural content to celebrate Hispanic Heritage month. |
| |
|
| ● |
NBCUniversal’s ‘The More You Know’
series of public service announcements have kept audiences informed and educated on issues that include a campaign to speak out against
systemic racism and speaking up for social justice, equality and equity. |
| |
|
| ● |
NBCUniversal’s ‘Plan Your Vote’ campaign
provided much needed voting information for the 2020 elections, including comprehensive resources for voter planning though an interactive,
state-by-state guide — which also was translated into Spanish and amplified by our Telemundo network. |
| |
|
| ● |
NBC News programs aired ‘The Racism Virus’,
a streaming special on the stark rise in anti-Asian discrimination and hate attacks occurring nationwide and how the Asian community
is coping, the psychological and economic toll of discrimination and how to bring a sense of belonging and unity again. |
Supplier Diversity
and Small Business Support
We have long maintained
a supplier diversity program designed to promote, increase and improve the participation of diverse businesses within our corporate supply
chain. We have been a member of the Billion Dollar Roundtable, a top-level corporate advocacy organization that promotes supply chain
diversity, since 2015. We were the first media and technology company to be inducted for attaining $1 billion or more in annual Tier
I (direct supplier) supply chain diversity spend, and have spent at least $3 billion each year with diverse suppliers during the past
5 years. In 2021, we spent over $4.3 billion with diverse Tier 1 vendors (with direct purchases from approximately 3,250 diverse suppliers)
and over $390 million with diverse Tier 2 subcontractors. Since 2011, we have spent over $30 billion with diverse suppliers.
Over the past two
years, we have separately expanded our efforts to support small business diversity:
| ● |
Our Comcast RISE program, which was
launched in 2020 in connection with our $100 million social justice initiative, has helped over 6,700 small businesses owned by people
of color in 590 cities across 34 states through grants, marketing and technology resources. |
| |
|
| ● |
We invested $25 million in the Seibert Williams Shank
Clear Vision Impact Fund, a diverse-led and diverse-serving financial institution that provides direct support to local community
businesses. |
| |
|
| ● |
We invested $10 million in the Inclusiv Racial Equity
and Resilience Investment Fund, which is aimed at building equity in credit unions led by and/or serving people of color in an effort
to help increase lending to people of color-owned businesses, homeowners and consumers by providing financial opportunities to traditionally
underserved and underbanked communities. |
Our Board is
dedicated to overseeing and supporting management’s efforts to advance our DE&I priorities, including racial equity.
Our commitment to
DE&I starts at the top, with our Board. As a whole and through its committees, our Board oversees and assesses our priority areas,
efforts and progress on DE&I matters.
Our Governance and
Corporate Responsibility Committee, pursuant to its charter, reviews and assesses significant social issues, risks and trends, including
with respect to DE&I matters affecting our workforce and our external impacts. In 2021, for example, this Committee reviewed:
2022
Proxy Statement 67
Table of Contents
| ● |
Our workforce-related DE&I efforts,
including hiring, promotion and retention statistics broken down by detailed demographic categories. |
| |
|
| ● |
Opportunities identified by an outside consultant, which
had reviewed extensive workforce data and conducted employee interviews and focus groups, to further progress our DE&I efforts
relating to Comcast Cable’s workforce, our largest workforce. |
| |
|
| ● |
Information about the diverse programming we create and
distribute, and our annual spend with diverse suppliers. |
| |
|
| ● |
Our progress toward the incremental $100 million pledge
we made in 2020 to advance social justice and equality, with a focus on communities of color, which we are well on track to fulfill
by the end of 2022. |
Our Compensation and
Human Capital Committee, pursuant to its charter, reviews our programs and strategies related to human capital management, including
with respect to employee engagement. In 2021, for example, it reviewed the results of our employee engagement survey, which showed that
across our company, employees viewed our DE&I-related workforce efforts very favorably, with upward trends compared to prior years
in nearly all instances.
In addition, our Board
and senior management team are committed to, and management is incentivized through our executive compensation program to create, a strong
workplace culture with values of integrity and respect and to foster our company’s DE&I and digital equity efforts.
Our Chief Diversity
Officer leads our DE&I efforts across our company, developing and executing our DE&I corporate strategy, and reports on these
matters at least twice a year to our Board or its committees. Our Chief Diversity Officer reports to our Chairman and CEO and sits outside
of our human resources department to focus her efforts on our critical DE&I focus areas relating to both our workforce and our external
impacts.
We are committed
to transparency, and our increasingly granular public reporting provides stakeholders with disclosure necessary to monitor and track
our progress.
We have published
annual reports tracking our DE&I initiatives and progress for over a decade. We also disclose information on these matters on our
ESG Reporting website at https://www.cmcsa.com/esg-reporting, as well as in the “Impact”
section of our website at www.comcastcorporation.com.
This disclosure includes:
| ● |
Our 2021 Impact Report, which provides
information on our critical DE&I focus areas, including our digital equity efforts. It includes statistics on total workforce
and new hire data, in each case broken down by gender and specific people of color categories (Asian American, Black, Indigenous,
Latino and two or more races) and by specific leadership levels (executive leadership team, vice presidents and above, directors
and managers), as well as data on our programming content, supplier diversity and community impact activities. |
| |
|
| ● |
An update in 2021 on progress toward our $100 million
commitment to advance social justice and equality. |
| |
|
| ● |
Our consolidated EEO-1 report for 2020, which presents
another view of our workforce diversity data in a standardized framework. |
| |
|
| ● |
Our 2021 Internet Essential Progress Report, which provides
information on our long-standing commitment to and progress on our digital equity efforts. |
| |
|
| ● |
Our Statement Regarding our Diversity, Equity and Inclusion
Initiatives, which further describes how our DE&I efforts are discussed and assessed by our Board and its committees and the
external DE&I Advisory Council. |
*********
For the reasons
set forth above, our Board unanimously recommends AGAINST this proposal.
68
Table of Contents
Proposal 6: SHAREHOLDER PROPOSAL TO REPORT ON RISKS OF OMITTING “VIEWPOINT” AND “IDEOLOGY” FROM EEO POLICY
|
|
Our Board unanimously
recommends that shareholders vote “AGAINST” this shareholder proposal. |
The following proposal and supporting statement
were submitted by the National Center for Public Policy Research, 20 F Street NW, Suite 700, Washington, D.C. 20001.
Supporting Statement
EEO POLICY RISK REPORT
RESOLVED Shareholders request that Comcast Corporation (“Comcast”)
issue a public report detailing the potential risks associated with omitting “viewpoint” and “ideology”
from its written equal employment opportunity (EEO) policy. The report should be available within a reasonable timeframe, prepared
at a reasonable expense and omit proprietary information.
SUPPORTING STATEMENT
Comcast does not explicitly prohibit discrimination
based on viewpoint or ideology in its written EEO policy.
Comcast’s lack of a company-wide best practice
EEO policy sends mixed signals to company employees and prospective employees and calls into question the extent to which individuals
are protected due to inconsistent state policies and the absence of federal protection for partisan activities. Approximately
half of Americans live and work in a jurisdiction with no legal protections if their employer takes action against them for their
political activities or discriminates on the basis of viewpoint in the workplace.
Companies with inclusive policies are better able
to recruit the most talented employees from a broad labor pool, resolve complaints internally to avoid costly litigation or reputational
damage, and minimize employee turnover. Moreover, inclusive policies contribute to more efficient human capital management by
eliminating the need to maintain different policies in different locations.
There is ample evidence that individuals with conservative
viewpoints may face discrimination at Comcast.
Comcast’s most outward-facing properties are
the NBC network, including its news channels and sites. These are substantially biased against center/right thought in ways that
both suggest that the bias stretches backward through the Company and also in ways that cause it to offend potential customers,(1)
fall away from best practices in the industry,(2) endanger employees,(3) risk litigation and other
needless expenses,(4) and otherwise pose financial and reputational risks. All of these risks could be diminished or
avoided altogether if the Company were to provide protections against viewpoint discrimination that allowed employees of diverse
viewpoints to warn the Company of the risks associated with ideologically blinkered behaviors.
Presently, shareholders are unable to evaluate how
Comcast prevents discrimination towards employees based on their ideology or viewpoint, mitigates employee concerns of potential
discrimination, and ensures a respectful and supportive work atmosphere that bolsters employee performance.
| (1) |
See, e.g., https://www.breitbart.com/sports/2021/08/03/nolte-viewership-ratings-woke-olympics-continue-crash/;
https://www.breitbart.com/the-media/2021/07/21/nolte-far-left-today-show-ratings-crater-30-year-low/; http://theeconomiccollapseblog.com/now-they-are-saying-that-the-repubIican-party-is-the-1-national-security-threat-to-the-united-states-of-america/;
https://www.thedailybeast.com/inside-shepard-smiths-post-fox-news-crash-on-cnbc; https://freebeacon.com/media/wallace-walloped-by-ratings-nosedive/
|
| |
|
| (2) |
See, e.g., https://greenwald.substack.com/p/video-transcript-the-real-disinformation;
https://townhaIl.com/tipsheet/spencerbrown/2021/12/01/body-cam-footage-from-kenosha-casts-doubt-on-nbcs-claims-about-following-rittenhouse-jurors-n2599895;
https://hotair.com/ed-morrissey/2021/11/18/breaking-judge-boots-msnbc-from-rittenhouse-trial-over-jury-tracking-attempt-n430130;
https://greenwald.substack.com/p/a-court-ruled-rachel-maddows-viewers |
| |
|
| (3) |
See, e.g., https://news.yahoo.com/nbc-crew-robbed-oakland-124839098.html
|
| |
|
| (4) |
See, e.g., https://www.washingtonexaminer.com/washington-secrets/liberal-media-scream-chuck-todd-calls-parent-led-opposition-to-criticaI-race-theory-fake;
https://townhall.com/tipsheet/spencerbrown/2021/12/01/body-cam-footage-from-kenosha-casts-doubt-on-nbcs-claims-about-following-rittenhouse-jurors-n2599895;
https://hotair.com/ed-morrissey/2021/11/18/breaking-judge-boots-msnbc-from-rittenhouse-trial-over-jury-tracking-attempt-n430130;
https://greenwald.substack.com/p/a-court-ruled-rachel-maddows-viewers |
2022 Proxy Statement 69
Table of Contents
Without an inclusive EEO policy, Comcast may be
sacrificing competitive advantages relative to peers while simultaneously increasing company and shareholder exposure to reputational
and financial risks.
We recommend that the report evaluate risks including,
but not limited to, negative effects on employee hiring and retention, as well as litigation risks from conflicting state and
company anti-discrimination policies.
Company Response to Shareholder
Proposal
We recognize that our employees hold a wide range
of political viewpoints, and we respect that diversity of thought as long as its expression is consistent with applicable law
and our company’s policies. As set forth in our Code of Conduct, “respect for each other” is one of our core
values. We are committed to a culture of fairness, respect and inclusion that drives us to value and embrace differences, including
with respect to political affiliation.
Our current company policies and practices already
make clear that diverse viewpoints are not only respected but encouraged. We are committed to creating a culture that is safe
and accessible for all and that affirms different perspectives. Our recent employee engagement survey results have confirmed that
the vast majority of our employees believe that their managers encourage an environment where different perspectives are valued
and that there is an equal opportunity to have a successful career at Comcast regardless of differences or background.
Given our existing policies and practices, we do
not believe that adding ‘viewpoint’ or ‘ideology’ to our equal employment opportunity policy is in the
best interests of our shareholders. Our equal employment policy prohibits discrimination and harassment based on protected characteristics
such as race, color, religion, creed, ethnicity, national origin or ancestry, citizenship or immigration status, sex, sexual orientation,
gender, gender identity or expression, and any other characteristic protected by law. This latter protection would include any
state or local law that prohibits an employer from taking action based on an employee’s political affiliation or political
activities.
As a result, we do not believe that implementing
this proposal is in the best interests of our company or our shareholders.
For the reasons set forth above, our Board unanimously recommends AGAINST
this proposal.
70
Table of Contents
Proposal 7: SHAREHOLDER PROPOSAL TO CONDUCT AND PUBLICLY RELEASE THE RESULTS OF AN INDEPENDENT INVESTIGATION INTO THE EFFECTIVENESS OF SEXUAL HARASSMENT POLICIES
|
|
Our Board unanimously
recommends that shareholders vote “AGAINST” this shareholder proposal. |
The following proposal and supporting statement
were submitted by Dorrit Lowsen, c/o Arjuna Capital, 1 Elm Street, Manchester, MA 01944.
Supporting Statement
SEXUAL HARASSMENT
WHEREAS: Comcast and its subsidiaries are under intense public
scrutiny for an alleged failure to protect employees from sexual harassment, hold those culpable accountable, and report transparently.
NBC attracted global attention when it fired “Today” host Matt Lauer for ongoing workplace sexual harassment. In 2019,
Ronan Farrow alleged Comcast covered up accusations against Lauer. NBC News’ digital editorial staff formed a union soon
after, noting “serious questions” about the company’s treatment of women and people of color, management of
workplace sexual misconduct, and “opaque” procedures for “exposing powerful predators.”
Failure to provide a safe workplace extends to Comcast
call centers, where employees described a hostile culture of sexual harassment. In 2018, Comcast fired three call center employees
who filed complaints. Fear of retaliation in reporting harassment is of concern. A U.S. Equal Employment Opportunity Commission
study found that 75 percent of employees reporting harassment experienced retaliation and 87 to 94 percent of harassment victims
did not file complaints.
Controversy has focused on NBC’s insistence
on conducting an internal investigation led by management, rather than independent advisors. The Council of Institutional Investors
states best practice sexual harassment investigation should involve “non-conflicted outside firms”. Six 2020 presidential
candidates called on the Democratic National Committee to demand Comcast conduct an independent investigation into its toxic culture.
Workplace harassment can result in higher turnover,
lower productivity, increased absenteeism, and higher sick leave costs, harming shareholder value. A recent academic study found
companies with the highest incidences of sexual harassment underperform the U.S. stock market by 19.9 percent the subsequent year.
Companies that experienced a high number of allegations also saw a decline in Return on Equity of 10.9 percent, and labor costs
rose 7 percent. A Harvard Business Review study found a single sexual harassment claim can make a company seem less equitable
and would “be enough to dramatically shape public perception of a company and elicit perceptions of structural unfairness.”
While Comcast has conducted prior investigations
into sexual harassment allegations, it has failed to report transparently on any independent investigation to employees and investors.
To avoid legal and reputational risk and maintain shareholder value, Comcast must create a culture of accountability and transparency,
protecting employees from harassment and discrimination.
RESOLVED: Shareholders urge the Board of Directors to release a
transparency report (at reasonable expense, omitting confidential or privileged information) to shareholders assessing the effectiveness
of the company’s workplace sexual harassment policies, including the results of a comprehensive, independent audit/investigation,
analysis of policies and practices, and commitments to create a safe, inclusive work environment.
SUPPORTING STATEMENT: Proponents suggest the report be published
annually and summarize:
| ● |
Effectiveness of sexual harassment and gender
discrimination policies, trainings, and measures |
| |
|
| ● |
Results of any independent investigation into employee or executive
level allegations |
| |
|
| ● |
Steps taken (or that could be taken) to hold employees and executives
accountable |
| |
|
| ● |
Number of sexual harassment cases investigated and the resolution |
2022 Proxy Statement 71
Table of Contents
Company Response to Shareholder Proposal
The culture of our company is built on integrity,
and one of our core values is our respect for each other. We are committed to a culture of fairness, respect and inclusion within
our leadership and our workforce. We are clear that harassment and discrimination are not tolerated in any form. We take any allegation
of harassment and/or discrimination seriously, investigate it, take action as appropriate and seek ways to continuously strengthen
our compliance program. Underscoring our commitment to creating a respectful work environment, the Governance and Corporate Responsibility
Committee of our Board oversees, monitors and receives reports on harassment and discrimination in the workplace.
It is important to note that this proposal does
not request that we conduct an investigation into any specific allegation of sexual harassment. Instead, it seeks an independent
investigation and report on the effectiveness of our sexual harassment policies and it requests that we conduct this independent
audit/investigation and publish a report every year. As such, the very essence of this request already is deeply embedded in our
day-to-day business. We devote significant time and resources in the ordinary course of our business to combat harassment and
discrimination of any type and have a robust process to help identify, manage and mitigate risks relating to sexual and other
types of harassment with appropriate Board oversight. In addition, in recognizing the importance of transparency, many of our
policies, practices and procedures, and efforts and enhancements made to further combat these issues, are publicly disclosed.
As a result, as discussed in greater detail below, we believe shareholders would be better served with our resources being used
to continue building on the significant enhancements we have undertaken across our workplace to combat harassment and discrimination.
An external independent investigation will divert management’s attention and significant resources toward responding to,
and preparing documents for, an external investigation team, unnecessarily pulling focus from our extensive ongoing efforts to
maintain and further entrench a respectful working environment.
A similar form of this proposal from the proponent
has appeared in our 2020 and 2021 proxy statements, and both times, over a majority of our shareholders did not support the proposal.
While the specific request has been reworded, the substance of the proposal remains unchanged – requesting that we undertake
an independent investigation into, and provide a report on, our workplace sexual harassment policies and practices.
Our Board continues to believe that the proponent’s requested independent
investigation and associated report are not in the best interests of our shareholders and recommends that shareholders vote AGAINST
this proposal. Specifically, while we unequivocally share the proponent’s underlying concerns about sexual harassment
in the workplace, we do not believe it is necessary or appropriate to override the Board’s and management’s established
roles in overseeing and managing the Company’s strong commitments in this space by mandating an independent investigation,
for the reasons summarized below.
We have strong, existing company policies, practices and procedures
that prohibit all forms of harassment, discrimination and retaliation.
| ● |
Company Policies. We have strong, clearly defined
and widely communicated policies that prohibit all forms of harassment and discrimination, sexual or otherwise, as well as
other inappropriate conduct that does not rise to the level of harassment or discrimination under the law. Our Code of Conduct,
which our Board approves, is available under “Corporate Governance” in the Investors section of our website at
www.cmcsa.com. We also maintain policies prohibiting retaliation against employees
who in good faith raise a concern or assist in an investigation. |
| |
|
| ● |
Complaint Reporting and Employee Hotlines. We
are committed to creating an environment where employees feel comfortable speaking up without fear of retaliation—we
encourage and expect those who witness discriminatory, harassing, offensive, abusive, threatening or retaliatory conduct or
other behavior inconsistent with a respectful workplace to speak up, and require that supervisors do so. We foster an open
reporting environment that makes it easy for employees to ask questions, raise concerns and speak up—whether it relates
to harassment, discrimination, retaliation or any other suspected illegal or unethical conduct. |
| |
|
| |
● |
We have effective and well-communicated channels
in place for employees to report concerns. We encourage employees to raise concerns about harassment or discrimination to
their manager or any other local leader, their HR representative, or a member of the legal department. Employees may also
raise such concerns through the Comcast NBCUniversal Listens and Sky Listens global helplines and an online portal, which
are managed by an independent third-party company and are available 24/7 to report a concern. Notably, employees may report
concerns anonymously through these hotlines where legally permissible. Once reported, concerns are promptly routed to the
appropriate personnel and investigated. |
| |
|
|
| |
● |
A violation of the Code of Conduct or a Company policy (including
our anti-retaliation policy) may result in disciplinary action, up to and including termination of employment, regardless
of an employee’s title or tenure. |
| |
|
|
| |
● |
Importantly, the vast majority of our employees, as shown in our
employee engagement survey results, are aware of how to report ethical concerns or observed misconduct, believe they can report
such matters without fear of retaliation, and believe that we will address misconduct or behavior deemed to be unethical. |
72
Table of Contents
| ● |
Training Programs and Communications. We have
developed comprehensive and mandatory training programs to educate employees about our Code of Conduct and our harassment
and discrimination policies and procedures, including training on our anti-retaliation policy and how to report concerns.
We regularly review our harassment and discrimination training offerings with the goal that the content remains effective.
Employee communications and intranet content across our business units establish “tone from the top” on our company’s
culture and regularly raise awareness about how to speak up. |
| |
|
| ● |
Compliance Team Oversight and Internal Investigation
Processes. Our legal, compliance and human resources teams design our policies, procedures and practices with a view toward
enabling our employees to recognize the importance of behaving respectfully toward each other and encouraging them to come
forward if they believe that they have been subject to, or become aware of, inappropriate behavior. We treat allegations with
care and have internal investigation teams that handle investigations into any alleged wrongdoing and oversee remediation
activities, including disciplinary action, as appropriate. We continually assess our policies, procedures and practices, including
with a view toward how they can be further enhanced to protect against future incidents or wrongdoing. |
| |
|
| |
● |
The proposal references the allegations of sexual
harassment in our NBC News Division dating back to 2017. As previously described in our 2020 and 2021 proxy statements, NBCUniversal
conducted a comprehensive internal investigation and culture assessment. The investigation team was led by NBCUniversal’s
General Counsel, independent of NBC News and composed of persons outside of the News Division, and two outside law firms were
consulted. The results of this investigation and culture assessment were not only reported to and discussed with our Board,
but also were publicly released. In response to that investigation’s findings and to bolster our long-standing policies,
procedures and practices, the publicly released report outlines how we strengthened our policies, procedures and practices,
including trainings, related to allegations of sexual harassment and similar misconduct. |
| |
|
|
| |
● |
We have tracked significant improvements in our employee engagement
survey results for the media businesses of NBCUniversal over the past five years, which we believe is due to our extensive
remediation efforts. In particular, between 2017 and 2021, our employee engagement survey results reflect a 20 percentile
increase in the number of these employees who believe that NBCUniversal will address misconduct or behavior deemed to be unethical. |
Our Board is dedicated to overseeing and supporting management’s
efforts to combat harassment and discrimination.
| ● |
Senior management and our Board oversee our efforts
to combat harassment and discrimination of all forms. To further underscore the Board’s commitment to such oversight
and to further strengthen our compliance program, in 2020 we consolidated Board oversight of harassment and discrimination
issues with the Governance and Corporate Responsibility Committee and updated its charter to reflect this oversight. This
Committee oversees, monitors and receives reports on harassment and discrimination in the workplace, including with respect
to the general handling of allegations of harassment and discrimination received by our company. In addition, this Committee
would be informed if there were ever any allegation or investigation into a serious claim of harassment or discrimination
involving one of our executive officers. |
| |
|
| ● |
Our Board, through its committees, also receives periodic reports
on our Comcast NBCUniversal Listens and Sky Listens programs and on our employee engagement surveys. |
| |
|
| ● |
Our Board and senior management team are committed to, and management
is incentivized through our executive compensation program to create, a strong workplace culture with values of integrity
and respect and to foster our company’s diversity, equity and inclusion (“DE&I”) efforts. |
Looking ahead, we will seek ways to continuously strengthen our
compliance program.
We will continue to take any allegation of harassment
or discrimination seriously, investigate it, take appropriate action and seek ways to continuously strengthen our compliance program.
We are committed to creating an engaged workforce
through proactive listening and constructive dialogue. We believe that our employees value our workplace culture and recognize
us as an employer of choice.
Over the years, our company and our talented team
have been recognized by numerous organizations and publications for leadership in a variety of areas, including many third-party
recognitions relating to our human capital management and DE&I initiatives that can be found under “Awards &
Recognition” on our website at www.comcastcorporation.com.
*********
For the reasons set forth above, our Board unanimously recommends AGAINST
this proposal.
2022 Proxy Statement 73
Table of Contents
Proposal 8: SHAREHOLDER PROPOSAL TO REPORT ON HOW RETIREMENT PLAN OPTIONS ALIGN WITH COMPANY CLIMATE GOALS
|
|
Our Board unanimously
recommends that shareholders vote “AGAINST” this shareholder proposal. |
The following proposal and supporting statement
were submitted by The Elizabeth Kantor Trust U/A DTD 3/11/1993, 348 Cumberland Street, San Francisco, CA 94114, and John &
Shari Behnke Rev Trust (S), 3701 E Valley Street, Seattle, WA 98112.
Supporting Statement
WHEREAS: Shareholders applaud Comcast for adopting ambitious operational
climate goals:
| ● |
Recently setting the ambitious goal of being carbon
neutral by 2035 in Scope 1 and 2 emissions across entire global operations.(1) |
| |
|
| ● |
Committing to purchasing 100% renewable energy for cable facilities
and network operations in Houston, Texas. |
| |
|
| ● |
Installing fuel efficiency software in 17,500 of cable vans and trucks
between 2016 and 2018.(2) |
While the Company has made significant efforts to
address climate change across its operations, data from Securities and Exchange Commission (SEC) filings demonstrates misalignment
between the Company’s sustainability goals and investment options offered through the Comcast Corporation Retirement-Investment
Plan.
Every investment fund offered by the Comcast retirement
plan, including the default option (holding 52% of employee investments), contains major oil and gas, fossil-fired utilities,
coal, pipelines, oil field services, or companies in the agribusiness sector with deforestation risk.
comcast corporation employee savings plans master trust
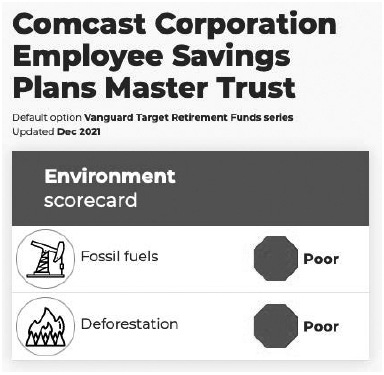
Comcast Corporation Employee Savings Master Trust Default option Vanguard Target Retirement Funds Series Update Dec 2021Fossil Fuels, PoorDeforestation, Poor
A recent scorecard, produced by investor representative
As You Sow, shows that the Comcast retirement plan default option is rated poor due to significant investments in fossil fuel
companies and companies with deforestation risk.(3)
Comcast’s retirement plan currently offers
no diversified equity funds that are low carbon, defined as intentionally avoiding investments in fossil fuels companies, companies
with deforestation risk, and companies with high carbon emissions. It offers zero funds screened for environmental/social impact.
As a result of these limited options, the vast majority
of the $15.1 billion employee retirement dollars invested through the Comcast Corporation Employee Savings Plans Master Trust
as of December 2020(4) was invested in funds rated poorly on carbon emissions.
| |
|
| (1) |
https://update.comcast.com/wp-content/uploads/sites/33/dlm_uploads/2021/06/Comcast-Impact-Report-FIN3.pdf |
| |
|
| (2) |
https://corporate.comcast.com/values/report/2019/sustainability/drive-to-zero-emissions
|
| |
|
| (3) |
https://investyourvalues.org/retirement-plans/comcast |
| |
|
| (4) |
https://investyourvalues.org/files/comcast/comcast-master-trust-form-5500-filing-2020.pdf |
74
Table of Contents
Comcast’s investment in high carbon companies
through its retirement plan choices directly contradicts the climate reduction actions it has committed to take in its operations,
creating cognitive dissonance and reputational risk. This may also make it more difficult to retain employees who are increasingly
concerned about catastrophic climate impacts. The climate impact of continuing to choose high carbon retirement plan investments
options over low carbon choices raises red flags for the Company’s reputation.
BE IT RESOLVED: Shareholders request the Board, at reasonable expense
and excluding proprietary information, prepare a report reviewing the Company’s retirement plan options with the board’s
assessment of how the Company’s current retirement plan options align with its climate action goals.
SUPPORTING STATEMENT: Proponent suggests the report include, at
Board discretion:
| ● |
How Comcast could provide employees with more
sustainable investment options such as a default option that is better aligned with global and Company climate goals; |
| |
|
| ● |
If the Board does not intend to include additional low carbon investment
options in its employee retirement plan, a statement of the basis for its decision. |
Company Response to Shareholder Proposal
The proposal’s request appears to be based
on a flawed understanding of the basic fiduciary requirements that underpin investment options in U.S. retirement plans. As is
customary for large retirement plans, we have an internal management investment committee that serves as our retirement plans’
fiduciary which, with the assistance of professional third-party advisors, is responsible for the administrative duties of selecting
and monitoring our retirement plans’ investment options.
In fact, U.S. law mandates that a responsible plan
fiduciary select retirement plan investment options “solely” in the interest of plan participants and beneficiaries.
According to the U.S. Department of Labor, the federal agency that interprets and enforces federal pension law, a retirement plan
fiduciary that selects plan investments may not (i) subordinate the interests of participants and beneficiaries in their retirement
income or financial benefits under retirement plans to other objectives or (ii) sacrifice investment return or take on additional
investment risk to promote goals unrelated to the retirement plan and its participants and beneficiaries. Accordingly, the selection
of the 401(k) investment options by the responsible plan fiduciary must be made independently from our environmental sustainability
leadership and operational climate goals.
We recognize that the investment objectives and
investment horizons of individuals participating in our retirement plans and saving for retirement may vary significantly. The
fundamental request of this proposal, however, would seek to impose a specific and uniform set of non-economic goals, promoted
by Comcast and set for reasons completely outside of any specific financial planning or investment considerations, on all of our
retirement plan participants and beneficiaries. There is no connection—and in fact under the law there cannot be a connection—between
our climate action goals or other company values and the selection of investment funds made available under our retirement plans.
This proposal is misguided in seeking to connect the two.
For the reasons set forth above, our Board unanimously recommends AGAINST
this proposal.
2022 Proxy Statement 75
Table of Contents
Information about Stock Ownership
Outstanding Shares and Voting Rights
At the close of business on April 4, 2022, the record date, we
had outstanding 4,470,570,372 shares of Class A common stock and 9,444,375 shares of Class B common stock.
On each matter to be voted on, the holders of Class A common stock
and Class B common stock will vote together. As of the record date, each holder of Class A common stock is entitled to 0.0634 votes
per share and each holder of Class B common stock is entitled to 15 votes per share.
We must have a quorum to carry on the business of the annual meeting
of shareholders. This means that, for each matter presented, shareholders entitled to cast a majority of the votes that all shareholders
are entitled to cast on that matter must be represented at the meeting, either by proxy or by attending the meeting. If the meeting
is adjourned for one or more periods aggregating at least five days due to the absence of a quorum, those shareholders who are
entitled to vote and who attend the adjourned meeting, even though they do not constitute a quorum as described above, will constitute
a quorum for the purpose of electing directors at such reconvened meeting. If the meeting is adjourned for one or more periods
aggregating at least 15 days due to the absence of a quorum, shareholders who are entitled to vote and who attend the adjourned
meeting, even though they do not constitute a quorum as described above, will constitute a quorum for the purpose of acting on
any matter described in this proxy statement other than the election of directors.
The director candidates who receive the most votes will be elected
to fill the available seats on our Board. Approval of the other proposals requires the favorable vote of a majority of the votes
cast. Only votes for or against a proposal count for voting purposes. Withheld votes in regard to the election of directors, abstentions
and broker nonvotes count for quorum purposes, but have no effect on the outcome of the proposals. Broker nonvotes occur on a matter
when a bank, brokerage firm or other nominee is not permitted by applicable regulatory requirements to vote on that matter without
instruction from the owner of the shares and no instruction is given. Absent instructions from you, your broker may vote your shares
on the ratification of the appointment of our independent auditors, but may not vote your shares on the election of directors or
any of the other proposals.
Principal Shareholders
This table sets forth information as of December 31, 2021 about
persons we know to beneficially own more than 5% of any class of our voting common stock.
| TITLE OF VOTING CLASS |
|
NAME AND ADDRESS OF BENEFICIAL
OWNER |
|
AMOUNT
BENEFICIALLY OWNED |
|
PERCENT
OF CLASS |
| Class A common stock |
|
The Vanguard Group
100 Vanguard Blvd., Malvern, PA 19355 |
|
396,613,344(1) |
|
8.7% |
| Class A common stock |
|
BlackRock, Inc.
55 East 52nd Street, New York, NY 10055 |
|
313,915,209(2) |
|
6.9% |
| Class B common stock |
|
Brian L. Roberts
One Comcast Center, Philadelphia, PA 19103 |
|
9,444,375(3) |
|
100% |
| |
|
| (1) |
This information is based upon a Schedule 13G/A filing with the SEC on February
9, 2022 made by The Vanguard Group setting forth information as of December 31, 2021. The Vanguard Group disclosed having
sole voting power over 0 shares of our Class A common stock, shared voting power over 7,230,908 shares of our Class A common
stock, sole dispositive power over 378,196,696 shares of our Class A common stock and shared dispositive power over 18,416,648
shares of our Class A common stock. |
| |
|
| (2) |
This information is based upon a Schedule 13G/A filing with the SEC on March 11, 2022 made
by BlackRock, Inc. setting forth information as of December 31, 2021. BlackRock, Inc. disclosed having sole voting power over
272,426,492 shares of our Class A common stock and sole dispositive power over 313,915,209 shares of our Class A common stock |
| |
|
| (3) |
Includes 9,039,663 shares of Class B common stock owned by a limited liability company
of which Mr. Roberts is the managing member and 404,712 shares of Class B common stock owned by certain family trusts of which
Mr. Roberts and/or his descendants are the beneficiaries. The shares of Class B common stock beneficially owned by Mr. Roberts
represent 33 1/3% of the combined voting power of the two classes of our voting common stock, which percentage is generally
non-dilutable under the terms of our articles of incorporation. Under our articles of incorporation, each share of Class B
common stock is convertible at the shareholder’s option into a share of Class A common stock. For information regarding
Mr. Roberts’ beneficial ownership of Class A common stock, see the table immediately below, “Security Ownership
of Directors and Executive Officers.” |
76
Table of Contents
Security Ownership of Directors
and Executive Officers
This table sets forth information as of March 1, 2022 about the
amount of common stock beneficially owned by (i) our current directors (all of whom, other than Ms. Bergman, are also director
nominees), (ii) the NEOs listed in “Executive Compensation Tables – Summary Compensation Table” and (iii) our
directors and executive officers as a group. No shares of common stock held by our directors or executive officers are held in
margin accounts or have been hedged or pledged.
| |
|
AMOUNT BENEFICIALLY
OWNED(1) |
|
PERCENT OF CLASS |
| NAME OF BENEFICIAL OWNER |
|
CLASS A(2) |
|
CLASS B |
|
CLASS A(2) |
|
CLASS B |
| Kenneth J. Bacon |
|
33,269 |
|
|
— |
|
|
* |
|
— |
|
| Madeline S. Bell |
|
37,920 |
(3) |
|
— |
|
|
* |
|
— |
|
| Naomi M. Bergman |
|
21,923 |
(4) |
|
— |
|
|
* |
|
— |
|
| Edward D. Breen |
|
126,934 |
(5) |
|
— |
|
|
* |
|
— |
|
| Michael J. Cavanagh |
|
2,870,235 |
(6) |
|
— |
|
|
* |
|
— |
|
| Gerald L. Hassell |
|
173,272 |
|
|
— |
|
|
* |
|
— |
|
| Jeffrey A. Honickman |
|
338,025 |
(7) |
|
— |
|
|
* |
|
— |
|
| Maritza G. Montiel |
|
13,783 |
(8) |
|
— |
|
|
* |
|
— |
|
| Asuka Nakahara |
|
46,087 |
|
|
— |
|
|
* |
|
— |
|
| David C. Novak |
|
367,871 |
(9) |
|
— |
|
|
* |
|
— |
|
| Brian L. Roberts |
|
32,009,716 |
(10) |
|
9,444,375 |
(11) |
|
* |
|
100% |
(11) |
| Jeff Shell |
|
720,907 |
|
|
— |
|
|
* |
|
— |
|
| Dana Strong |
|
321,264 |
|
|
— |
|
|
* |
|
— |
|
| David N. Watson |
|
2,671,915 |
(12) |
|
— |
|
|
* |
|
— |
|
| All directors and executive officers as a group (17 persons) |
|
40,182,892 |
(13) |
|
9,444,375 |
|
|
* |
|
100% |
|
| |
|
| * |
Less than 1% of the outstanding
shares of the applicable class. |
| |
|
| (1) |
Beneficial ownership as reported in
the above table has been determined in accordance with Rule 13d-3 under the Exchange Act. |
| |
|
| (2) |
Includes beneficial ownership of the
following number of shares for which the following persons hold options exercisable on or within 60 days of March 1, 2022:
Mr. Cavanagh, 2,492,308; Mr. Roberts, 5,356,210; Mr. Shell, 263,202; Ms. Strong 227,211; Mr. Watson, 1,646,785; and all executive
officers as a group, 10,273,706. |
| |
|
| |
Includes beneficial ownership of the
following number of shares underlying stock units held by the following persons that vest on or within 60 days of March 1,
2022: Mr. Cavanagh, 136,687; Mr. Roberts, 170,923; Mr. Shell, 62,999; Ms. Strong, 17,934; Mr. Watson, 95,001; and all executive
officers as a group, 557,371. |
| |
|
| |
Includes the following number of shares
that will be paid at a future date in stock under our deferred compensation plans for the following persons: Ms. Bell, 33,400;
Ms. Bergman, 14,723; Mr. Breen, 2,110; Mr. Hassell, 168,562; Mr. Honickman, 216,742; Ms. Montiel, 12,985; Mr. Nakahara, 41,895;
and Mr. Novak, 38,321. |
| |
|
| (3) |
Includes 2,200 shares held jointly
by her and her spouse and 400 shares held by her spouse. |
| |
|
| (4) |
Ms. Bergman is not a nominee for director
at our 2022 annual meeting. Includes 300 shares held by a family trust. |
| |
|
| (5) |
Includes 101,140 shares held by a
grantor retained annuity trust of which he is a trustee. |
| |
|
| (6) |
Includes 238,540 shares and 1,167,777
shares underlying options held by a trust of which his spouse is a trustee. |
| |
|
| (7) |
Includes 20,000 shares held by a grantor
trust of which he is a trustee. |
| |
|
| (8) |
Includes 425 shares held in an individual
retirement account. |
| |
|
| (9) |
Includes 500 shares held by family
trusts. |
| |
|
| (10) |
Includes 286,044 shares owned by his
spouse; 480 shares owned by his daughter; 1,438,016 shares owned by a family charitable foundation of which his spouse is
a trustee; 13,712,646 shares owned by limited liability companies of which he is the managing member; and 7,404,817 shares
owned by certain family trusts. Does not include shares of Class A common stock issuable upon conversion of Class B common
stock beneficially owned by him; if he were to convert the Class B common stock into Class A common stock, he would beneficially
own approximately 1% of the Class A common stock. |
| |
|
| (11) |
See footnote (3) under “—
Principal Shareholders” above. |
| |
|
| (12) |
Includes 140 shares owned by his spouse;
5,328 shares owned by his children; and 440,842 shares held in family trusts. |
| |
|
| (13) |
Includes 25 shares held by a family
trust. |
2022 Proxy Statement 77
Table of Contents
Delinquent Section 16(a) Reports
Our directors and executive officers file reports with the SEC
pursuant to Section 16(a) of the Exchange Act indicating the number of shares of any class of our equity securities they owned
when they became a director or executive officer and, after that, any changes in their ownership of our equity securities. Based
on our review of such reports and written representations from the individuals required to file the reports, we believe that all
filings required to be made by our reporting persons for 2021 were made on a timely basis, other than a late Form 4 filing on behalf
of each of Thomas J. Reid and Jeffrey Shell with respect to two and three transactions, respectively, that were subsequently reported.
Compensation of Directors
Director Compensation Program
From time to time, the Compensation and Human Capital Committee
directs an independent compensation consultant to provide analyses with respect to various nonemployee director compensation data.
Korn Ferry last provided this analysis in 2021. For 2021, our nonemployee directors received annual compensation as follows:
| DIRECTOR
FEES |
|
COMMITTEE
MEMBERSHIP FEES |
| |
|
|
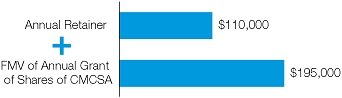 |
|
 |
Annual Retainer FMV of
Annual Grant of Shares of CMCSA $110,000 $195,000 Audit Committee Compensation and Human
Capital Committee Governance and Corporate Responsibility Committee $40,000 $15,000 $15,000 $12,500 $40,000 $20,000 Chair Member
The annual retainer may be received, at the election of the nonemployee director,
in shares of Class A common stock, the receipt of which may be deferred in whole or in part. The receipt of the annual stock grant
(which is fully vested upon grant) also may be deferred in whole or in part under our restricted stock plan. Any fees received
by a director may be deferred in whole or in part under our deferred compensation plans. Deferred fees must be invested notionally
in a third-party mutual or exchange fund or our Class A common stock fund (with dividends being reinvested in Comcast stock).
A director emeritus receives an annual cash payment equal to the
fair market value of our annual stock grant and the same annual Board retainer as provided above for nonemployee directors for
the first year of service and remains eligible for participation in our deferred compensation plans for the first two years of
service.
Nonemployee directors and directors emeritus are reimbursed for
travel expenses for meetings attended and are provided with our high-speed internet, video, voice and home security and automation
services at two residences, if in our service areas, at no cost during the time they serve, and for five years thereafter.
Director Stock Ownership Policy
Our nonemployee director stock ownership policy requires our nonemployee
directors to hold a number of shares of our common stock having a value equal to five times the director’s annual cash retainer.
Each nonemployee director has a period of five years following his or her first year of service to reach this ownership requirement.
For purposes of this policy, “ownership” includes 60% of any deferred shares. In determining compliance, the Compensation
and Human Capital Committee may consider any noncompliance that occurs solely or primarily as a result of a decline in the market
price of our stock. All nonemployee directors satisfied the requirements of our stock ownership policy in 2021.
78
Table of Contents
Director Compensation
The following table sets forth specified information regarding
the compensation of our nonemployee directors in 2021. No information is provided for Mr. Roberts, who is an employee director
and does not receive compensation for his services as a director.
| NAME |
|
FEES
EARNED
OR PAID
IN CASH(1)
($) |
|
STOCK
AWARDS(2)
($) |
|
TOTAL
($) |
| Kenneth J. Bacon |
|
130,000 |
|
195,017 |
|
325,017 |
| Madeline S. Bell |
|
122,500 |
|
195,017 |
|
317,517 |
| Naomi M. Bergman(3) |
|
125,000 |
|
195,017 |
|
320,017 |
| Edward D. Breen |
|
150,000 |
|
195,017 |
|
345,017 |
| Gerald L. Hassell |
|
125,000 |
|
195,017 |
|
320,017 |
| Jeffrey A. Honickman |
|
162,500 |
|
195,017 |
|
357,517 |
| Maritza G. Montiel |
|
125,000 |
|
195,017 |
|
320,017 |
| Asuka Nakahara |
|
125,000 |
|
195,017 |
|
320,017 |
| David C. Novak |
|
125,000 |
|
195,017 |
|
320,017 |
| |
|
| (1) |
This column represents all
cash retainers and meeting fees earned by our nonemployee directors in 2021, regardless of whether such amounts were deferred
or elected to be received in shares of our Class A common stock. Refer to footnote (2) of the Security Ownership of Directors
and Executive Officers table for information on shares deferred by directors. |
| |
|
| (2) |
The amounts in this column represent
the aggregate grant date fair value for each award of shares of Class A common stock granted in 2021, in accordance with FASB
ASC Topic 718. The amounts in this column were calculated using the valuation assumptions discussed in the “Share-Based
Compensation” footnote to the financial statements in our Annual Report on Form 10-K for the year ended December 31,
2021. The amounts were determined by multiplying the Class A common stock closing price on November 22, 2021 by the number
of shares subject to the grant. |
| |
|
| (3) |
Ms. Bergman is not a nominee for director
at our 2022 annual meeting. |
Related Party Transactions Policy and Certain Transactions
We review all transactions, except for certain de minimis transactions
as set forth in our related party transactions policy, involving us in which any of our directors, director nominees, significant
shareholders and executive officers and their immediate family members are participants, to determine whether such person has a
direct or indirect material interest in the transaction. All directors, director nominees and executive officers are required to
promptly notify our Chief Legal Officer of any proposed transaction involving us in which such person has a direct or indirect
material interest. The proposed transaction is then reviewed by either the independent members of our Board as a whole, the Governance
and Corporate Responsibility Committee or the Audit Committee to determine whether the proposed transaction is a related party
transaction under our policy. In reviewing any related party transaction, the independent members of the Board as a whole, the
Governance and Corporate Responsibility Committee or the Audit Committee will determine whether or not to approve or ratify the
transaction based on all relevant facts and circumstances, including the following:
| ● |
the materiality and character of the related person’s
interest in the transaction; |
| |
|
| ● |
the commercial reasonableness of the terms of the transaction; |
| |
|
| ● |
the benefit and perceived benefit, or lack thereof, to our company; |
| |
|
| ● |
the opportunity costs of alternate transactions; and |
| |
|
| ● |
the actual or apparent conflict of interest of the related person. |
2022 Proxy Statement 79
Table of Contents
If the reviewing body determines that a transaction has potential
conflict of interest issues and other circumstances warrant, it may also recommend that a special committee review the transaction.
After such review, the reviewing body approves or ratifies the transaction only if it determines that the transaction is in, or
not inconsistent with, the best interests of our company and our shareholders. Our related party transactions policy is posted
under “Corporate Governance” in the Investors section of our website at www.cmcsa.com.
Related Party Transactions
In connection with Mr. Roberts’ use of an aircraft he leases
from a third party, we have agreed to provide various operational services for the aircraft for Mr. Roberts and his immediate family
members, including by providing pilots and performing general operational and maintenance services. Pursuant to this agreement,
Mr. Roberts is responsible for reimbursing us for the costs we incur in operating and maintaining the aircraft. For 2021, Mr. Roberts
paid us an aggregate of approximately $360,000 related to this agreement.
Mr. Roberts’ son is an employee of Comcast Spectacor, one
of our business units. He received approximately $616,000 in compensation from us and also participated in our employee benefit
plans on the same basis as other similarly situated employees in 2021.
As previously disclosed in the proxy statement for our 2021 annual
meeting of shareholders, we entered into an arm’s-length transaction in 2021 relating to the purchase of condominium units
from an LLC controlled by Mr. Roberts and his wife for use as additional suites for a hotel we own.
Other Information
Who May Vote
Holders of record of Class A and Class B common stock of Comcast
at the close of business on April 4, 2022 may vote at the annual meeting of shareholders. The Notice of Internet Availability of
Proxy Materials (the “Notice”) is being mailed, and this proxy statement is being made available, to our shareholders
beginning on or about April 22, 2022.
Participating and Voting at the
Meeting
Attendance at the meeting for purposes of voting and asking questions
is limited to shareholders of record on April 4, 2022. Please be sure to have your proxy voting card or notice with you so that
you may access your 16-digit control number to log on to the meeting. If your shares are held in the name of your bank, brokerage
firm or other nominee, please have your voting instruction form received from your bank, brokerage firm or other nominee, which
will contain the relevant control number.
If you encounter any difficulties accessing the virtual meeting,
please call the technical support number that will be posted on the meeting login page. If there are any technical issues in convening
or hosting the meeting, we will promptly post information to the Investors section of our website at www.cmcsa.com,
including information on when the meeting will be reconvened. If your shares are held in the name of your bank, brokerage firm
or other nominee and you have any questions about your control number, please contact the bank, brokerage firm or other nominee
that holds your shares.
Conduct of the Meeting
The Chairman of our Board (or any other person designated by our
Board) has broad authority to conduct the annual meeting of shareholders in an orderly manner. This authority includes establishing
rules of conduct, which will be available at the meeting online, for shareholders who wish to participate in the meeting. We have
structured our virtual meeting to provide shareholders the same rights as if the meeting were held in person, including the ability
to vote shares electronically during the meeting and ask questions in accordance with the rules of conduct for the meeting. Questions
may be submitted during the meeting in the online question box provided at the meeting. Questions submitted in accordance with
the rules of conduct generally will be addressed in the order received (both with respect to specific agenda items and the general
question and answer session) and will be read as submitted, unless the question is duplicative of a question already asked and
answered or is deemed profane or otherwise inappropriate, in which case the question may be edited or paraphrased.
80
Table of Contents
How to Vote
You may vote at the meeting or by proxy before the meeting. We
recommend that you vote by proxy even if you plan to participate in the meeting. You can always change your vote at the meeting.
How Proxies Work
Our Board of Directors is asking for your proxy. Giving us your
proxy means you authorize us to vote your shares at the meeting in the manner you direct. You may vote for all, some or none of
our director candidates. You also may vote for or against the other proposals or abstain from voting.
You can vote by proxy before the meeting in any of the following
ways:
 |
|
 |
|
 |
| Internet |
|
Telephone |
|
Mail |
| Go to www.proxyvote.com or scan the QR code on your Notice or proxy
card with a smartphone or tablet, and then follow the instructions outlined on the secure website. |
|
Call toll free 1-800-690-6903 and follow the instructions provided on the recorded message. If you hold shares beneficially,
through a broker, brokerage firm, bank or other nominee, please refer to the instructions your broker, brokerage firm, bank
or other nominee provided to you regarding voting by telephone. |
|
Complete, sign and date your proxy card and return it in the enclosed envelope. |
If you vote via the internet or by telephone, your vote must be
received by 11:59 p.m. Eastern Time on May 31, 2022.
If your shares are held in the name of your bank, brokerage firm
or other nominee, please follow the voting instructions you received from your bank, brokerage firm or other nominee.
If you give us your signed proxy but do not specify how to vote, we will
vote your shares (i) in favor of (a) the director candidates, (b) the approval, on an advisory basis, of our executive compensation
and (c) the ratification of the appointment of our independent auditors; and (ii) against each of the shareholder proposals.
Matters to be Presented
We are not aware of any matters to be presented at the meeting
other than those described in this proxy statement. If any matters not described in this proxy statement are properly presented
at the meeting, the proxies will use their own judgment to determine how to vote your shares. If the meeting is postponed or adjourned,
the proxies will vote your shares on the new meeting date in accordance with your previous instructions, unless you have revoked
your proxy.
Revoking a Proxy
You may revoke your proxy before it is voted by:
| ● |
submitting a new proxy with a later date, including
a proxy given via the internet or by telephone; |
| |
|
| ● |
notifying our Secretary in writing before the meeting at the address
given below; or |
| |
|
| ● |
voting in person at the meeting. |
Notice of Electronic
Availability of Proxy Materials
Pursuant to the rules of the SEC, we are making this proxy statement
and our Annual Report on Form 10-K available to our shareholders electronically via the internet. In compliance with this e-proxy
process, on or about April 22, 2022, we mailed to our shareholders of record and beneficial owners the Notice containing instructions
on how to access this proxy statement and our Annual Report on Form 10-K via the internet and how to vote online. As a result,
you will not receive a paper copy of the proxy materials unless you request one. All shareholders may access the proxy materials
on the website referred to in the Notice and in this proxy statement and request to receive a set of the proxy materials by mail
or electronically, in either case,
2022 Proxy Statement 81
Table of Contents
free of charge. If you would like to receive a paper or electronic
copy of our proxy materials, you should follow the instructions for requesting such materials in the Notice. By participating in
the e-proxy process, we reduce the impact of our annual meeting of shareholders on the environment and save money on the cost of
printing and mailing documents to you. See “Electronic Access to Proxy Materials and Annual Report on Form 10-K” below
for further information on electing to receive proxy materials electronically.
Additional Information
on the Annual Meeting of Shareholders
If you have questions or would like more information about the
annual meeting of shareholders, you can contact us in any of the following ways:
| ● |
Via the internet: |
|
Go to www.proxyvote.com
or scan the QR code on your Notice or proxy card with a smartphone or tablet.
|
|
● |
By writing: |
|
Thomas J. Reid, Secretary
Comcast Corporation
One Comcast Center
Philadelphia, PA 19103 |
| ● |
By telephone: |
|
Call toll free 1-866-281-2100 |
|
|
|
|
| |
|
|
|
|
|
|
|
Shareholder Proposals
for Next Year
Any shareholder proposals intended to be presented at our 2023
annual meeting of shareholders and considered for inclusion in our proxy materials under Rule 14a-8 under the Exchange Act (“Rule
14a-8”) must be received no later than the close of business on December 23, 2022 and must comply with the procedures and
requirements of Rule 14a-8. Shareholder proposals failing to comply with the procedures of Rule 14a-8 under the Exchange Act will
be excluded. If the date of our 2023 annual meeting is more than 30 days from June 1, 2023, we will publicly announce a different
submission deadline from that set forth above, in compliance with SEC rules.
Any shareholder proposals (other than those proposals seeking
to nominate directors) that are intended to be presented at the annual meeting of shareholders in 2023 but not to be included in
our proxy materials must comply with the advance notice provision in Section 2.09 of our by-laws. If we call the 2023 annual meeting
of shareholders for a date between May 2, 2023 and July 1, 2023, we must receive notice of the proposal at the mailing address
given on page 82 on or after February 1, 2023 and no later than March 3, 2023. If we call the 2023 annual meeting of shareholders
for any other date, we must receive notice of the proposal no later than the close of business on the tenth day following the day
we mailed notice of, or announced publicly, the date of the meeting, whichever occurs first. If notice is not received by March
3, 2023 (or the close of business on the tenth day following the day we mail notice of, or announce publicly, the date of our 2023
annual meeting of shareholders, if such meeting is not called for a date between May 2, 2023 and July 1, 2023), the shareholder
proposals will be deemed “untimely.”
Shareholders who wish to nominate directors for election must
comply with the procedures described under “Corporate Governance and Board Matters — Board of Directors Nominees —
Director Nominations — Shareholder Nominees.”
All shareholder proposals should be directed to Thomas J. Reid,
Secretary, Comcast Corporation, at our mailing address given on page 82.
Solicitation of Proxies
We pay the cost of this proxy solicitation. Pursuant to SEC rules,
we are making this proxy statement and our Annual Report on Form 10-K available to our shareholders electronically via the internet.
In addition to soliciting proxies by the internet and mail, we expect that a number of our employees will solicit shareholders
personally and by telephone. None of these employees will receive any additional or special compensation for doing this. We have
retained D.F. King & Co., Inc. to assist in the solicitation of proxies for aggregate fees of approximately $32,500 plus reasonable
out-of-pocket costs and expenses. The agreement with D.F. King contains customary indemnification provisions. We will, on request,
reimburse banks, brokerage firms and other nominees for their expenses in sending proxy materials to their customers who are beneficial
owners of our common stock and obtaining their voting instructions.
Electronic Access to Proxy Materials
and Annual Report on Form 10-K
Shareholders can access this proxy statement and our Annual Report
on Form 10-K via the internet at www.proxyvote.com or by scanning the QR code on the
Notice or proxy card with a smartphone or tablet, and then following the instructions
82
Table of Contents
outlined on the secure website. For future annual meetings of
shareholders, shareholders can consent to accessing their proxy materials, including the Notice, the proxy statement and the annual
report, electronically in lieu of receiving them by mail. To receive materials electronically, you will need access to a computer
and an e-mail account. You will have the opportunity to revoke your request for electronic delivery at any time without charge.
If you are a registered shareholder and you have not already done
so, you can choose this electronic delivery option by following the instructions provided when voting via the internet and provided
on the proxy card. Your choice will remain in effect unless you revoke it by contacting our transfer agent, Equiniti Trust Company
D/B/A EQ Shareowner Services (“EQ Shareowner Services”), at 1-888-883-8903 or P.O. Box 64854, St. Paul, MN 55164-0854
or sign on to your account at https://www.shareowneronline.com/comcast. You may update
your electronic address by contacting EQ Shareowner Services.
If you hold your shares through a bank, brokerage firm or other
nominee and you have not already done so, you can choose this electronic delivery option by contacting your nominee or by following
the instructions provided when voting via the internet. Your choice will remain in effect unless you revoke it by contacting your
nominee. You may update your electronic address by contacting your nominee.
Important Notice Regarding Delivery
of Shareholder Documents
Under SEC rules, delivery of each Notice or a single proxy statement
and annual report, as applicable, in a single envelope to two or more shareholders sharing the same mailing address is permitted
under certain conditions. This procedure, called “householding,” is available if all of the following criteria are
met:
| ● |
you have the same address as other shareholders
registered on our books; |
| |
|
| ● |
you have the same last name as the other shareholders; and |
| |
|
| ● |
your address is a residential address or post office box. |
If you meet this criteria, you are eligible for householding and
the following terms apply. If you are not eligible, please disregard this notice.
How do I consent to, or discontinue, the householding process of receiving
just one set of annual disclosure materials?
To give your consent to, or to discontinue, householding, please
notify our transfer agent, EQ Shareowner Services, at 1-888-883-8903 or by mail at P.O. Box 64874, St. Paul, MN 55164-0854 if you
are a registered shareholder, or your bank or broker if you are a beneficial shareholder. Registered and beneficial shareholders
may also discontinue householding by contacting Broadridge by phone at (866) 540-7095 or by mail at Broadridge, Householding Department,
51 Mercedes Way, Edgewood, NY 11717.
The householding consent is considered perpetual, which means
you will continue to receive a single envelope containing each Notice for the household or a single proxy statement and annual
report, as applicable, in the future unless you discontinue this process.
2022 Proxy Statement 83
Table of Contents
Appendix A: Reconciliations of Non-GAAP Financial Measures
We believe that the presentation of financial measures not in
accordance with generally accepted accounting principles in the United States (“GAAP”) provides useful information
to investors regarding our results of operations and financial condition. Our non-GAAP financial measures should be considered
in addition to, but not as a substitute for, operating income, net income, net income attributable to Comcast Corporation, earnings
per common share attributable to Comcast Corporation shareholders, net cash provided by operating activities or other measures
of performance or liquidity reported in accordance with GAAP.
We define Adjusted EBITDA as net income attributable to Comcast
Corporation before net income (loss) attributable to noncontrolling interests and redeemable subsidiary preferred stock, income
tax expense, investment and other income (loss), net, interest expense, depreciation and amortization expense, and other operating
gains and losses (such as impairment charges related to fixed and intangible assets and gains or losses on the sale of long-lived
assets), if any. From time to time we may exclude from Adjusted EBITDA the impact of certain events, gains, losses or other charges
(such as significant legal settlements) that affect the period-to-period comparability of our operating performance. Additional
information and reconciliations of Adjusted EBITDA to net income attributable to Comcast Corporation for the years ended December
31, 2019, 2020 and 2021 are set forth in “Item 7: Management’s Discussion and Analysis of Financial Condition and Results
of Operations – Non-GAAP Financial Measures” on page 52 of our Annual Report on Form 10-K for the year ended December
31, 2021, as filed with the SEC on February 2, 2022 (the “10-K”).
Constant currency and constant currency growth rates are calculated
by comparing the prior year results adjusted to reflect the average exchange rates from the current year rather than the actual
exchange rates that were in effect during the respective prior year. Additional information and a reconciliation of Sky’s
constant currency revenue and Adjusted EBITDA growth rates for 2021 is set forth in “Item 7: Management’s Discussion
and Analysis of Financial Condition and Results of Operations – Non-GAAP Financial Measures” on pages 52-53 of the
10-K.
We define Free Cash Flow as Net Cash Provided by Operating Activities
(as stated in our Consolidated Statement of Cash Flows) reduced by capital expenditures and cash paid for intangible assets. From
time to time, we may exclude from Free Cash Flow the impact of certain cash receipts or payments (such as significant legal settlements)
that affect period-to-period comparability. Cash payments related to certain capital or intangible assets, such as the construction
of Universal Beijing Resort, are presented separately in our Consolidated Statement of Cash Flows and are therefore excluded from
capital expenditures and cash paid for intangible assets for Free Cash Flow. We believe Free Cash Flow provides a meaningful measure
of liquidity and a useful basis for assessing our ability to repay debt, make strategic acquisitions and investments, and return
capital to investors through stock repurchases and dividends. It is also a significant performance measure in our annual incentive
compensation programs. Additionally, we believe Free Cash Flow is useful to investors as a basis for comparing our performance
and coverage ratios with other companies in our industries, although our measure of Free Cash Flow may not be directly comparable
to similar measures used by other companies. Free Cash Flow has certain limitations, including that it does not represent the residual
cash flow available for discretionary expenditures since other non-discretionary payments, such as mandatory debt repayments, are
not deducted from the measure.
RECONCILIATION FROM NET CASH
PROVIDED BY OPERATING ACTIVITIES TO FREE CASH FLOW
($ in millions)
| |
|
YEAR ENDED DECEMBER 31, |
| |
|
2021 |
|
2020 |
|
2019 |
|
| Net cash provided by operating activities |
|
29,146 |
|
24,737 |
|
25,697 |
|
| Capital expenditures |
|
(9,174 |
) |
(9,179 |
) |
(9,953 |
) |
| Cash paid for capitalized software and other intangible assets |
|
(2,883 |
) |
(2,455 |
) |
(2,475 |
) |
| Adjustments related to legal settlements |
|
— |
|
177 |
|
125 |
|
| Free Cash Flow |
|
17,089 |
|
13,280 |
|
13,394 |
|
2022 Proxy Statement A-1
Table of Contents
Appendix B: Nasdaq Board Diversity Matrix
| BOARD DIVERSITY MATRIX (AS OF APRIL 22, 2022) |
| Total Number of Directors |
10 |
| |
Female |
Male |
| Part I: Gender Identity |
|
|
| Directors |
3 |
7 |
| Part II: Demographic Background |
|
|
| African American or Black |
— |
1 |
| Asian |
— |
1 |
| Hispanic or Latinx |
1 |
— |
| White |
2 |
5 |
2022 Proxy Statement B-1
Table of Contents

Table of Contents

ONE COMCAST CENTER
PHILADELPHIA, PA 19103
 |
SCAN QR BARCODE
VIEW MATERIALS & VOTE |
 |
VOTE BY INTERNET
Before The Meeting - Go to www.proxyvote.com or scan the QR Barcode above
Use the Internet to transmit your voting instructions up until 11:59 P.M. Eastern Time on May 31, 2022. Please have your proxy card in hand when you access the website and follow the instructions to obtain your records and create an electronic voting instruction form.
During The Meeting - Go to comcast.onlineshareholdermeeting.com
You may attend the Meeting and vote during the Meeting when the polls are open via the Internet. We recommend, however, that you vote before the Meeting even if you plan to participate in the Meeting, since you can change your vote during the Meeting by voting when the polls are open. Have the information that is printed in the box marked by the arrow  available and follow the instructions.
VOTE BY PHONE - 1-800-690-6903
Use any touch-tone telephone to transmit your voting instructions up until 11:59 P.M. Eastern Time on May 31, 2022. Please have your proxy card in hand when you call and then follow the instructions.
VOTE BY MAIL
Mark, sign and date your proxy card and return it in the postage-paid envelope we have provided or return it to Vote Processing, Comcast Corporation, c/o Broadridge Financial Solutions, 51 Mercedes Way, Edgewood, NY 11717.
| TO VOTE, MARK BLOCKS BELOW IN BLUE OR BLACK INK AS FOLLOWS: |
|
| D76277-P68184 |
KEEP THIS PORTION FOR YOUR RECORDS |
| THIS PROXY CARD IS VALID ONLY WHEN SIGNED AND DATED. |
DETACH AND RETURN THIS PORTION ONLY |
|
COMCAST CORPORATION |
|
For
All |
Withhold
All |
For All
Except |
| |
A |
Company Proposals — The Board of Directors recommends a vote "FOR" all the nominees listed in Proposal 1: |
|
☐ |
☐ |
☐ |
|
1. |
Election of Directors |
|
|
|
|
|
|
01 - Kenneth J. Bacon
02 - Madeline S. Bell
03 - Edward D. Breen
04 - Gerald L. Hassell
05 - Jeffrey A. Honickman |
06 - Maritza G. Montiel
07 - Asuka Nakahara
08 - David C. Novak
09 - Brian L. Roberts |
|
|
|
|
| |
The Board of Directors recommends a vote "FOR" Proposals 2 and 3: |
|
For |
Against |
Abstain |
|
2. |
Advisory vote on executive compensation |
|
☐ |
☐ |
☐ |
|
3. |
Ratification of the appointment of our independent auditors |
|
☐ |
☐ |
☐ |
| |
B |
Shareholder Proposals — The Board of Directors recommends a vote "AGAINST" Proposals 4-8 if properly presented at the Annual Meeting: |
|
For |
Against |
Abstain |
|
4. |
To report on charitable donations |
|
☐ |
☐ |
☐ |
|
5. |
To perform independent racial equity audit |
|
☐ |
☐ |
☐ |
|
To withhold authority to vote for any individual nominee(s), mark "For All Except" and write the number(s) of the nominee(s) on the line below. |
|
|
|
| |
|
|
| |
|
|
|
|
|
|
|
For |
Against |
Abstain |
|
6. |
To report on risks of omitting "viewpoint" and "ideology" from EEO policy |
|
☐ |
☐ |
☐ |
|
7. |
To conduct and publicly release the results of an independent investigation into the effectiveness of sexual harassment policies |
|
☐ |
☐ |
☐ |
|
8. |
To report on how retirement plan options align with company climate goals |
|
☐ |
☐ |
☐ |
| |
C |
Authorized Signatures — This section must be completed for your vote to be counted — Date and Sign Within the Box Below |
|
Please sign as name(s) appear(s) hereon. Give full title if you are signing for a corporation, partnership or other entity, or as an attorney,
administrator, executor, guardian, trustee or in any other representative capacity. |
| |
|
|
|
|
|
|
|
Signature [PLEASE SIGN WITHIN BOX] |
Date |
|
Signature (Joint Owners) |
Date |
|
Table of Contents
2022 Annual Meeting of Shareholders
Wednesday, June 1, 2022
9:00 a.m. Eastern Time
comcast.onlineshareholdermeeting.com
ELECTRONIC DELIVERY OF FUTURE PROXY MATERIALS
If you would like to reduce the impact on the environment and save our company money on the costs incurred in mailing proxy materials, you can consent to receiving all future Notices of Internet Availability of Proxy Materials, proxy statements, proxy cards and Annual Reports on Form 10-K electronically via e-mail or the Internet. To sign up, please follow the instructions on the reverse side to vote by Internet before the Meeting and, when prompted, indicate that you agree to receive or access shareholder communications electronically in future years. For further details regarding electronic delivery, please see the "General Information — Notice of Electronic Availability of Proxy Materials" section of our proxy statement.
Important Notice Regarding the Availability of Proxy Materials for the Annual Meeting:
The Notice of Internet Availability of Proxy Materials, the Proxy Statement and the Annual Report are available
at www.proxyvote.com.
| ▼ IF YOU HAVE NOT VOTED VIA THE INTERNET OR TELEPHONE, FOLD ALONG THE PERFORATION, DETACH AND RETURN THE BOTTOM PORTION IN THE ENCLOSED ENVELOPE. ▼ |
| D76278-P68184 |
COMCAST CORPORATION
THIS PROXY IS SOLICITED ON BEHALF OF THE BOARD OF DIRECTORS FOR
THE ANNUAL MEETING OF SHAREHOLDERS ON JUNE 1, 2022.
I hereby appoint Michael J. Cavanagh and Thomas J. Reid, and each of them acting individually, as proxies, with the powers I would possess if personally present, and with full power of substitution, to vote all shares in Comcast Corporation at the Annual Meeting of Shareholders to be held live via the Internet at comcast.onlineshareholdermeeting.com at 9:00 a.m. Eastern Time on June 1, 2022, and at any adjournment or postponement thereof, upon all matters described in the proxy statement that may properly come before the meeting, in accordance with my instructions on the reverse side of this proxy card. In the event that any other matter may properly come before the meeting, or any adjournment or postponement thereof, the proxies are each authorized to vote on such matter in their discretion, including for any replacement nominee nominated for director by the Board of Directors of Comcast Corporation if a director nominee on this proxy card becomes unavailable to serve. I hereby revoke all previous proxies given to vote at the Annual Meeting or any adjournment or postponement thereof.
I acknowledge receipt of the notice of Annual Meeting of Shareholders, the proxy statement and the Annual Report on Form 10-K of Comcast Corporation.
The shares represented by this proxy card will be voted in accordance with your instructions if the card is signed and returned. If you are voting with this proxy card, please mark your choices on the other side of this proxy card, sign it where indicated on the other side and return it promptly to Vote Processing, Comcast Corporation, c/o Broadridge Financial Solutions, 51 Mercedes Way, Edgewood, NY 11717. If your card is signed and returned without instructions, the shares will be voted in favor of all of the director nominees and any replacement nominee, in favor of Proposals 2 and 3, and against Proposals 4-8. If you are voting shares held in the Comcast Employee Stock Purchase Plan or the Comcast-NBCUniversal Employee Stock Purchase Plan, voting by Internet, telephone, mail or in person by ballot will vote all of the shares held by you in such plans, as well as any shares held by you as a shareholder of record. If you hold shares that are not represented by this proxy card, you will receive additional proxy card(s) by mail that will allow you to vote the remaining shares.
Continued and to be signed on reverse side