Tezos (XTZ) Breaks Out Of A Falling Wedge As Price Could Hit $2 Mark
October 18 2022 - 5:00PM
NEWSBTC
XTZ’s price shows a spark of strength as price breaks out from a
descending triangle as price eyes $2 with good volume. XTZ
continues in a range-bound downtrend movement as the price aims to
breakout. The price of XTZ continues to trade below the 50
and 200 Exponential Moving Averages (EMA) on the daily
timeframe. Despite market uncertainties that have affected
the prices of many altcoins in recent weeks, the price of Tezos
(XTZ) has remained strong. Tezos (XTZ) has held firm ahead of a
breakout from its long downtrend, with the price indicating a
possible rally to $2. Bitcoin (BTC) price bounced off its low of
$19,100 to $19,600 as it attempted to rally to a high of $20,000;
this could mean relief bounces for most altcoins. (Data from
Binance) Related Reading: Only In Crypto: A Strudel Pays Rent With
THE Protocol Profits Tezos (XTZ) Price Analysis On The Weekly
Chart. Despite experiencing some great price movement in recent
weeks due to so many partnerships and great projects built on the
Tezos network, XTZ has attracted the attention of traders and
investors with its unique use case as many look for opportunities
to buy. The bear market has had a fair share of the price of XTZ,
as the price of XTZ dropped from a high of $8 to a weekly low of
$1.2, where the price was able to form good support to hold
sell-offs due to panic. The price of XTZ, after forming good
support, price rallied to a high of $2, and the price was rejected
to $1.4 despite showing great strength to break and close above
this resistance. The rejection of XTZ from this region has led to
the price range to build more buyers other than a break out of this
range. Weekly resistance for the price of XTZ – $2. Weekly
support for the price of XTZ – $1.2. Price Analysis Of XTZ On The
Daily (1D) Chart On the daily timeframe, the price of XTZ remains
below its key resistance level of $2; despite bouncing off its
daily low, the price of XTZ faces a test to break above $2. In an
attempt to break out above $2, the price of XTZ has been thrown
into a downtrend range movement, forming a descending triangle as
the price attempts to break out with good volume. If the price of
XTZ breaks and holds above $1.52, we could see a good volume rally
to as high as $2, but if the price of XTZ fails to breakout, the
price could be rejected back into its $1.2-range. Daily resistance
for the XTZ price – $1.52. Daily support for the XTZ price – $1.2.
Related Reading: Shiba Inu Trying To Extricate From Bearish Grip As
SHIB Seen Rising This Week Featured Image From zipmex, Charts From
Tradingview
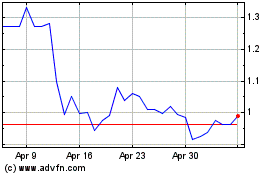
Tezos (COIN:XTZUSD)
Historical Stock Chart
From Mar 2024 to Apr 2024

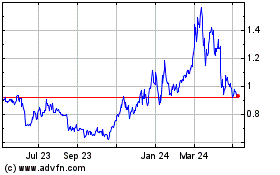
Tezos (COIN:XTZUSD)
Historical Stock Chart
From Apr 2023 to Apr 2024
