Bitcoin Net Taker Volume Nears In On Bullish Crossover
March 29 2023 - 11:00AM
NEWSBTC
On-chain data shows the Bitcoin net taker volume is approaching a
break above a line that has historically been a bullish signal for
the price. Bitcoin Net Taker Volume Has Been Moving Towards Zero
Line Recently As pointed out by an analyst in a CryptoQuant post,
this kind of crossover has appeared four times during the past year
or so. The “net taker volume” is an indicator that measures the
difference between the taker buy and taker sell volumes in the
market. This metric shouldn’t be confused with the taker buy/sell
ratio, which, as its name already implies, tells us about the ratio
between these two volumes, rather than their difference. When the
net taker volume has a positive value, it means the taker buy
volume is currently greater than the taker sell volume. Such a
trend suggests that bullish sentiment is more dominant in the
market right now. On the other hand, the indicator having values
less than zero implies the short volume is overwhelming the long
volume at the moment, and hence, a bearish sentiment is shared by
the majority of the investors. Now, here is a chart that shows the
trend in the 30-day moving average (MA) Bitcoin net taker volume
over the last year: Looks like the 30-day MA value of the metric
has been rising in recent days | Source: CryptoQuant As you can see
in the above graph, the quant has marked the relevant points of the
trend for the 30-day MA Bitcoin net taker volume, as well as the
corresponding pattern that the price of the asset displayed. It
seems like whenever this indicator has crossed above the zero line
from the negative zone, the value of the cryptocurrency has
followed up with riding on some upwards momentum. Related Reading:
Bitcoin Miners Transfer Large Amount To Exchanges, Sign Of Selling?
“When the indicator crosses above zero, it means that over a 30D
Moving Average, the volume through taker BUY orders is higher than
taker SELL orders,” explains the analyst. “This will result in
buying strength for Bitcoin.” In total, there were previously four
instances of this pattern during the past year or so. In some of
these occurrences, the bullish effect came with a bit of delay,
with the most prominent example of this being the crossover that
eventually lead to the current rally in the BTC price. Recently,
the 30-day MA Bitcoin taker net volume has been inside the negative
zone, meaning that sell orders have dominated the market. However,
in the last few days, the metric’s value has been rising, and it is
now once again approaching the zero level. Related Reading: Bitcoin
Mid-Term Holders Move 50,000 BTC, Bearish Signal? If the indicator
continues on this trajectory, then a crossover into the positive
zone can take place, which, if the past pattern is anything to go
by, may have a constructive effect on the price. BTC Price At the
time of writing, Bitcoin is trading around $28,300, up 1% in the
last week. BTC has sharply risen in the past day | Source: BTCUSD
on TradingView Featured image from 2 Bull Photography on
Unsplash.com, charts from TradingView.com, CryptoQuant.com
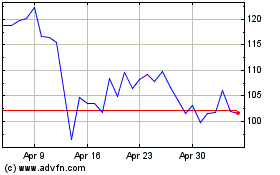
Quant (COIN:QNTUSD)
Historical Stock Chart
From Mar 2024 to Apr 2024

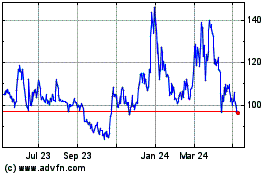
Quant (COIN:QNTUSD)
Historical Stock Chart
From Apr 2023 to Apr 2024
