Solana Shows Bullish Signs Ahead Of 1D Breakout, Can Price Go To $45?
September 12 2022 - 6:36PM
NEWSBTC
Solana (SOL) develops bullish sentiments against tether (USDT), as
the price of Solana (SOL) seeks to rise with an impending breakout
above the current resistance. Bitcoin (BTC) gained significant
strength after closing the weekly candle on a high note, with the
price remaining above $21,700 for the first time in weeks. Most
crypto assets, including Solana (SOL), have benefited from this,
with the price aiming to break out. (Data from Binance) Related
Reading: SEBA Bank To Include Ethereum Staking In Services Solana
(SOL) Price Analysis On The Weekly Chart The price of SOL has
struggled to maintain its bullish momentum in recent months, as it
was rejected from the $45 area, which was acting as a supply zone
for most sellers. Despite growing sentiment that the price of SOL
will rise, SOL has struggled to regain its bullish momentum. The
weekly chart of SOL looks good, as the week ended bullish with more
bullish sentiments. As the price of SOL cannot trend higher, it
faces resistance to breaking above $38. SOL must break above this
level in order for its price to rise to $40 and possibly $45. For a
better chance of trading higher, the price of SOL must break and
hold above this resistance. If the price of SOL breaks out with
significant volume, the price may rise. If the price of SOL fails,
we could see a retest of $31, which would act as a good demand zone
for a price sell-off. The price of SOL appears to be rising as the
market prepares for a relief rally. Weekly resistance for the price
of SOL – $38-$45. Weekly support for the price of SOL – $31. Price
Analysis Of SOL On The Daily (1D) Chart The daily timeframe for SOL
prices appears bullish, with prices aiming to end the day on a high
following a strong weekly candle close. SOL has recovered from a
daily low and is attempting to break above the 50 Exponential
Moving Average. With good volume, the price of SOL would break
above this region of $38, acting as resistance for the price of SOL
to trend higher. If the price of SOL fails to break above $38, it
may retest the lower region of $31 in order to gather more volume
for a possible rally above that price region. On the daily
timeframe, the price of SOL is currently trading at $37, holding
above the 50 Exponential Moving Average (EMA). The price of $36
corresponds to the 50 EMA, which is a resistance to the price of
SOL. If the price of SOL flips the 50 EMA, a strong bullish price
movement is assumed. If the price of SOL flips the 23.6% Fibonacci
(Fib) retracement value, a higher price movement is assumed. On the
daily chart, the Relative Strength Index (RSI) for SOL is above 50,
indicating high buy order volume. Daily resistance for the SOL
price – $45. Daily support for the SOL price – $31. Related
Reading: Ethereum Classic (ETC) Leads Weekly Gains Amidst Crypto
Market Reversal Featured Image From NewsBTC, Charts From
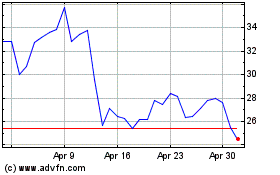
Ethereum Classic (COIN:ETCUSD)
Historical Stock Chart
From Mar 2024 to Apr 2024

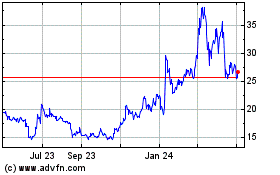
Ethereum Classic (COIN:ETCUSD)
Historical Stock Chart
From Apr 2023 to Apr 2024
