Bitcoin At A Crossroad Around $24,000, Which Side Will Crack First?
February 23 2023 - 6:00PM
NEWSBTC
Bitcoin has formed a range at its current trading level, avoiding a
drop to the $22,000 area by bouncing off its support at $23,500.
Bitcoin is at a crossroads as the bulls and bears are battling to
decide which side will come ahead. As of this writing, the largest
cryptocurrency on the market trades at $23,900, skimming the
$24,000 border. As reported by NewsBTC on February 22nd,
Bitcoin has withstood selling pressure from retail investors while
the whales continue to push the price above the next resistance
level. Can the market price action of BTC find an argument to
resolve the dispute? Related Reading: Polkadot Can Resume Bullish
Momentum Only If It Flips This Level Into Support What Will Be The
Next Move For Bitcoin? As of press time, Bitcoin’s support and
resistance levels appear to have been cleared, leaving the doors
open for its next move to consolidate a new bullish trend or
continue its bearish price action and further freeze buyers. As can
be seen in the chart below, the resistance at the $23,500 level has
been cleared by sellers. The bid wall has moved to the
$22,400 area, and the next resistance level shown on the chart
below appears to be forming at the $25,000 level. With ongoing
concerns about a more hawkish Federal Reserve (Fed) policy and
heavy selling pressure among investors, the bears seem to have the
upper hand in Bitcoin’s short-term price action. Do Bulls Have A
Chance Of Recovering? As the markets alternate between bullish and
bearish sentiment, Bitcoin reacted slightly positively to the U.S.
Gross Domestic Product (GDP) report, spiking close to the $24,000
level. Economist and founder of the trading platform Eight,
Michael Van de Poppe, commented on Bitcoin’s price action, stating
that an economic recession can be avoided with a
lower-than-expected GDP report. The latter is a sign of a
continuation of BTC’s uptrend and the largest cryptocurrencies in
the ecosystem. Van de Poppe said: We dropped towards the lower part
of the area and previous resistance around $23.3K. Significant
bounce from that area for Bitcoin, probably some more
consolidation, and from there, continuation towards $30K. If
Bitcoin’s support holds, the price action can chase the liquidity
of short positions to fuel and continue its uptrend. With Bitcoin’s
resistance level failing to break four times in the last week,
still at the $25,400 level, buyers could have another chance to
return to those levels and aim for new yearly highs at the $27,000
land. Related Reading: Bitcoin Bearish Signal: Exchange Whale Ratio
Surges Bitcoin is trading at $23,950, up slightly in the last 24
hours. BTC has reduced its gains in broader time frames, falling
1.4% over the past seven days. BTC has trimmed its gains
considerably in the fourteen-day timeframe, holding just
4.4%. After an intense bullish price action in mid-February,
Bitcoin has come close to the neutral zone in the thirty-day time
frame, showing gains of 4.3% after rising almost 35% at the
beginning of 2023. Featured image from Unsplash, chart from
TradingView.
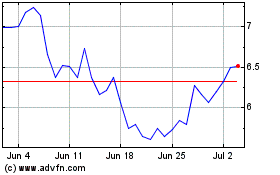
Polkadot (COIN:DOTUSD)
Historical Stock Chart
From Mar 2024 to Apr 2024

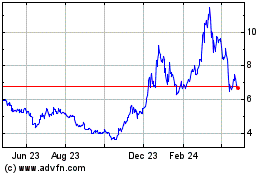
Polkadot (COIN:DOTUSD)
Historical Stock Chart
From Apr 2023 to Apr 2024
