FSI announces record Q3 revenue, record year to date revenue and record year to date earnings of $0.35 cents per share.
November 14 2022 - 4:30PM

FLEXIBLE SOLUTIONS INTERNATIONAL, INC. (NYSE Amex: FSI, FRANKFURT:
FXT)
, is the developer and manufacturer of
biodegradable polymers for oil extraction, detergent ingredients
and water treatment as well as crop nutrient availability
chemistry. Flexible Solutions also manufactures biodegradable and
environmentally safe water and energy conservation technologies.
Today the Company announces financial results for the third quarter
(Q3) ended September 30, 2022.
Mr. Dan O’Brien, CEO, states, “This quarter is
the third year over year record revenue quarter in a row. It
results in a record year to date for both sales and profits.
Earnings were affected by high raw materials and shipping costs in
Q3 but both items are stabilizing. Q4, so far, looks very good and
we feel confident that 2022 will finish strongly.” Mr. O’Brien
continues, “We look forward to working hard and beating our 2022
records in 2023.”
- Sales in the
third quarter (Q3) were up 27% to $11,685,107, compared to sales of
$9,214,467 in the corresponding period a year ago.
- Q3, 2022 net
profit was $1,108,131, or $0.09 per share, compared to a net profit
of $1,162,624, or $0.09 per share, in Q3, 2021. [raw material costs
and product mix reduced margins temporarily]
- Sales during the first nine months
of 2022 rose 33% to $33,633,530 versus sales of $25,374,615 for the
corresponding nine months of 2021.
- Profit for the first nine months of
2022 was up 14% to $4,303,645,or $0.35 per share, compared to a
profit of $3,789,956, or $0.31 per share, for the same period of
2021(see costs related to terminated merger below).
- Earnings per share for the nine
months of 2022 would have been $0.37, compared to the $0.35 given
in the financials, if not for the expenses related to the
merger.
- Non-GAAP operating cash flow: The
Company shows nine month operating cash flow up 25% to $6,874,680,
or $0.56 per share. This compares with operating cash flow of
$5,505,516, or $0.45 per share, in the corresponding 9 months of
2021 (see the table that follows for details of these
calculations).
- During the first 9 months of 2022
one-time costs, related to the discontinued merger, were $417,974.
If these one-time costs are removed year to date operating cash
flow would be $7,292,654 or $0.59 cents per share, compared to
$5,505,516, or $0.45 per share, in the corresponding nine months of
2021.
The NanoChem division continues to be the
dominant source of revenue and cash flow for the Company. New
opportunities continue to unfold in agriculture, food products,
detergent ingredients, water treatment and oil field extraction to
further increase sales in this division.
Conference callA
conference call has been scheduled for 11:00 am
Eastern Time, 8:00 am Pacific Time, on
Tuesday,
November 15th. CEO, Dan O’Brien
will be presenting and answering questions on the conference call.
To participate in this call please dial 1
800-245-3047
(or 1
203-518-9765)
just prior to the scheduled call time. The conference call title,
“FSI Third
Quarter
2022
Financial Results,” may be
requested.
Page 2…The above information and following table
contain supplemental information regarding income and cash flow
from operations for the period ended September 30, 2022.
Adjustments to exclude depreciation, stock option expenses and one
time charges are given. This financial information is a Non-GAAP
financial measure as defined by SEC regulation G. The GAAP
financial measure most directly comparable is net
income. The reconciliation of each of the Non-GAAP
financial measures is as follows:
FLEXIBLE SOLUTIONS INTERNATIONAL,
INC.Consolidated Statement of
OperationsFor 3
Months Ended September
30
(9 Months Operating Cash
Flow) (Unaudited)
| |
|
3 months ended September 30 |
|
|
|
| |
|
2022 |
|
|
2021 |
|
|
|
| Revenue |
|
$ |
11,685,107 |
|
|
$ |
9,214,467 |
|
|
|
| Income (loss) before income
tax - GAAP |
|
$ |
1,669,992 |
|
|
$ |
2,370,362 |
|
|
|
| Provision for Income tax
(expense) / recovery - GAAP |
|
$ |
(349,181 |
) |
|
$ |
(864,510 |
) |
|
|
| Net income (loss) (controlling
interest only) - GAAP |
|
$ |
1,108,131 |
|
|
$ |
1,162,624 |
|
|
|
| Net income (loss) per common
share – basic. - GAAP |
|
$ |
0.09 |
|
|
$ |
0.09 |
|
|
|
| 3 month weighted average
shares used in computing per share amounts – basic.-
GAAP |
|
|
12,384,746 |
|
|
|
12,324,539 |
|
|
|
| |
|
|
9 month Operating Cash Flow Ended September
30 |
|
|
|
| Operating Cash Flow (9
months). NON-GAAP |
|
|
$6,874,680 a,b,c |
|
|
|
$5,505,516 a,b,c |
|
|
|
| |
|
|
|
|
|
|
|
|
|
|
| Operating Cash Flow per share
excluding non-operating items and items not related to current
operations (9 months) – basic. NON-GAAP |
|
|
$ 0.56
a,b,c |
|
|
|
$ 0.45
a,b,c |
|
|
|
| Non-cash Adjustments (9 month)
GAAP |
|
|
$ 976,539 d |
|
|
|
$ 829,350 d |
|
|
|
| 9 month weighted average
shares used in computing per share amounts – basic -
GAAP |
|
|
12,376,818 |
|
|
|
12,312,503 |
|
|
|
| |
|
|
|
|
|
|
|
|
|
|
Notes: certain items not
related to “operations” of the Company have been excluded from net
income as follows.
a) Non-GAAP
-:: Flexible Solutions International
purchased 65% of ENP in 4th
quarter, 2018 (October 2018). Therefore Operating Cash Flow
is adjusted by the net income or
loss of the non-controlling interest in ENP
(2022 =
$523,272, 2021 =
$798,161).
b) Non-GAAP - amounts exclude certain cash
and non-cash items: depreciation and stock compensation expense
(2022 =
$976,536,
2021 =
$829,350),
interest expense (2022
= $190,366,
2021 =
$155,078), interest income
(2022 =
$69,354,
2021 =
$67,920), gain on investment
(2022 =
$213,865,
2021 =
$491,681), gain
on acquisition of ENP Peru (2022 = 335,051, 2021 =
N/A) PPP loan forgiveness
(2022 =
N/A,
2021 =
$537,960), write down of inventory
(2022 = N/A,
2021 = N/A),
deferred income tax recovery (2022
= N/A, 2021
= N/A),
Income tax (2022
= $1,604,429,
2021 =
$1,828,693), and Net
income attributable to non-controlling
interests(see a above). See the
financial statements for all adjustments.c) The
revenue and gain from the 50% investment in the private Florida
LLC, announced in January
2019, is not treated as revenue
or profit from operations by Flexible Solutions given the Company
only purchased 50% of the LLC. The profit is treated as investment
income and therefore occurs below Operating income in the Statement
of Operations. As a result, the
gains from all investments, including that of the Florida LLC, are
removed from the calculation to arrive at Operating Cash
Flow. Also, the legal and
accounting costs associated with the attempted merger of
FSI and Lygos
(2022 =
$417,974 ,
2021 = N/A) (see news
releases) are
removed to arrive at Operating Cash Flow. Although
included in operating expenses
these
one time specific
expenditures
were not
related to
of operations of FSI. d) Non-GAAP –
amounts represent depreciation and stock compensation
expense.
Safe Harbor Provision
The Private Securities Litigation Reform Act of
1995 provides a "Safe Harbor" for forward-looking statements.
Certain of the statements contained herein, which are not
historical facts, are forward looking statement with respect to
events, the occurrence of which involve risks and uncertainties.
These forward-looking statements may be impacted, either positively
or negatively, by various factors. Information concerning potential
factors that could affect the company is detailed from time to time
in the company's reports filed with the Securities and Exchange
Commission.
Flexible Solutions
International, Inc.6001
54th Ave, Taber, Alberta, CANADA
T1G 1X4
Company ContactsJason BloomToll Free: 800 661
3560Fax: 403 223 2905E-mail: info@flexiblesolutions.com
If you have received this news release by
mistake or if you would like to be removed from our update list
please reply to: info@flexiblesolutions.com To find out more
information about Flexible Solutions and our products, please visit
www.flexiblesolutions.com.
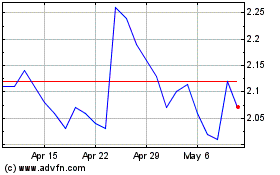
Flexible Solutions (AMEX:FSI)
Historical Stock Chart
From Mar 2024 to Apr 2024

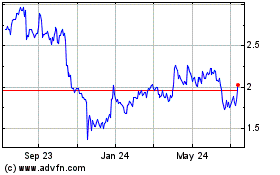
Flexible Solutions (AMEX:FSI)
Historical Stock Chart
From Apr 2023 to Apr 2024
