Sell in May? - Real Time Insight
April 30 2012 - 9:35AM
Zacks
The “Sell in May” thesis is strongly backed by market performance
statistics going back over six decades. Depending on which index
you look at (Dow or S&P), the strong six months from November
to April have outperformed the weak six months of May to October by
an average of 6 to 7 percentage points per year since
1950.
Anyone can see that markets tend to make summer-fall market dives
that provide big buying opportunities, regardless of the particular
economic catalyst(s). And the subsequent winter-spring rallies are
ripe for profit-taking before the summer doldrums (and Wall Street
vacations) come round again.
This seasonal strategy is not fool-proof, of course. But if
portfolio managers have made decent gains in a six-month period,
chances are they will play the odds in their favor and take
substantial profits before they possibly erode.
Thus, it’s
easy to see how “Sell in May” becomes self-fulfilling. It’s not
just automatic because the calendar flipped past April. It’s
relative to where you’ve been and what you’ve done in terms of
gains and losses. In the context of big gains from a classic
October bottom, the temptation for the buy-side to cash in ahead of
the high-probability “sideways-to-lower” trade into summer is
simply irresistible.
In short, since they were all mostly long from the bottom, they
can’t afford not to do some simple re-allocation when they know the
PMs standing next to them are likely to feel the same
way.
In this 3-year bull market, 2009 was a year you were better off
staying invested, while in 2010 and 2011, the seasonal
trade worked.
So, what do you think happens in 2012? Does this May tilt you
toward the seasonal effect because of the big gains already on the
table?
Or do you see a simply "sideways-to-lower" trade with economic
catalysts being fairly balanced?
Anybody still a raging bull?
To read this article on Zacks.com click here.
Zacks Investment Research
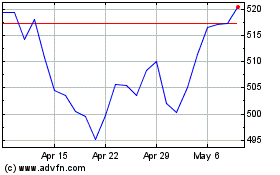
SPDR S&P 500 (AMEX:SPY)
Historical Stock Chart
From Mar 2024 to Apr 2024

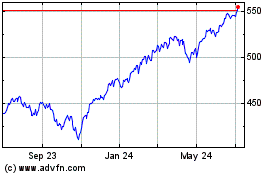
SPDR S&P 500 (AMEX:SPY)
Historical Stock Chart
From Apr 2023 to Apr 2024
