Due to the accidental slip of the first quarter 2012 results
last week, MetLife Inc. (MET) again had to come up
with the complete results after the closing bell on April 26,
2012
The company unfortunately started the fiscal 2012 by reporting
loss in the first quarter of 2012. MetLife registered net operating
earnings of $1.46 billion or $1.37 per share compared with $1.32
billion or $1.23 per share in the year-ago quarter. This also
compares favorably with the Zacks Consensus Estimate of $1.30 per
share.
However, including extraordinary items, which primarily included
losses from derivatives amounting to $1.3 billion, the company
incurred net loss of $174 million or 16 cents per share in the
reported quarter. This deteriorated drastically from an income of
$701 million or 66 cents in the year-ago period.
During the reported quarter, MetLife incurred derivative losses
of about $2.0 billion or $1.85 per share, along with investment
losses and other items worth $110 million or 10 cents per share.
Other adjustments to continuing operations amounted to $410 million
or 38 cents per share.
These were partially offset by an income tax benefit of $871
million or 81 cents per share, income from discontinued operations
of $14 million or 1 cent per share and net income attributable to
non-controlling interest of $24 million or 2 cents per share.
Total revenue in the reported quarter was $15.92 billion,
slightly more than the prior quarter level of $15.91 billion but
well below the Zacks Consensus Estimate of $16.36 billion.
MetLife’s premiums grew 6.7% year over year to $9.13 billion, led
by the ALICO acquisition.
Fee revenue increased 10% to $2.1 billion, while net investment
income rose 16.7% year over year to $6.2 billion. Other revenues
witnessed 5.5% year-over-year growth to $597 million.
Meanwhile, MetLife’s total operating expenses ascended 6.6% year
over year to $14.6 billion during the reported quarter.
Segment Details
As ALICO has amplified the company’s international presence
substantially, in November 2011, MetLife also restructured its
revenue streams into three business segments to capitalize on
geographic differences. Earlier, the company reported in two
geographical segments, namely the US and International. Hence,
effective first quarter of 2012, MetLife has started reporting
results under the following:
The Americas generated operating revenues of
$12.36 billion, up 6.5% year over year. Operating premiums, fees
and other revenue increased 7.2% to $8.3 billion. Operating
earnings escalated 13.1% year over year to $1.12 billion,
reflecting higher claims and benefits.
The segment witnessed modest improvement across annuities,
individual and group life and non-medical health products, despite
marginal progress in corporate benefit funding. Even Latin America
contributed to the growth decently.
Operating revenue from Asia was up 12.0% year
over year to $2.94 billion, while premiums, fees and other revenue
grew 8% to $2.3 billion. Operating earnings surged 33% year over
year to $297 million, reflecting improved performance from ALICO.
The growth was also supported by flourishing business in Japan,
Korea and Australia.
Operating revenue from EMEA rose 8.4% year over
year to $1.08 billion. Premiums, fees and other revenue in
this segment climbed 9% to $899 million. However, operating
earnings declined 4% year over year to $76 million, reflecting
weakness in the foreign exchange rates. However, the performance in
Middle East and Turkey were a let down.
Separately, Corporate & Other operating
revenue plunged 21.2% year over year to $305 million as premiums,
fees and other revenue plummeted 22.2% to $105 million.
Consequently, an operating loss of $68 million was recorded at $104
million, far wider than a loss of $9 million in the prior-year
quarter.
Financial Update
As of March 31, 2012, MetLife’s book value per share, excluding
accumulated other Comprehensive income (AOCI), increased 10% year
over year to $46.52. Reported book value (including AOCI) per share
escalated 23% to $53.37 from $43.42 at the end of the first quarter
2011.
Moreover, MetLife had total investments of $503.94 billion as of
March 31, 2012, down from $511.38 billion at 2011end. However, cash
and cash equivalents surged to $18.67 billion, while total assets
increased to $819.60 billion from $796.23 billion on December 31,
2011, long-term debt slightly moved down to $23.39 billion from
$23.69 billion and total equity increased to $59.01 billion from
$57.9 billion at 2011 end.
Outlook for 2012
Along with its earnings release, MetLife also updated its 2012
guidance. The company now expects 2012 operating earnings in the
band of $5,140 - $5,570 million or $4.80 - $5.20 per share.
The company expects The Americas segment to record operating
earnings in the range of $3,925 - $4,195, Asia in the $1,110 -
$1,210 million range, and the EMEA segment in the range of $275 -
$325 million.
Divestiture
MetLife decided to exit its retail banking operations as it
contributed a very low percentage in the company’s profit.
Nationstar Mortgage LLC volunteered to take up MetLife Bank's
reverse mortgage servicing portfolio for an undisclosed price.
Legal Action
MetLife filed a suit of over $757 million against New York based
global bank, Morgan Stanley for fraud in residential mortgage
securities purchased in 2006 and 2007.
Peer Take
Besides, MetLife’s prime peer, American International
Group Inc. (AIG), is expected to release its first quarter
financial results after the market closes on May 3, 2012. Another
close competitor, Prudential Financial Inc. (PRU)
is slated to release its results after the closing bell on May 2,
2012.
We retain our long-term Neutral recommendation on MetLife. The
quantitative Zacks #3 Rank (short-term Hold rating) for the company
indicates no clear directional pressure on the stock over the near
term.
AMER INTL GRP (AIG): Free Stock Analysis Report
METLIFE INC (MET): Free Stock Analysis Report
PRUDENTIAL FINL (PRU): Free Stock Analysis Report
To read this article on Zacks.com click here.
Zacks Investment Research
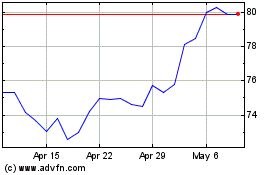
American (NYSE:AIG)
Historical Stock Chart
From Mar 2024 to Apr 2024

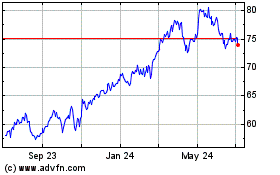
American (NYSE:AIG)
Historical Stock Chart
From Apr 2023 to Apr 2024
