Dragon Capital Group Corp. (PINKSHEETS: DRGV), a leading holding
company of emerging high-tech companies in China, announced today
the company's financial results for the third quarter and first
nine months of 2010 ended June 30, 2010.
Financial Highlights:
Revenue for the third quarter ended September 30, 2010 was $11.3
million as compared to $14.2 million recorded in the third quarter
of 2009. Cost of goods sold for the third quarter of 2010 were
$10.7 million compared to $13.3 million in the third quarter of
2009. Net income for the third quarter of 2010 was $951 as compared
to $198,900 recorded in the third quarter of 2009. The decrease in
revenue and net income was largely attributable to a decrease in
sales at our Huice and Longri subsidiaries which service the
information technology and networking industries.
Nine-Month Financial Results
Revenue for the first nine months of 2010 was $39.1 million, a
slight decrease from the $41.1 million recorded in the first nine
months of 2009. For the first nine months of 2010, net income
attributable to Dragon Capital Group Corp. was $126,900, a
significant improvement from the net loss of ($355,000) recorded in
the first nine months of 2009. The improvement in net income was
attributable to a reduction in selling expenses and a loss recorded
in 2009 from the sale of its Fomde subsidiary.
Balance Sheet
At September 30, 2010, total assets were $15.9 million with
$15.6 million in current assets. This compares to total assets of
$15.2 million with $14.9 million in current assets at December 31,
2009. At September 30, 2010, shareholder equity improved to $8.0
with working capital of $9.0 million compared to shareholder equity
of $7.4 million with working capital of approximately $8.2 million
at December 31, 2009.
Mr. Lawrence Wang, CEO of Dragon Capital Group, stated, "While
we experienced some softness in our networking and information
technology subsidiaries in the quarter we remain extremely pleased
with our performance in the first nine months of 2010. Our bottom
line results have improved markedly when compared to 2009 and the
overall economic environment in China is strengthening. We continue
in our efforts to increase shareholder value as we look to trim
costs and improve our performance as we move through the remainder
of the year and gear up for 2011."
About Dragon Capital Group Corporation
Dragon Capital Group Corp. (PINKSHEETS: DRGV) is doing business
in China through its subsidiaries. Dragon was established to serve
as a conduit between Chinese high-growth companies and Western
investors. DRGV functions as an incubator of high-tech companies in
China, offering support in the critical functions of general
business consulting, formation of joint ventures, access to
capital, merger & acquisition, business valuation, and revenue
growth strategies. DRGV has developed a portfolio of high-tech
companies operating in China. For more information about DRGV,
please visit http://www.dragoncapital.us
               DRAGON CAPITAL GROUP, CORP. AND SUBSIDIARIES
                        CONSOLIDATED BALANCE SHEET
                                (Unaudited)

                       ASSETS

                                               September 30,  December 31,
                                              -------------- --------------
                                                  2010           2009
                                              -------------- --------------
CURRENT ASSETS:
  Cash and cash equivalents                   $    1,550,977 $    2,236,878
  Accounts receivable, net of allowance for
   doubtful accounts of $156,087 and
   $152,533, respectively                          5,491,594      5,568,519
  Other receivables                                1,423,633      1,179,751
  Inventories                                      6,720,833      5,567,730
  Investment in marketable securities                 70,000        114,800
  Prepaid taxes                                       23,374              -
  Prepaid expenses and other                         279,658        190,232
                                              -------------- --------------
    Total Current Assets                          15,560,069     14,857,910

DERIVATIVE RECEIVABLE                                 54,978         54,978
DUE FROM RELATED PARTY                                73,155         71,667
PROPERTY AND EQUIPMENT - Net                         241,086        240,254
                                              -------------- --------------
    Total Assets                              $   15,929,288 $   15,224,809
                                              ============== ==============

   LIABILITIES AND STOCKHOLDERS' EQUITY
CURRENT LIABILITIES:
  Loans payable                               $       59,718 $      102,381
  Loans payable-related party                         22,000         22,000
  Accounts payable and accrued expenses            5,464,212      5,620,321
  Other payable                                      845,782        685,206
  Taxes payable                                      128,478         60,274
  Advances from customers                              1,553          1,521
  Due to related party                               116,895        141,031
                                              -------------- --------------
    Total Current Liabilities                      6,638,638      6,632,734
                                              -------------- --------------

EQUITY:
Dragon Capital Group, Corp.
  Common Stock ($0.001 Par Value;
   500,000,000 Shares Authorized;
   312,735,578 and 259,644,578 shares
   issued and outstanding at September 30,
   2010 and December 31, 2009, respectively)         312,736        259,645
  Additional paid-in capital                       5,488,834      5,244,770
  Accumulated retained earnings                    1,273,412      1,146,484
  Accumulated comprehensive income                   902,841        760,092
                                              -------------- --------------
    Total Dragon Capital Group, Corp.              7,977,823      7,410,991
                                              -------------- --------------
    Noncontrolling interest                        1,312,827      1,058,105
                                              -------------- --------------
      Total Equity                                 9,290,650      8,592,075
                                              -------------- --------------
        Total Liabilities and Equity          $   15,929,288 $   15,224,809
                                              ============== ==============

        See notes to unaudited consolidated financial statements.


               DRAGON CAPITAL GROUP, CORP. AND SUBSIDIARIES
                   CONSOLIDATED STATEMENT OF OPERATIONS
                                (Unaudited)

                    For the Three Months Ended  For the Nine Months Ended
                          September 30,               September 30,
                    --------------------------  --------------------------
                        2010          2009          2010          2009
                    ------------  ------------  ------------  ------------
NET REVENUES        $ 11,335,354  $ 14,165,556  $ 39,123,826  $ 41,065,365
COST OF SALES         10,743,203    13,299,065    37,079,454    38,746,832
                    ------------  ------------  ------------  ------------
GROSS PROFIT             592,151       866,491     2,044,372     2,318,533
                    ------------  ------------  ------------  ------------

OPERATING EXPENSES:
  Selling expenses       240,686       341,807       676,200       910,513
  Loss on
   disposition of
   property and
   equipment                   -             -         1,609             -
  General and
   administrative        248,154       168,497       836,293       608,467
                    ------------  ------------  ------------  ------------
    Total Operating
     Expenses            488,840       510,304     1,514,102     1,518,980
                    ------------  ------------  ------------  ------------
INCOME FROM
 OPERATIONS              103,311       356,187       530,270       799,553
                    ------------  ------------  ------------  ------------

OTHER INCOME
 (EXPENSE)
  Other income
   (expense)               1,588           142        (6,174)        2,847
  Interest income
   (expense)              (7,316)      (22,827)      (16,477)      (23,931)
                    ------------  ------------  ------------  ------------
    Total Other
     Expense              (5,728)      (22,685)      (22,651)      (21,084)
                    ------------  ------------  ------------  ------------
INCOME BEFORE
 DISCONTINUED
 OPERATIONS, INCOME
 TAXES AND
 NONCONTROLLING
 INTEREST                 97,583       333,502       507,619       778,469

DISCONTINUED
 OPERATIONS:
  Loss on sale
   of Fomde
   subsidiaries                -             -             -      (714,983)
  Gain from
   discontinued
   operations                  -             -             -         5,603
                    ------------  ------------  ------------  ------------
    Total loss from
     discontinued
     operations                -             -             -      (709,380)

INCOME BEFORE
 INCOME TAXES AND
 NONCONTROLLING
 INTEREST                 97,583       333,502       507,619        69,089
INCOME TAXES             (61,802)      (42,838)     (248,948)     (218,220)
                    ------------  ------------  ------------  ------------
NET INCOME (LOSS)         35,781       290,664       258,671      (149,131)
Less: Net income
 attributable to
 noncontrolling
 interest                (34,830)      (91,762)     (131,743)     (205,956)
                    ------------  ------------  ------------  ------------
NET INCOME (LOSS)
 ATTRIBUTABLE TO
 DRAGON CAPITAL
 GROUP, CORP.                951       198,902       126,928      (355,087)
                    ============  ============  ============  ============

NET INCOME (LOSS)
 PER COMMON SHARE:
  Net (loss)
   income from
   continuing
   operations and
   discontinued
   operations       $       0.00  $       0.00  $       0.00  $       0.00
  Weighted common
   shares
   outstanding -
   basic and
   diluted           310,344,274   259,644,578   295,222,640   259,644,578
                    ============  ============  ============  ============

AMOUNTS
 ATTRIBUTABLE TO
 DRAGON CAPITAL
 GROUP, CORP.
COMMON
 SHAREHOLDERS:
  Income from
   continuing
   operations, net
   of tax                    951       198,902       126,928       354,293
  Loss from
   discontinued
   operations, net
   of tax                      -             -             -      (709,380)
                    ------------  ------------  ------------  ------------
    Net income
     (loss)                  951       198,902       126,928      (355,087)
                    ============  ============  ============  ============

      See notes to unaudited consolidated financial statements.
Safe Harbor Statement
Certain statements set forth in this press release constitute
"forward-looking statements." Forward-looking statements include,
without limitation, any statement that may predict, forecast,
indicate, or imply future results, performance or achievements, and
may contain the word expressions of similar meaning. Such
statements are not guarantees of future performance and are subject
to risks and uncertainties that could cause the company's actual
results and financial position to differ materially from those
included within the forward-looking statements. Forward-looking
statements involve risks and uncertainties, including those
relating to the Company's ability to grow its business. Actual
results may differ materially from the results predicted and
reported results should not be considered as an indication of
future performance.
Contact: Investor Relations: Lillian Wong Tel: 954-363-7333 ext.
317
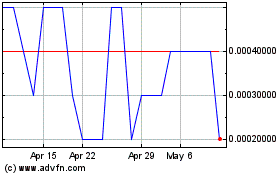
Dragon Capital (PK) (USOTC:DRGV)
Historical Stock Chart
From Mar 2024 to Apr 2024

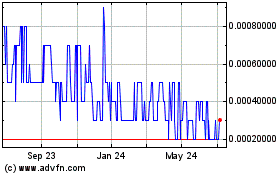
Dragon Capital (PK) (USOTC:DRGV)
Historical Stock Chart
From Apr 2023 to Apr 2024
