Hot Features
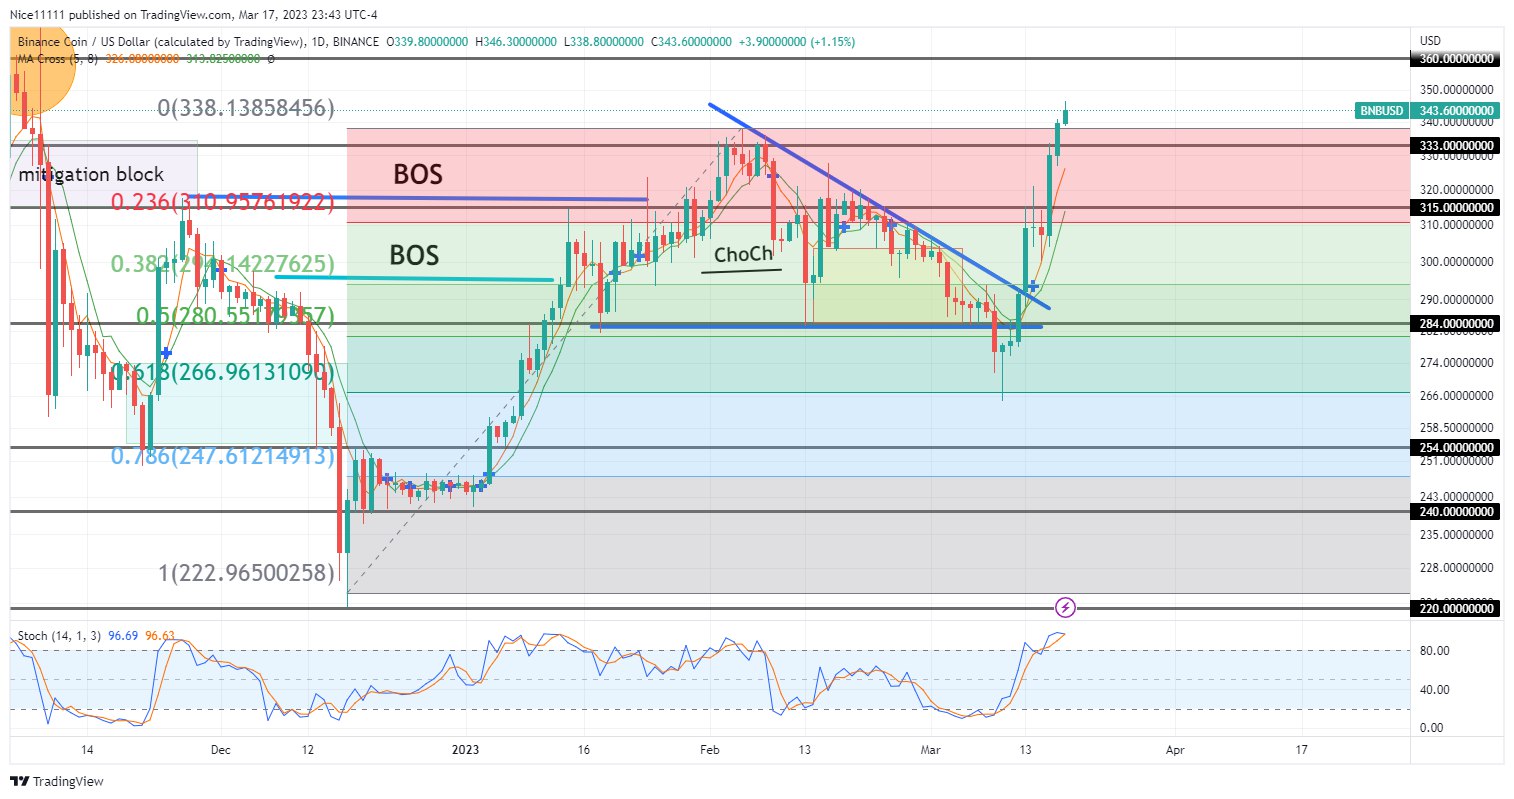
BNBUSD ascent was initiated at the $220.0 demand level. The market skyrocketed to $315.0 to take out the previous high, which served as a resistance. The market reached $315.0 in a single bullish displacement. The buyers experienced a minor retracement to $284.0 to gather strength for a continuation of the bullish ascent. The price rose afterward to the supply level of $333.00. A change of Character (ChoCh) was observed in February with the failure of a bullish order block. A resistance trendline guided the daily candles for a major pullback to $267.0. The $267.0 aligned perfectly with a fair value gap at the 61.8% level of the swing. The Buyers utilized the discounted price to fill large orders. The buying pressure has pushed the price above the trendline. The market is currently soaring rapidly toward the $360.0 resistance level.

BNBUSD Key Zones
Demand Zones: $254.0, $240.0, $220.0
Supply Zones: $315.0, $333.0, $360.0
What Are the Indicators Saying?
BNBUSD ascent was initiated in December when the Stochastic showed the market was oversold. The uptrend was confirmed when the Moving Averages of period five moved above the Moving Average of period eight above the $220.0 demand level. The Moving Average in period five rested above the Moving Average in period nine from the inception of January above $240.0 to $333.0 in February. The major pullback in BNB’s market was observed after the cross of the Moving Averages. The price declined steadily below $284.0. The market has finally resumed its bullish trend with the Moving Average crossing in March at the oversold region underneath the $284.0 zone. The price is currently ascending towards $360.0.
Learn from market wizards: Books to take your trading to the next level